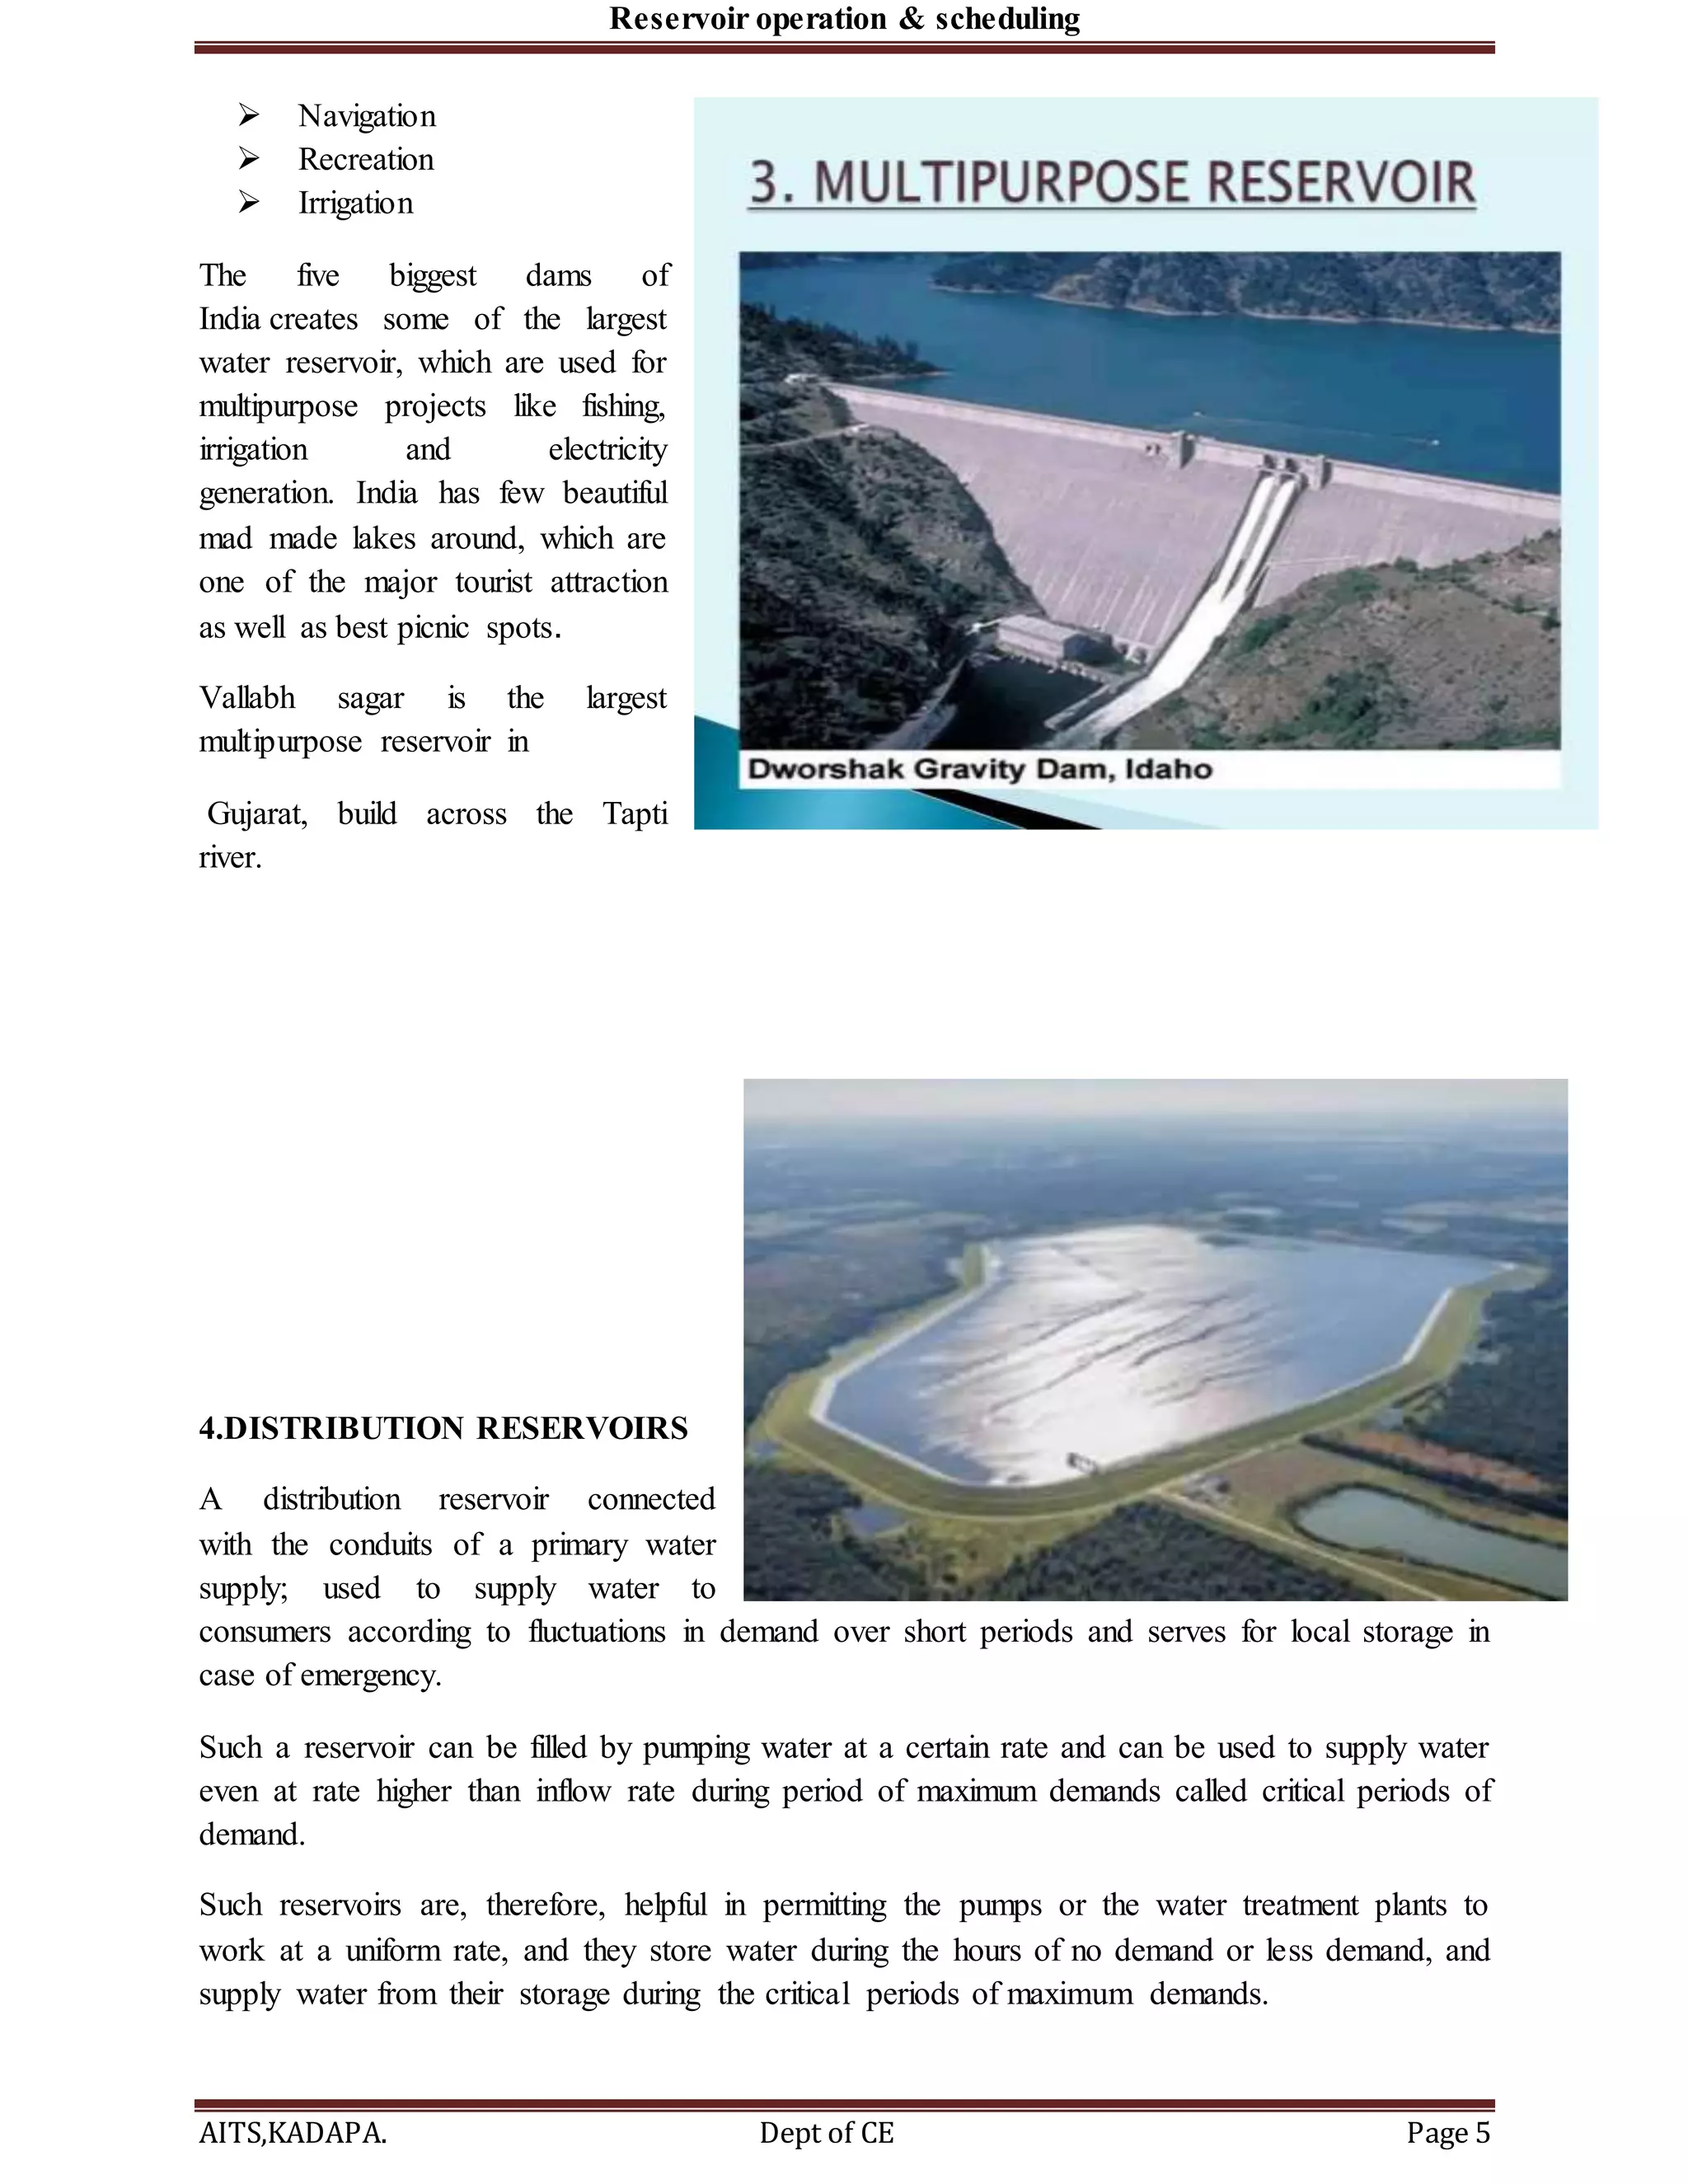
This document provides an overview of reservoir operation and scheduling. It discusses how reservoirs are used to regulate natural stream flow by storing surplus water in wet seasons and releasing it in dry seasons. This equalizes the natural stream flow and changes the temporal and spatial availability of water. Reservoirs are commonly built for conservation and flood control purposes. The operation of reservoirs involves resolving conflicts between storage needs for conservation versus empty space needs for flood control. Reservoir operation policies specify water release amounts based on the reservoir state, demands, and expected inflows. The document also discusses irrigation scheduling and literature on optimizing reservoir operation for multiple purposes.


![Reservoir operation & scheduling
AITS,KADAPA. Dept of CE Page 18
to be accorded to the status. Its reservoir spreads into parts of Chhattisgarh and Odisha states
also.
Polavaram Dam
Polavaram Right canal near Eluru
Location Polavaram, West Godavari
District, Andhra Pradesh, India
Coordinates
17°15′40″N81°39′23″ECoordinates:
17°15′40″N 81°39′23″E
Purpose Irrigation, power and transport
Status under construction
Construction began 2004
Opening date 2019.[1]
Operator(s) Andhra Pradesh Irrigation Department
Dam and spillways
Type of dam Concrete spill way (754 m), Non over
flow masonry dam (560 m) & Earth
dam (1600 m)](https://image.slidesharecdn.com/12354565681-190216052454/75/1235456568-1-18-2048.jpg)
![Reservoir operation & scheduling
AITS,KADAPA. Dept of CE Page 19
Impounds Godavari River
Height 39.28 m (129 ft) up to top of earth
dam above the lowest river bed.
Length 2,914 m (9,560 ft)
Spillway type Chute spillway
Spillway capacity 5,000,000 cusecs at 140 ft msl
Reservoir
Creates Polavaram Reservoir
Total capacity 194 tmcft at FRL 150 ft msl
Active capacity 175 tmcft (at 25.4 m msl crest level of
spillway)
Inactive capacity 19 tmcft (below 25.4 m msl)
Catchment area 307,800 km2
(118,800 sq mi)
Surface area 600 km2
(230 sq mi)
Maximum water depth 32.08 m at FRL 150 ft msl
Power Station
Operator(s) APGENCO
Turbines 12 × 80 MW Kaplan-type (left bank
side)
Installed capacity 960 MW (under construction)[2]](https://image.slidesharecdn.com/12354565681-190216052454/75/1235456568-1-19-2048.jpg)


![Reservoir operation & scheduling
AITS,KADAPA. Dept of CE Page 33
Assumption is
B1t
i = Bt
1
B2t
i = Bt
2 ∀ t
B3t
i = Bt
3
Where B1t
i
, B2t
i , B3t
i are the net unit benefits from the reservoir i.
Bt
1 is the release , Bt
2 is the flood control and Bt
3 is the storage at respective reservoirs.
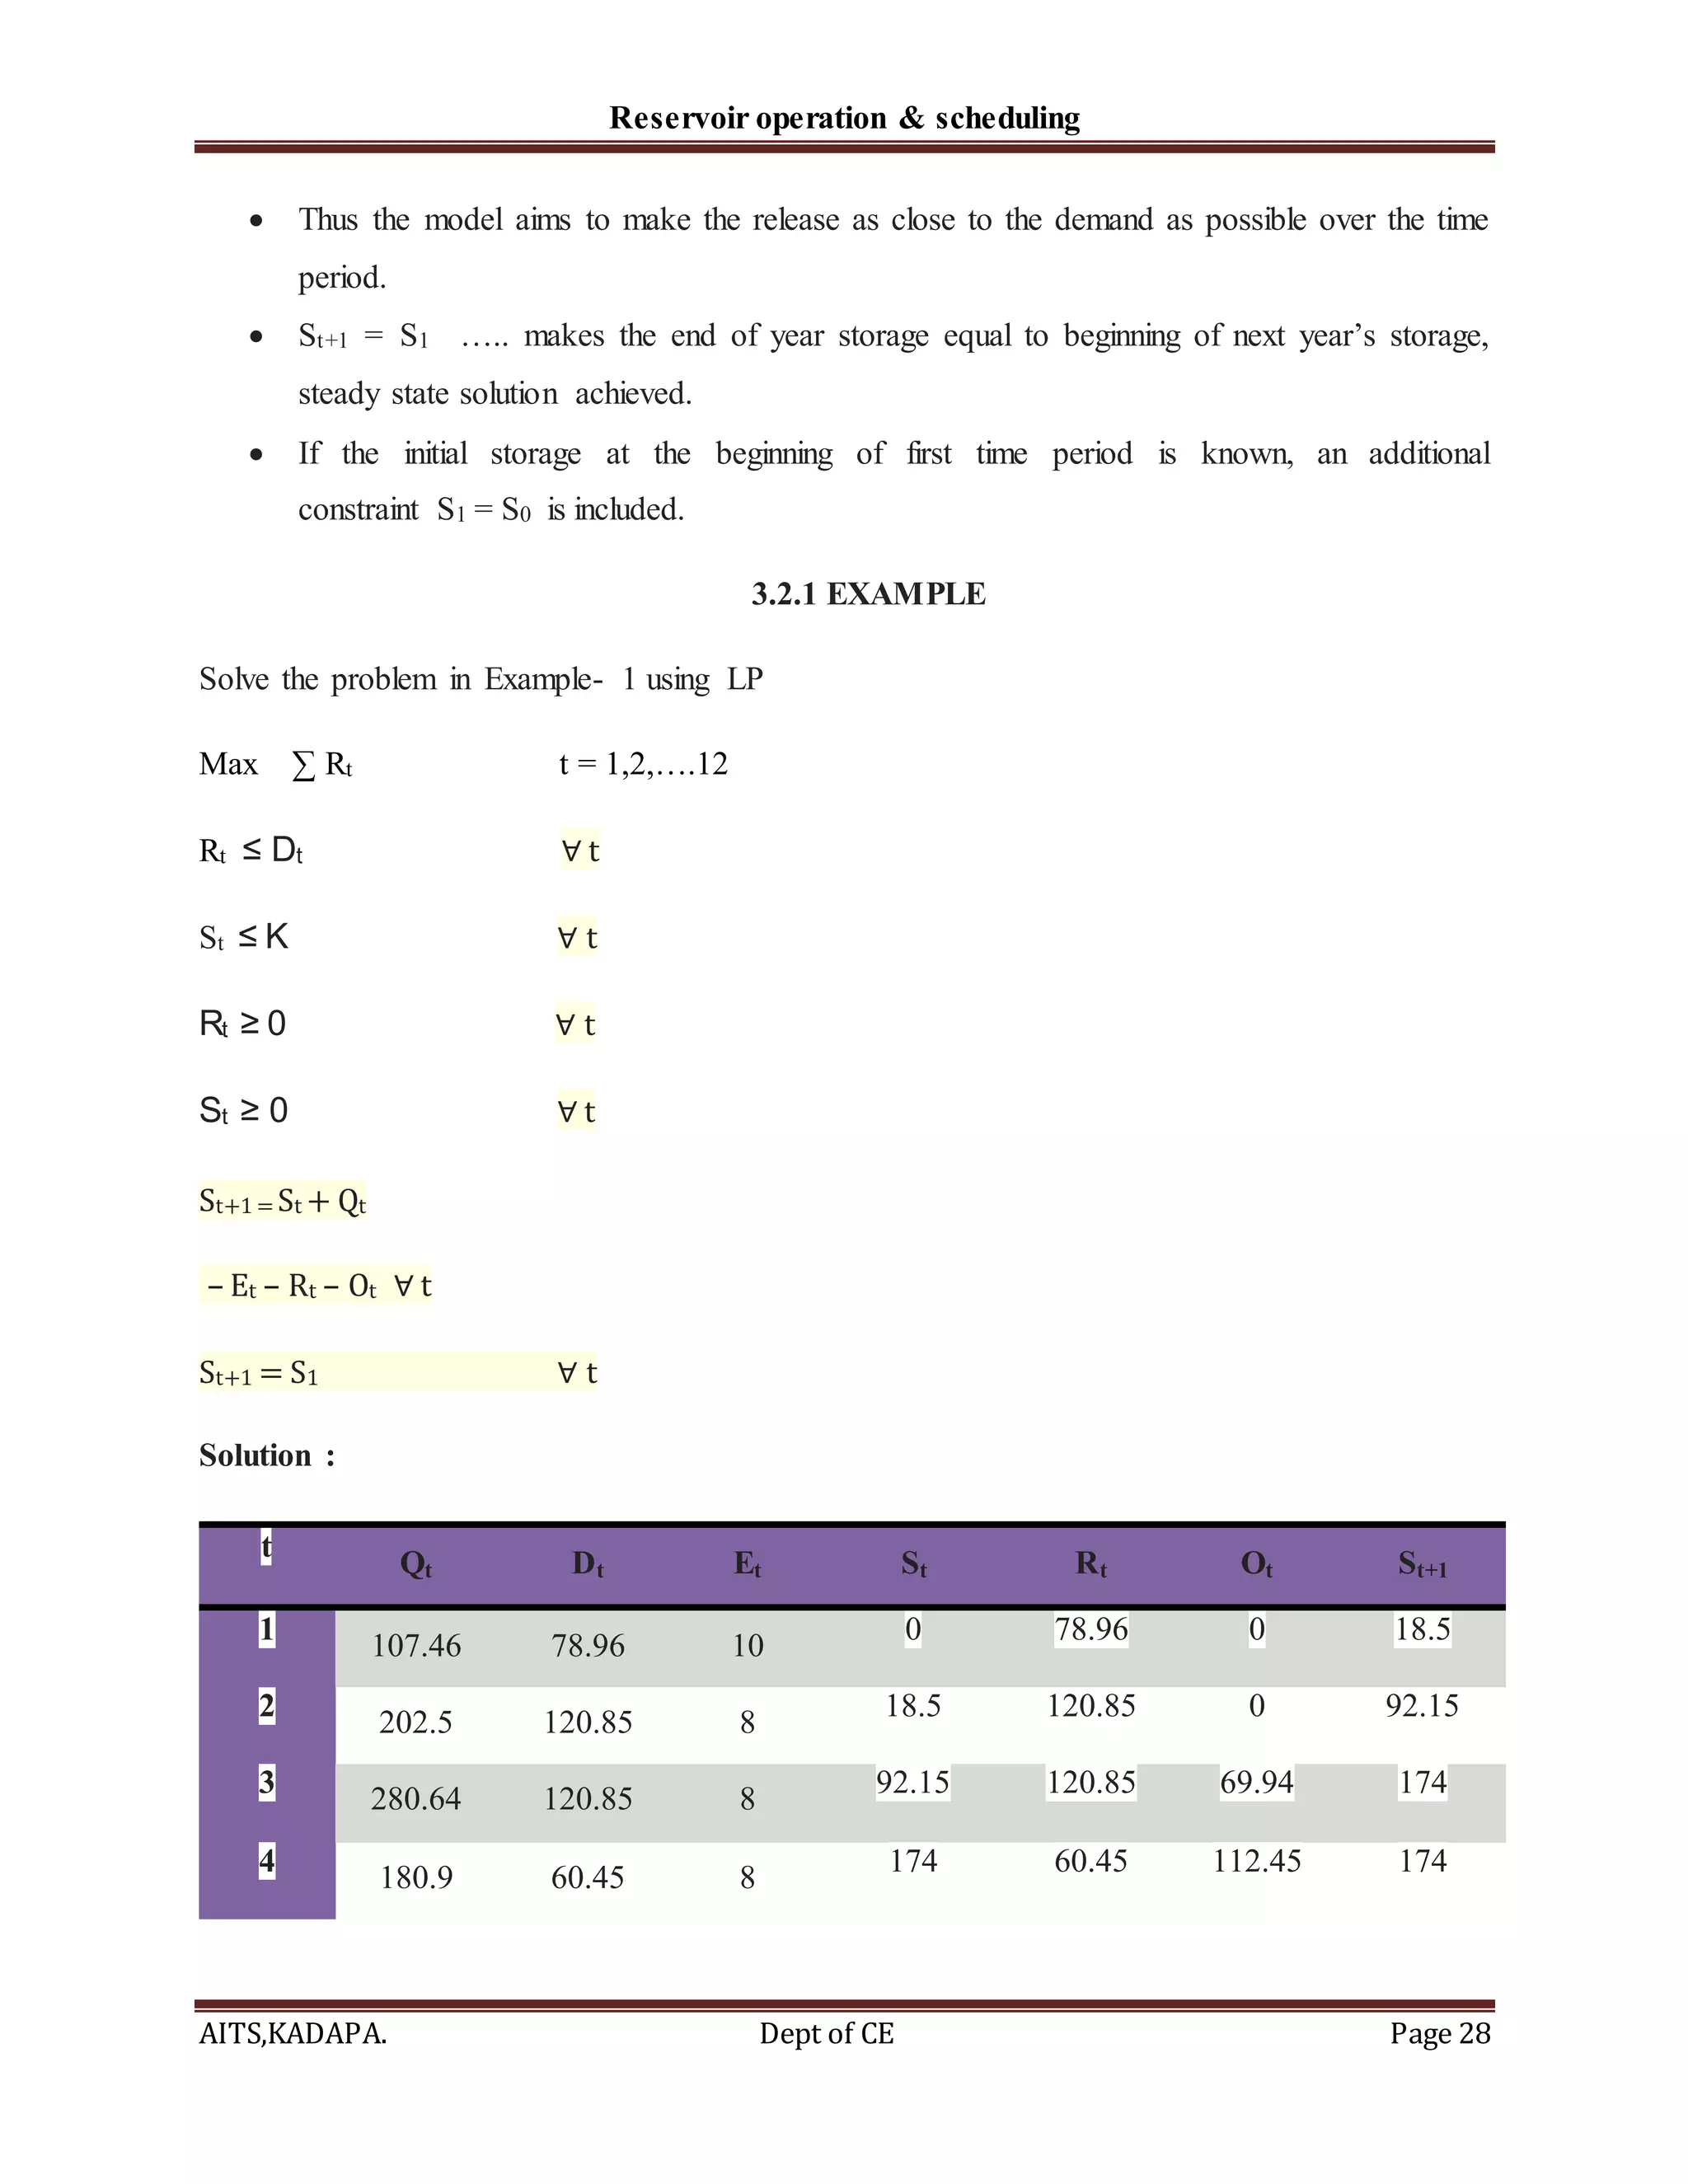
LP FORMULATION :
Max ∑3
𝑖=1 ∑ 𝑇
𝑡=1 [Bt
1Rt
1 + Bt
2 (Kt - St
i) + Bt
3St
i]
St+1
i = St
i + Qt
i – Et
i - Rt
i - Ot
i , ∀ t ,i=1,2
St+1
i = St
i + Qt
i + α1 Rt
1 + α 2Rt
2 – Et
i - Rt
i - Ot
i , ∀ t ,i=3
St
i ≤ Kt
i
, i=1,2,3; ∀ t
Kt - St
i ≥ Fmax
i , i= 1,2,3; ∀ t € Flood season
Rt
i ≤ Rmax
i ∀ t
Rt
i ≥ 0 ; St
i ≥ 0 ∀ t
St+1
i = St
i
Where
o i refers to reservoir (i =1,2,3)
o t is time period (t = 1,2,3,……,12)
o Q is inflow
o K is reservoir capacity
o S is storage
o R is release
o O is overflow or spill
o St is the storage at the beginning of the time period t.](https://image.slidesharecdn.com/12354565681-190216052454/75/1235456568-1-33-2048.jpg)


![Microsoft power point distribution systems [read-only]](https://cdn.slidesharecdn.com/ss_thumbnails/diwiuehtrycy7ayewpb3-signature-7f20760b9f97167ae74c1ef33fe58a16817ef3afaab94a37d2a9dfe6de74b684-poli-150822072504-lva1-app6892-thumbnail.jpg?width=640&height=640&fit=bounds)


