Download as PDF, PPTX


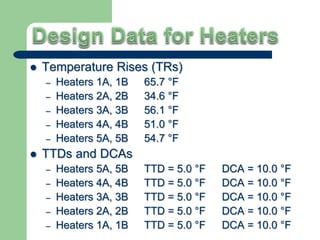
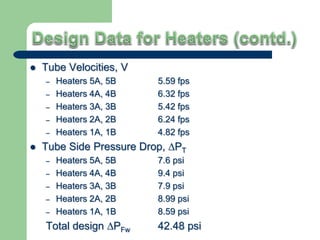


The document discusses the design and operation of feedwater heaters in nuclear power plants. It provides specifications for various heaters, including temperature rises, terminal temperature differences, drain cooler approaches, pressures, flows, and heat transfer rates. It then analyzes the impact on heater performance of factors like plugged tubes, tube leaks, removing a heater from service, and increasing thermal loads during plant uprates. Removal of a heater or presence of plugged tubes/leaks decreases heat transfer and increases pressures and temperatures in the affected heater string.


![Amardeep jadeja copy.ppt [autosaved]](https://cdn.slidesharecdn.com/ss_thumbnails/amardeepjadeja-copy-pptautosaved-111008011305-phpapp02-thumbnail.jpg?width=640&height=640&fit=bounds)


