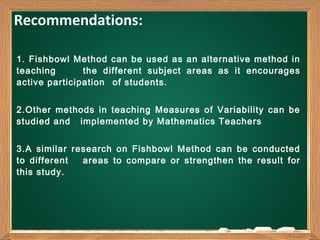
The Chalkboard
Presenter Name
By PresenterMedia.com
A COMPARATIVE STUDY ON
THE EFFECTS OF FISHBOWL
METHOD AND DISCUSSION
METHOD IN UNDERSTANDING
MEASURES
OF VARIABILITY
Bachelor of Secondary Education
Major in Mathematics
VANESSA JANE T. TABULA
CARINA Y. ANCHETA
ROSELYN T. UDANI
The Chalkboard
Presenter Name
By PresenterMedia.com
To introduce new Method in teaching
Measures of Variability
To improve the understanding of the
students on Measures of Variability
To compare Discussion Method and
Fishbowl Method
Background
Statement of the Problem
 What is the level of understanding of
Grade VIII – Jade students in the measures
of variability before and after their
exposure to Discussion and Fishbowl
Methods?
 Is there a significant difference between
the pretest and posttest mean scores of
the students exposed to:
Discussion Method and
Fishbowl Method?
 Is there a significant difference between
the students’ understanding of Measures
of Variability after the use of the
Discussion and Fishbowl Methods?
Theoretical Framework
 Kong(2002) found Fishbowl Method to be
an effective strategy to foster student
engagement in book discussions.
 On the study of Maier,(1993)entitled
‘’Problem solving discussion on angle
sums and distances’’,she stated that
Discussion Method is also effective in
problem solving.
 Konchar(1985) identifies two major types
of Discussions which are foemL and
informal.
Conceptual framework
METHODOLOGY
Research Design
METHODOLOGY
Research Instrument
A 25-item teacher rate research instrument validated by experts was used
Summary of the Result on the Effects of Discussion
Method in Teaching Measures of Variability
Performance
Level
Pretest Posttest
No. of students 18 18
Lowest score 0 8
Highest score 2 24
Mean Score
(DR)
1.17 (NI)
 
19.5 (VS)
 
Standard
Deviation
0.51 4.55
Gain Ratio 135%
Results and Discussion
Summary of the Result on the Effects of Discussion
Method in Teaching Measures of Variability
Performance
Level
Pretest Posttest
No. of students 18 18
Lowest score 0 8
Highest score 2 24
Mean Score
(DR)
1.17 (NI)
 
19.5 (VS)
 
Standard
Deviation
0.51 4.55
Gain Ratio 135%
Summary of computation of Students’ Scores before and
after Fishbowl and Discussion Method
STATISTICS
Fishbowl Method Discussion Method
Pretest Posttest Pretest Posttest
d 19.83 16.49
Sd 5.10 4.39
Df 17 17
Computed t 16.49 15.94
Tabulated t 2.101
Decision Reject Ho Reject Ho
Statistics Fishbowl Method Discussion Method
No. of Students 18 18
Posttest scores 20.94 17.66
Standard
Deviation
4.82 4.55
df 34
Computed t-value 2.10
Tabular t- value 2.028
Decision Reject Ho
Comparative Effects of Fishbowl Method and
The Discussion Method
Results and Discussion
 The computed t-test value for the Discussion Method
Group is 15.94, which is greater than the is rejected.
This shows that the Discutabular value of 2.101.
Therefore the null hypothesis ssion Method is
effective in teaching the different Measures of
Variability.
 The computed mean score in the posttest of
Fishbowl Method group is 20.94 and greater than the
computed mean score during the pretest which is
1.11. This also shows that the students performed
better in the posttest through Fishbowl Method.
Results and Discussion
 The computed t-test value for the Discussion Method
Group is 16.49, which is greater than the tabular
value of 2.101. Therefore the null hypothesis is
rejected. This shows that the Discussion Method is
effective in teaching the different Measures of
Variability

The computed t-test value for the post test scores of
the two groups’ is 2.10 which is greater than the
tabular value of 2.028. Therefore the null hypothesis
is rejected. This means that the Fishbowl Method is
more effective than the Discussion Method.
1. The significant difference between the mean scores of
both groups in the pre test and the post test indicates an
improvement in the mathematical performance of Grade 8
Jade students on Measure of Variability.
2. Discussion Method is an effective strategy in improving
the understanding of students in the Topic Measures of
Variability.
3. Fishbowl Method is more effective than the Discussion
Method in improving the understanding of students on
Measures of Variability.
Conclusions
1. Fishbowl Method can be used as an alternative method in
teaching the different subject areas as it encourages
active participation of students.
2.Other methods in teaching Measures of Variability can be
studied and implemented by Mathematics Teachers
3.A similar research on Fishbowl Method can be conducted
to different areas to compare or strengthen the result for
this study.
Recommendations:
Unpublished Materials
•Ragual, Ciriaco T. 1999.Effectivesness of Peer Teaching on the Performance in
Plane Trigonometry of Mariano Marcos State University College Students.
(Unpublished Masteral Thesis, UNP, Vigan City)
•Kong, A. (2002, April). Scaffolding in a learning community ofpmctice: l. case
study of a gradual release of responsibility from the teacher to the students.
Paper presented at the Annual Meeting of the International Reading
Association, San Francisco.
Online References
•Maier, N.R.F. (1993) “Problem Solving discussion on Angles Sum and
Distances” retrieved on September 12, 2013 from http:www.jstor.org?
distances?ancgles?1002120
•Karen D, Wood (2007) “Fostering engaging and Active Discussion in Middle
School Clasrooms”. Retrieved on February 21, 2014 from
http://www.fosteringengaging(BT).pdf
REFERENCES

Research pre

  • 1.
    The Chalkboard Presenter Name ByPresenterMedia.com A COMPARATIVE STUDY ON THE EFFECTS OF FISHBOWL METHOD AND DISCUSSION METHOD IN UNDERSTANDING MEASURES OF VARIABILITY Bachelor of Secondary Education Major in Mathematics VANESSA JANE T. TABULA CARINA Y. ANCHETA ROSELYN T. UDANI
  • 2.
    The Chalkboard Presenter Name ByPresenterMedia.com To introduce new Method in teaching Measures of Variability To improve the understanding of the students on Measures of Variability To compare Discussion Method and Fishbowl Method Background
  • 3.
    Statement of theProblem  What is the level of understanding of Grade VIII – Jade students in the measures of variability before and after their exposure to Discussion and Fishbowl Methods?  Is there a significant difference between the pretest and posttest mean scores of the students exposed to: Discussion Method and Fishbowl Method?  Is there a significant difference between the students’ understanding of Measures of Variability after the use of the Discussion and Fishbowl Methods?
  • 4.
    Theoretical Framework  Kong(2002)found Fishbowl Method to be an effective strategy to foster student engagement in book discussions.  On the study of Maier,(1993)entitled ‘’Problem solving discussion on angle sums and distances’’,she stated that Discussion Method is also effective in problem solving.  Konchar(1985) identifies two major types of Discussions which are foemL and informal.
  • 5.
  • 6.
  • 7.
    METHODOLOGY Research Instrument A 25-itemteacher rate research instrument validated by experts was used
  • 8.
    Summary of theResult on the Effects of Discussion Method in Teaching Measures of Variability Performance Level Pretest Posttest No. of students 18 18 Lowest score 0 8 Highest score 2 24 Mean Score (DR) 1.17 (NI)   19.5 (VS)   Standard Deviation 0.51 4.55 Gain Ratio 135% Results and Discussion
  • 9.
    Summary of theResult on the Effects of Discussion Method in Teaching Measures of Variability Performance Level Pretest Posttest No. of students 18 18 Lowest score 0 8 Highest score 2 24 Mean Score (DR) 1.17 (NI)   19.5 (VS)   Standard Deviation 0.51 4.55 Gain Ratio 135%
  • 10.
    Summary of computationof Students’ Scores before and after Fishbowl and Discussion Method STATISTICS Fishbowl Method Discussion Method Pretest Posttest Pretest Posttest d 19.83 16.49 Sd 5.10 4.39 Df 17 17 Computed t 16.49 15.94 Tabulated t 2.101 Decision Reject Ho Reject Ho
  • 11.
    Statistics Fishbowl MethodDiscussion Method No. of Students 18 18 Posttest scores 20.94 17.66 Standard Deviation 4.82 4.55 df 34 Computed t-value 2.10 Tabular t- value 2.028 Decision Reject Ho Comparative Effects of Fishbowl Method and The Discussion Method Results and Discussion
  • 12.
    Results and Discussion The computed t-test value for the Discussion Method Group is 15.94, which is greater than the is rejected. This shows that the Discutabular value of 2.101. Therefore the null hypothesis ssion Method is effective in teaching the different Measures of Variability.  The computed mean score in the posttest of Fishbowl Method group is 20.94 and greater than the computed mean score during the pretest which is 1.11. This also shows that the students performed better in the posttest through Fishbowl Method.
  • 13.
    Results and Discussion The computed t-test value for the Discussion Method Group is 16.49, which is greater than the tabular value of 2.101. Therefore the null hypothesis is rejected. This shows that the Discussion Method is effective in teaching the different Measures of Variability  The computed t-test value for the post test scores of the two groups’ is 2.10 which is greater than the tabular value of 2.028. Therefore the null hypothesis is rejected. This means that the Fishbowl Method is more effective than the Discussion Method.
  • 14.
    Results and Discussion The computed t-test value for the Discussion Method Group is 16.49, which is greater than the tabular value of 2.101. Therefore the null hypothesis is rejected. This shows that the Discussion Method is effective in teaching the different Measures of Variability  The computed t-test value for the post test scores of the two groups’ is 2.10 which is greater than the tabular value of 2.028. Therefore the null hypothesis is rejected. This means that the Fishbowl Method is more effective than the Discussion Method.
  • 15.
    1. The significantdifference between the mean scores of both groups in the pre test and the post test indicates an improvement in the mathematical performance of Grade 8 Jade students on Measure of Variability. 2. Discussion Method is an effective strategy in improving the understanding of students in the Topic Measures of Variability. 3. Fishbowl Method is more effective than the Discussion Method in improving the understanding of students on Measures of Variability. Conclusions
  • 16.
    1. Fishbowl Methodcan be used as an alternative method in teaching the different subject areas as it encourages active participation of students. 2.Other methods in teaching Measures of Variability can be studied and implemented by Mathematics Teachers 3.A similar research on Fishbowl Method can be conducted to different areas to compare or strengthen the result for this study. Recommendations:
  • 17.
    Unpublished Materials •Ragual, CiriacoT. 1999.Effectivesness of Peer Teaching on the Performance in Plane Trigonometry of Mariano Marcos State University College Students. (Unpublished Masteral Thesis, UNP, Vigan City) •Kong, A. (2002, April). Scaffolding in a learning community ofpmctice: l. case study of a gradual release of responsibility from the teacher to the students. Paper presented at the Annual Meeting of the International Reading Association, San Francisco. Online References •Maier, N.R.F. (1993) “Problem Solving discussion on Angles Sum and Distances” retrieved on September 12, 2013 from http:www.jstor.org? distances?ancgles?1002120 •Karen D, Wood (2007) “Fostering engaging and Active Discussion in Middle School Clasrooms”. Retrieved on February 21, 2014 from http://www.fosteringengaging(BT).pdf REFERENCES