The document discusses various research methodologies and concepts including:
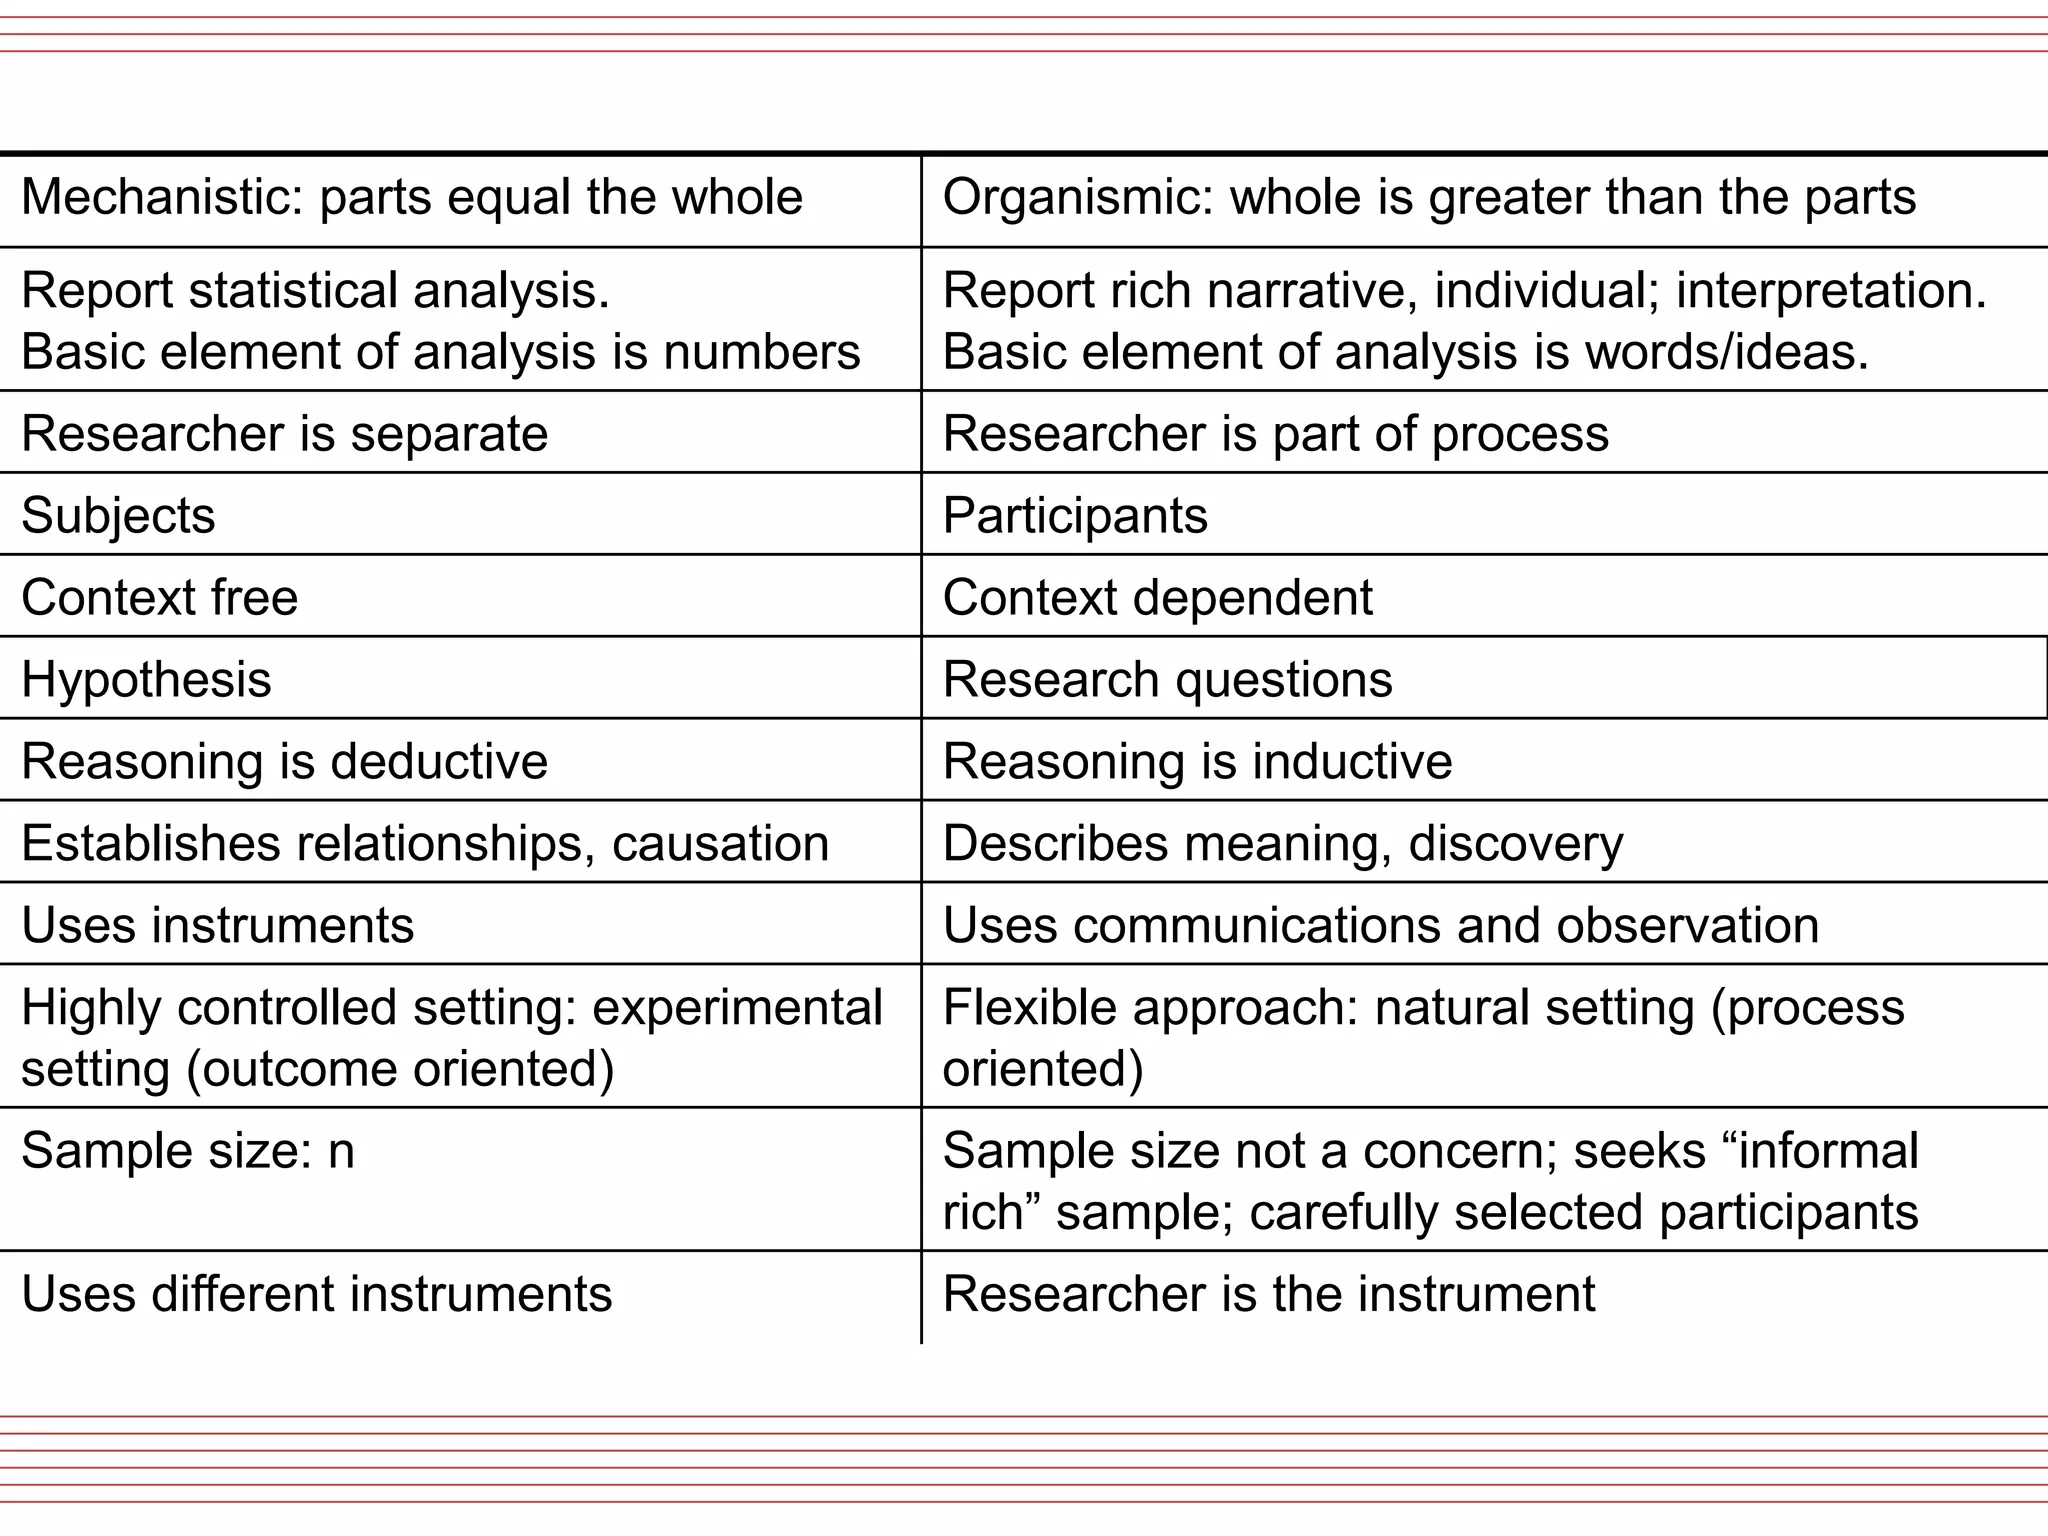
1. It outlines different types of research classifications including exploratory, descriptive, causal/hypothesis testing research and qualitative vs. quantitative approaches.
2. It also discusses different sampling designs such as probability sampling methods like simple random sampling, systematic sampling, stratified random sampling, and cluster sampling as well as non-probability sampling.
3. The key aspects of developing a sampling design are identified as defining the target population, sampling frame, developing the sample, and ensuring the sample is representative of the population.