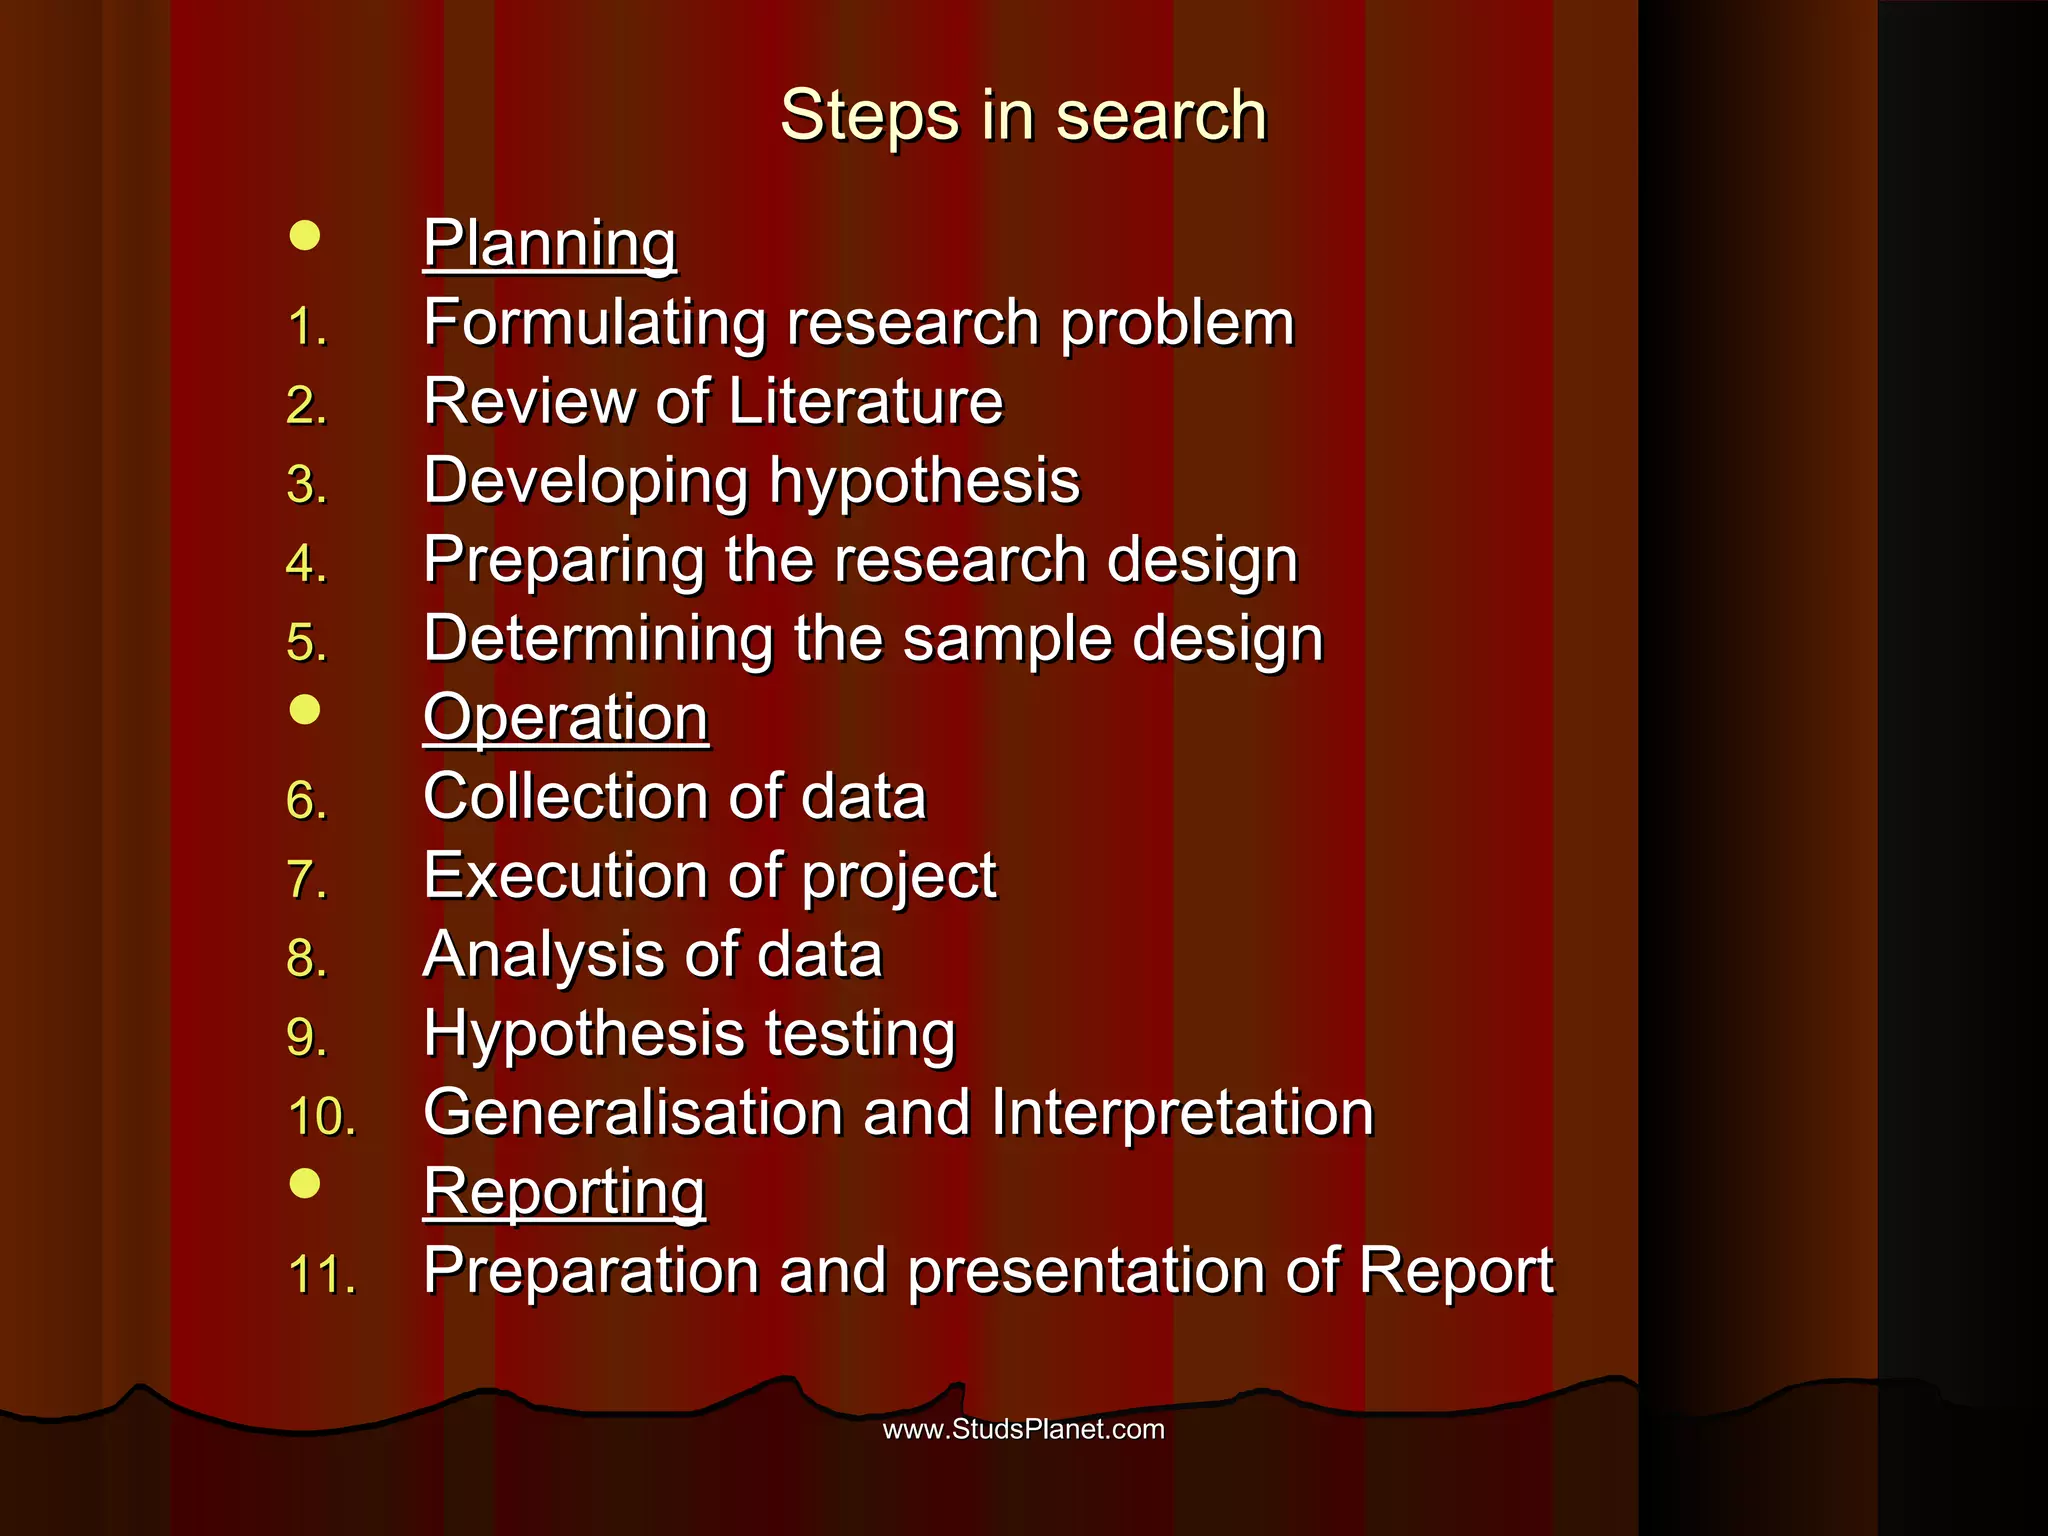
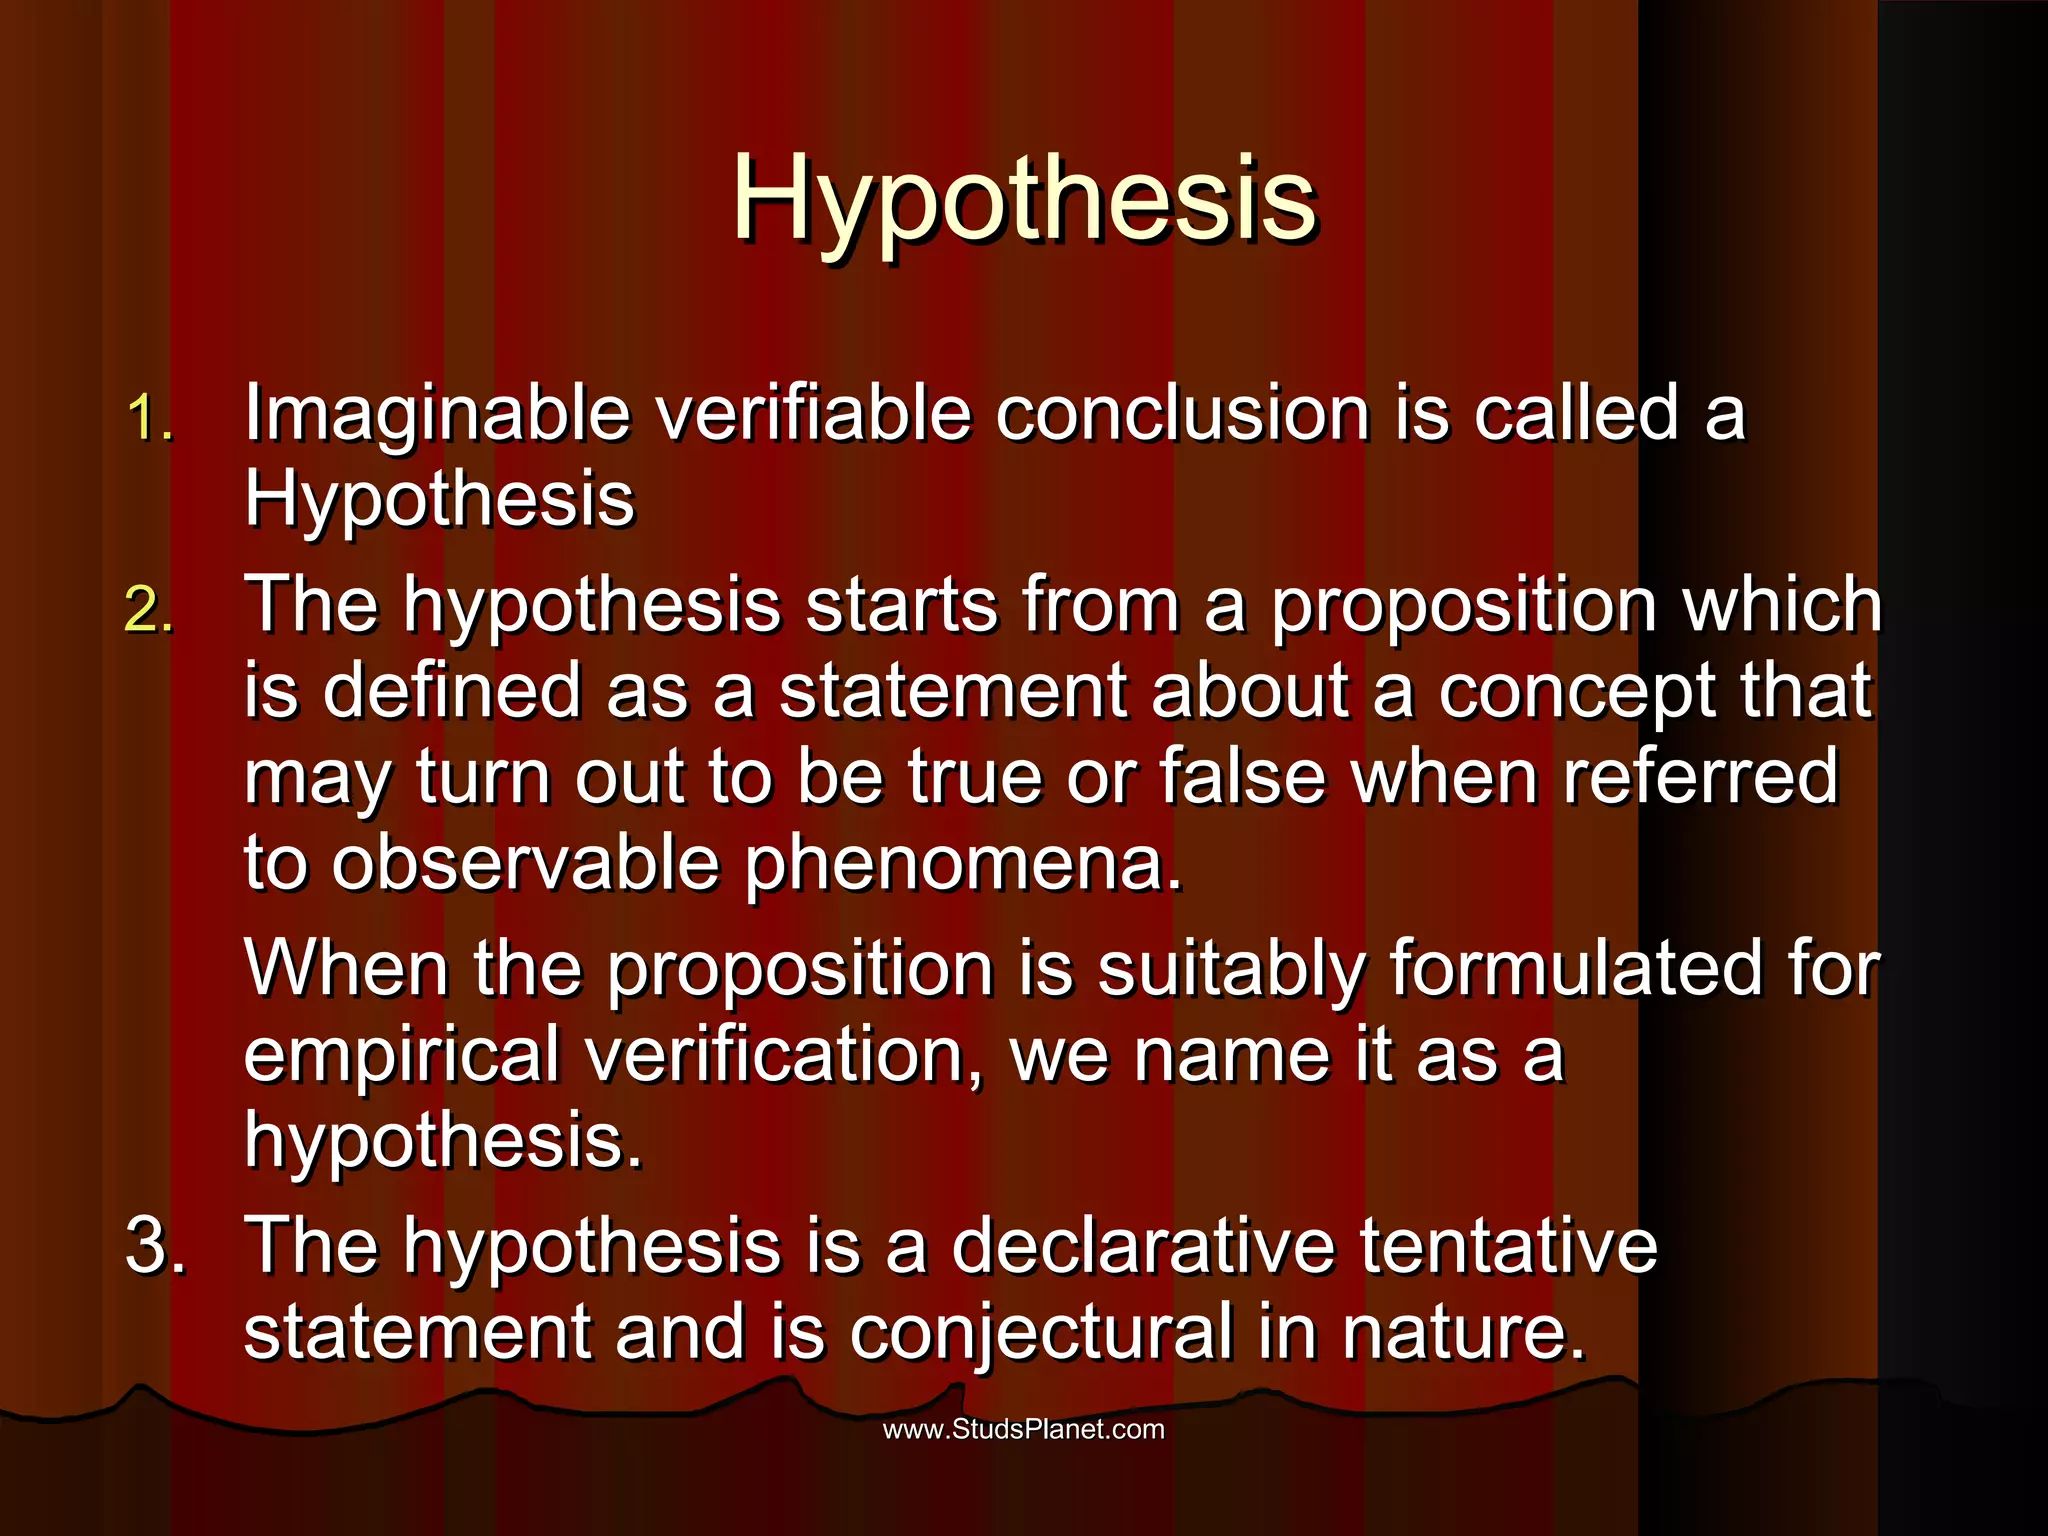
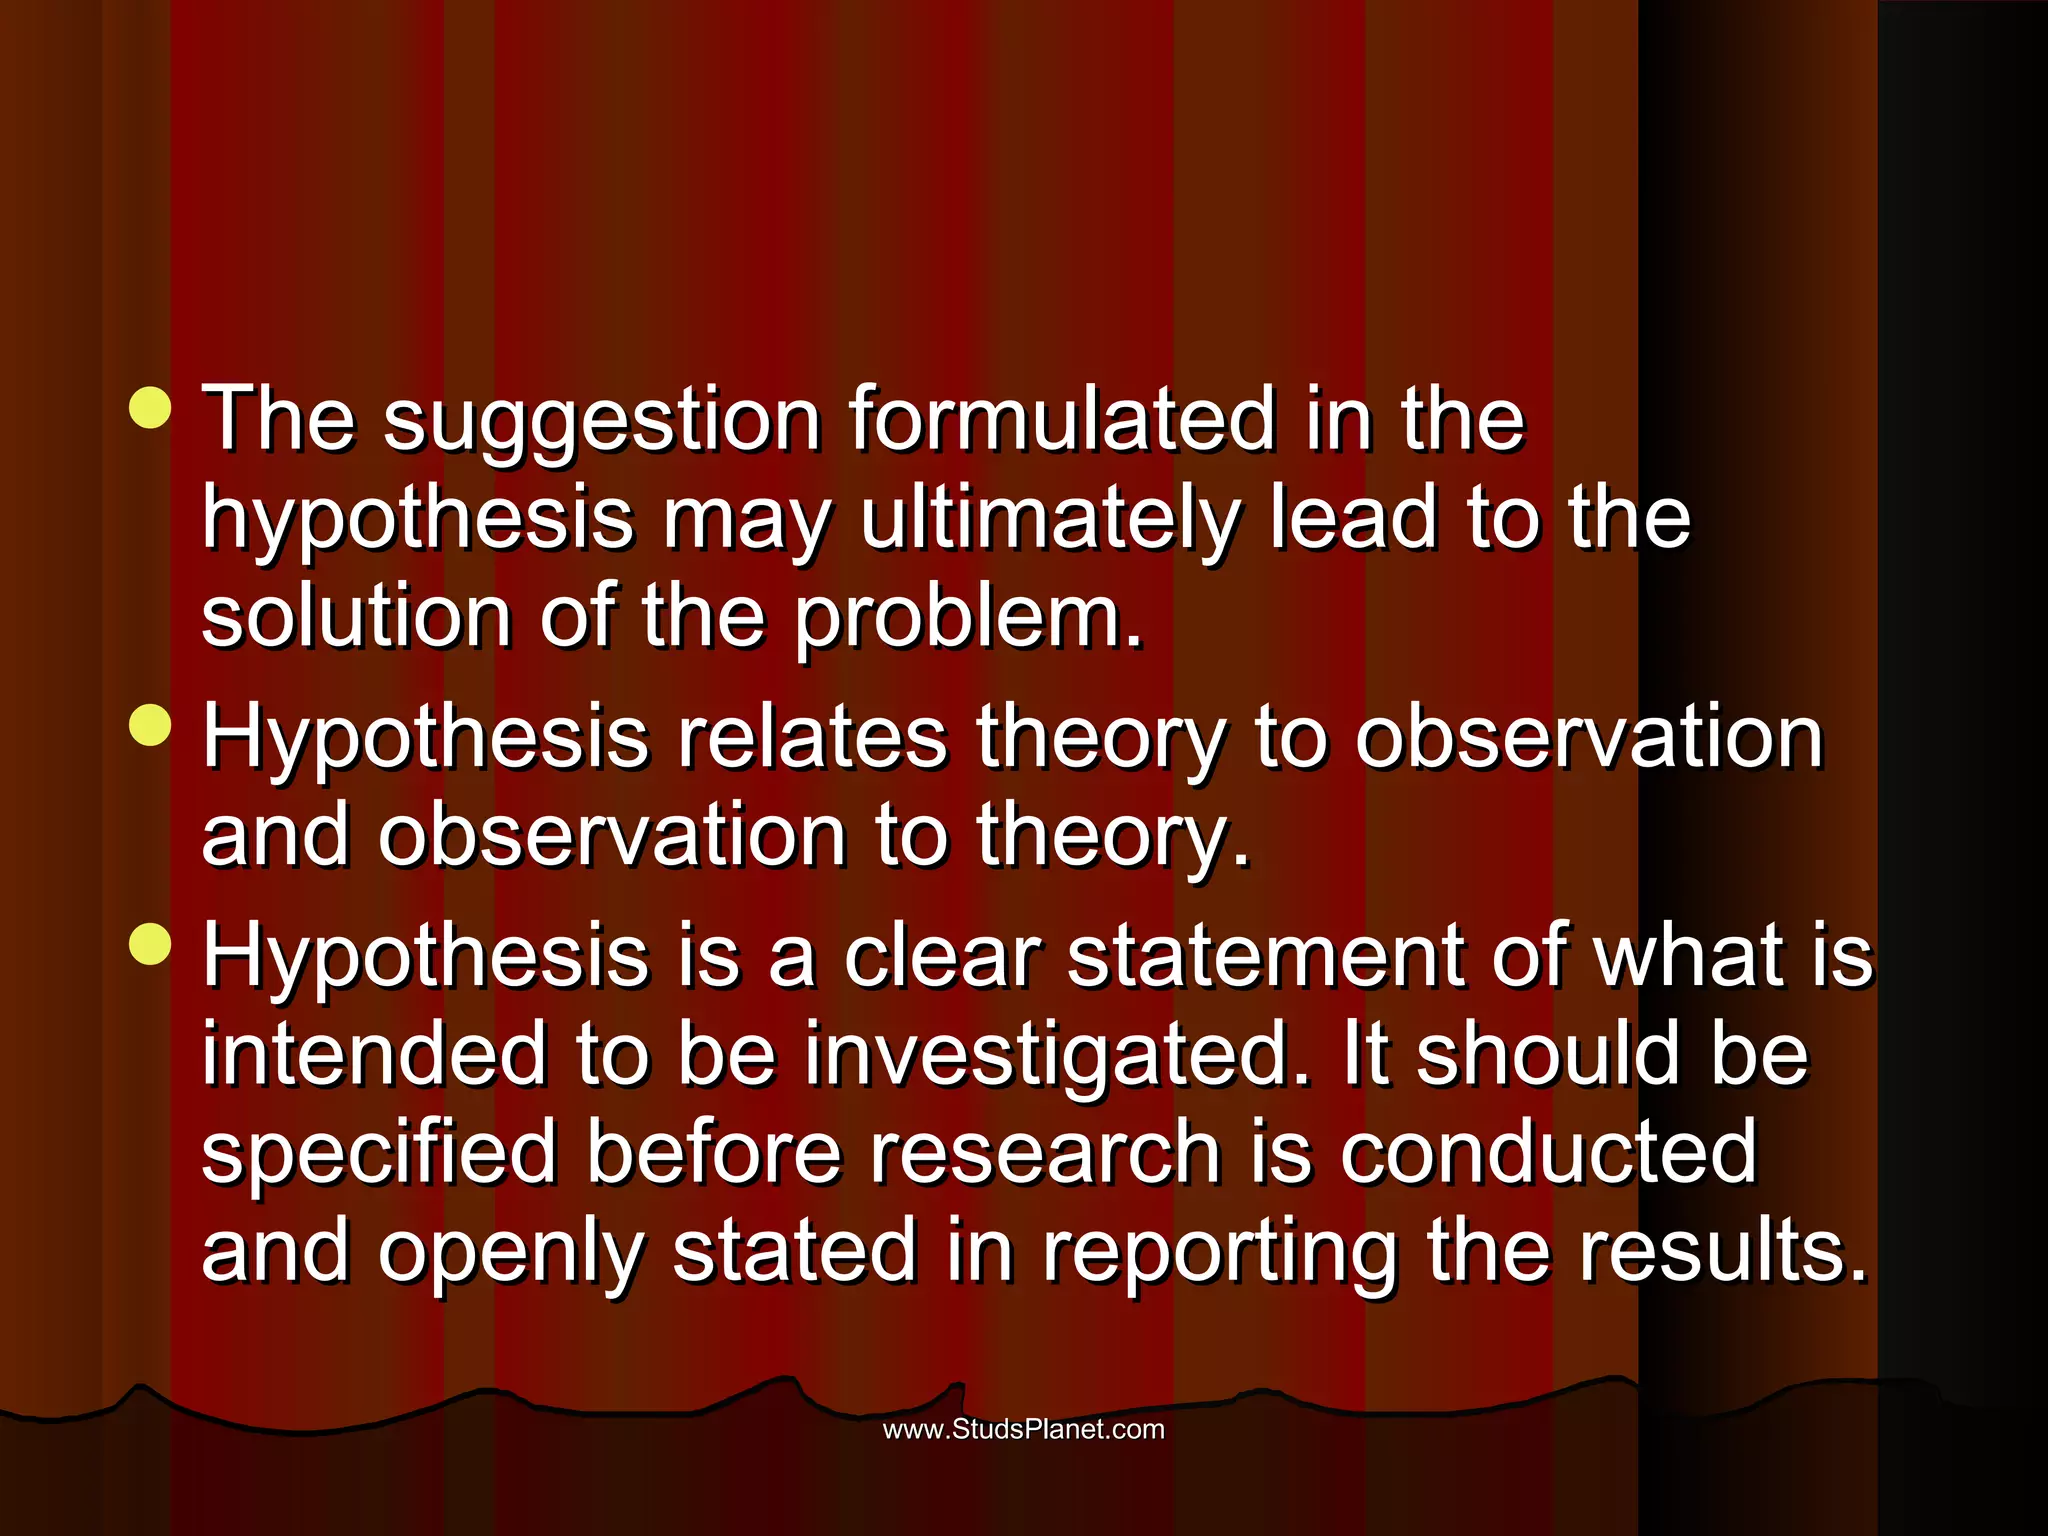
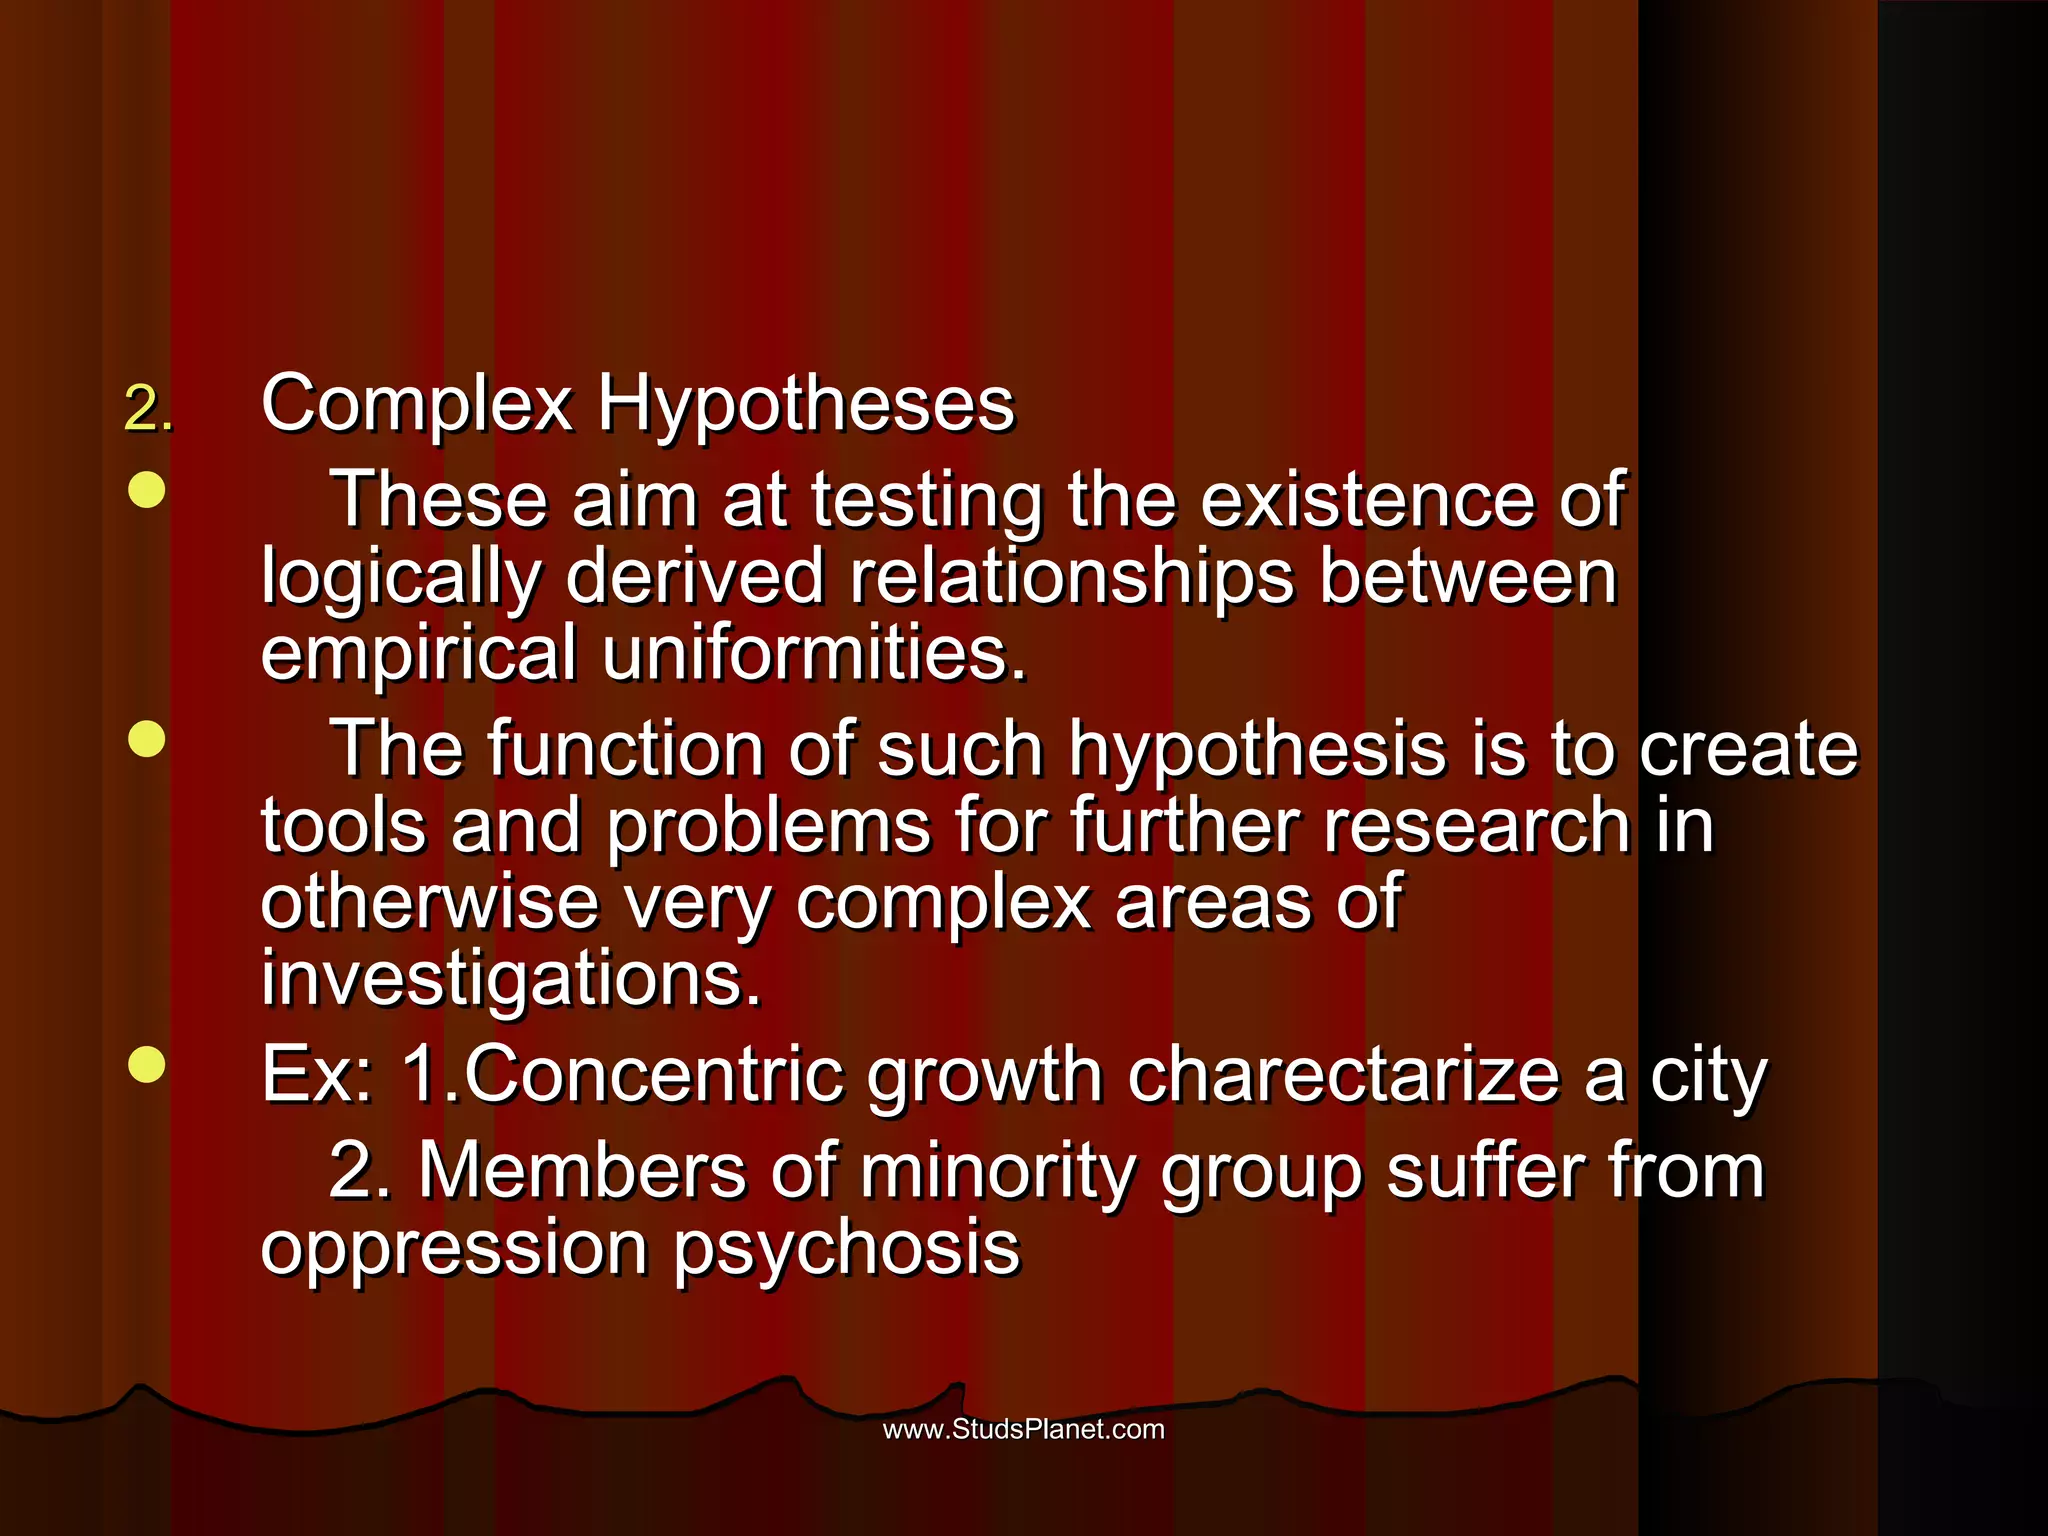
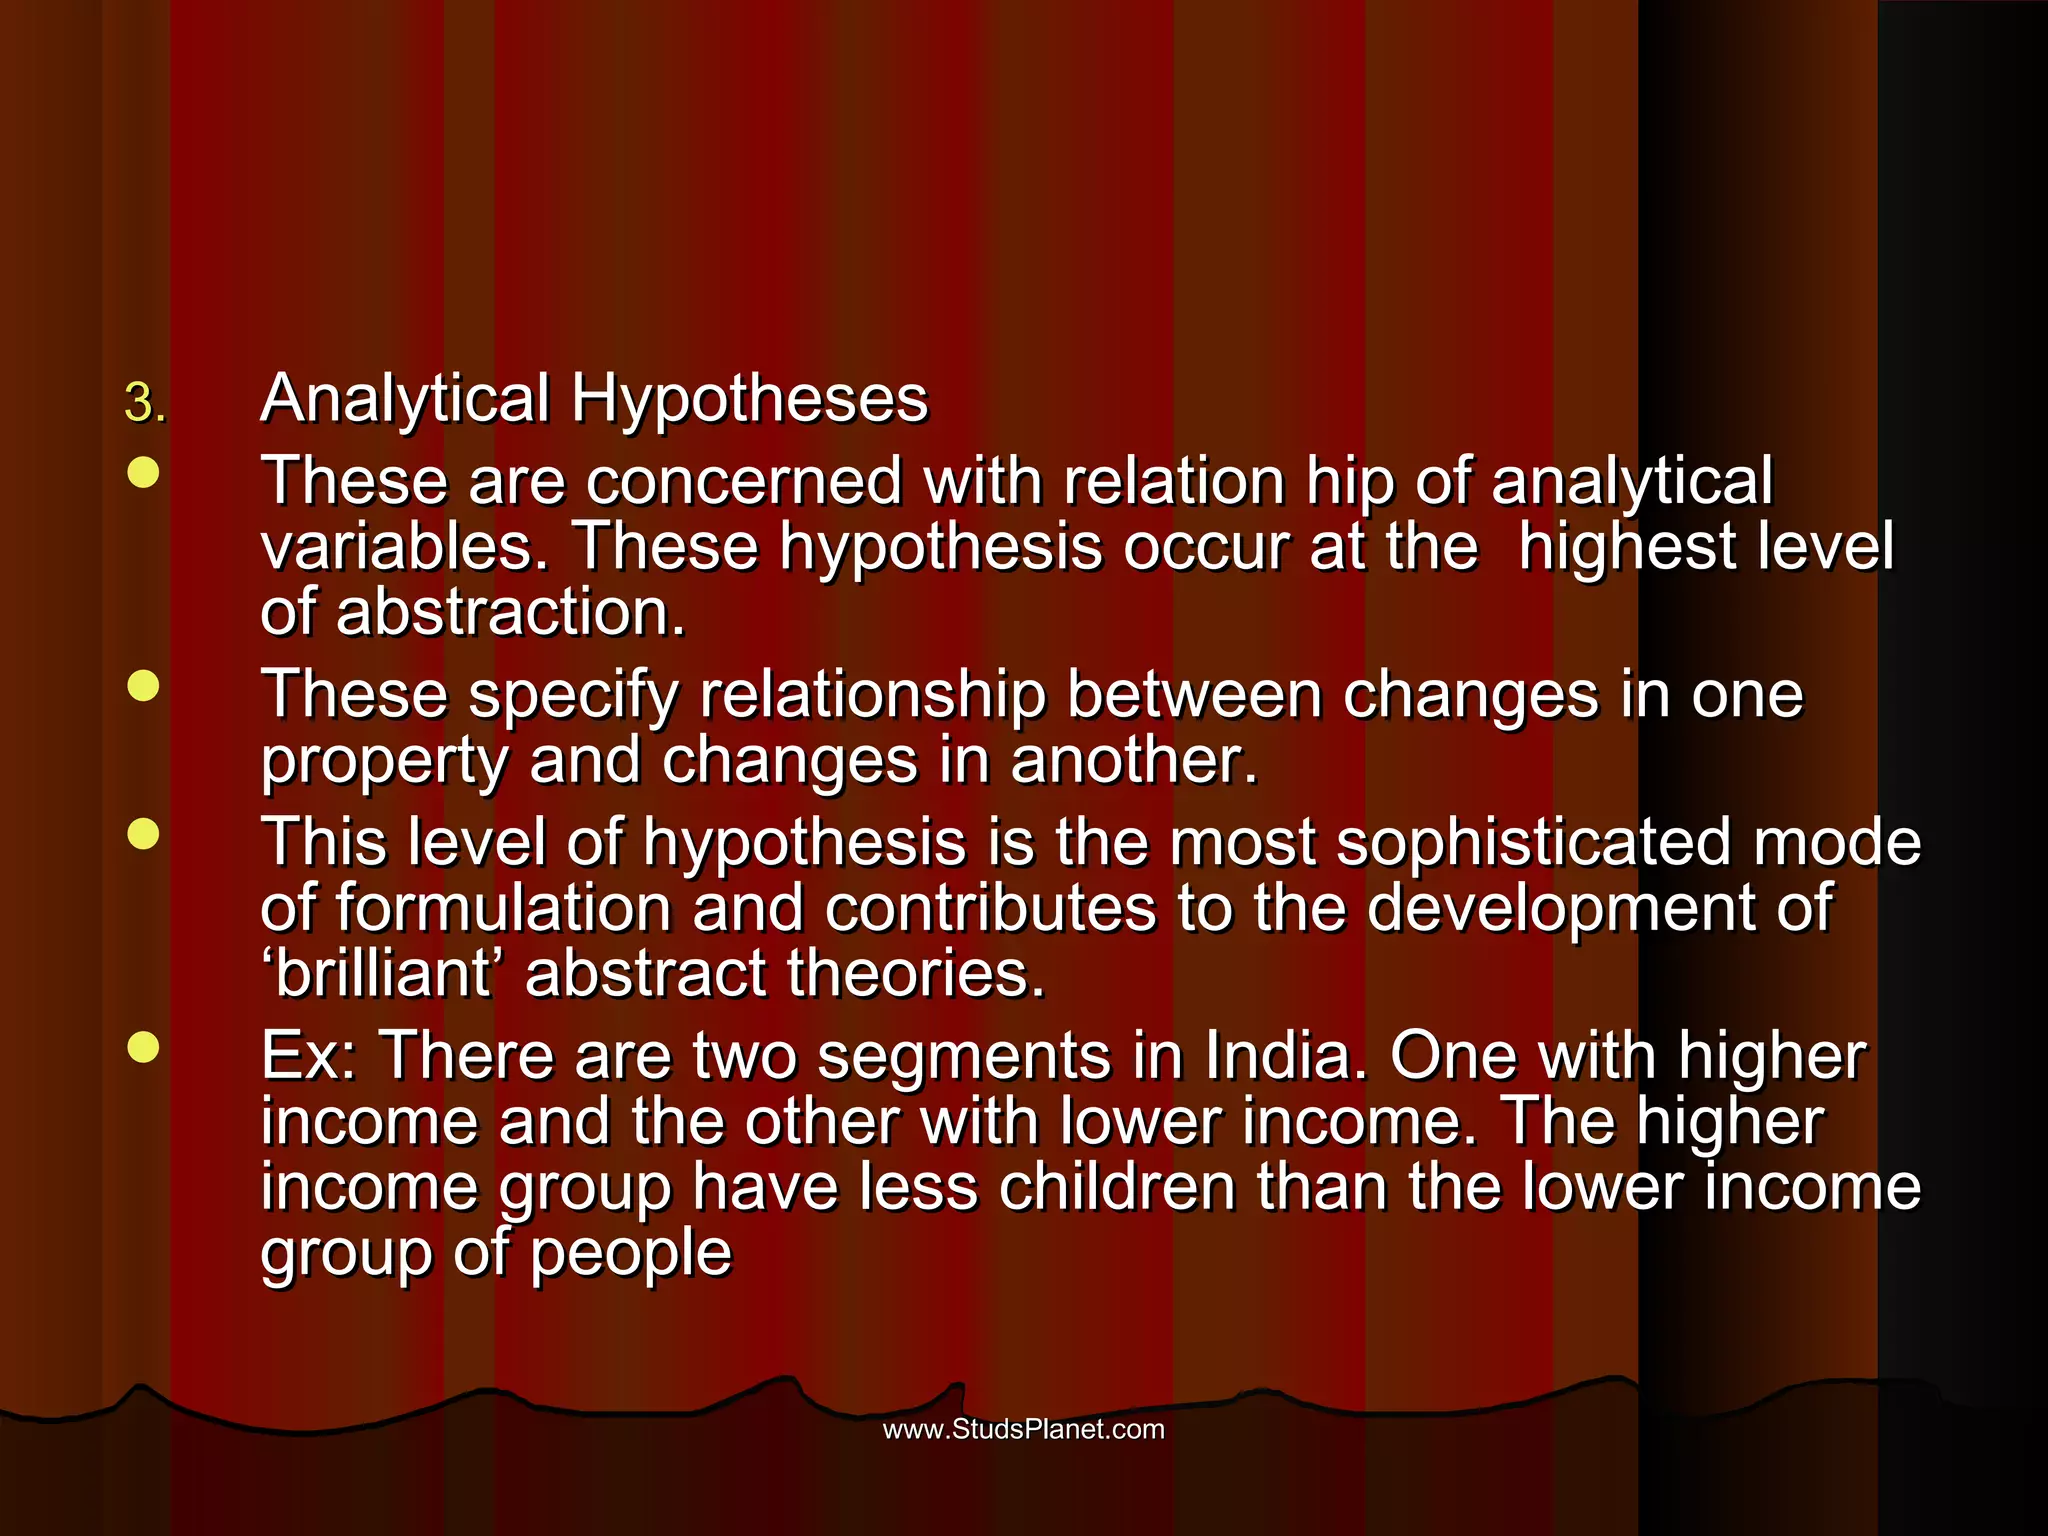
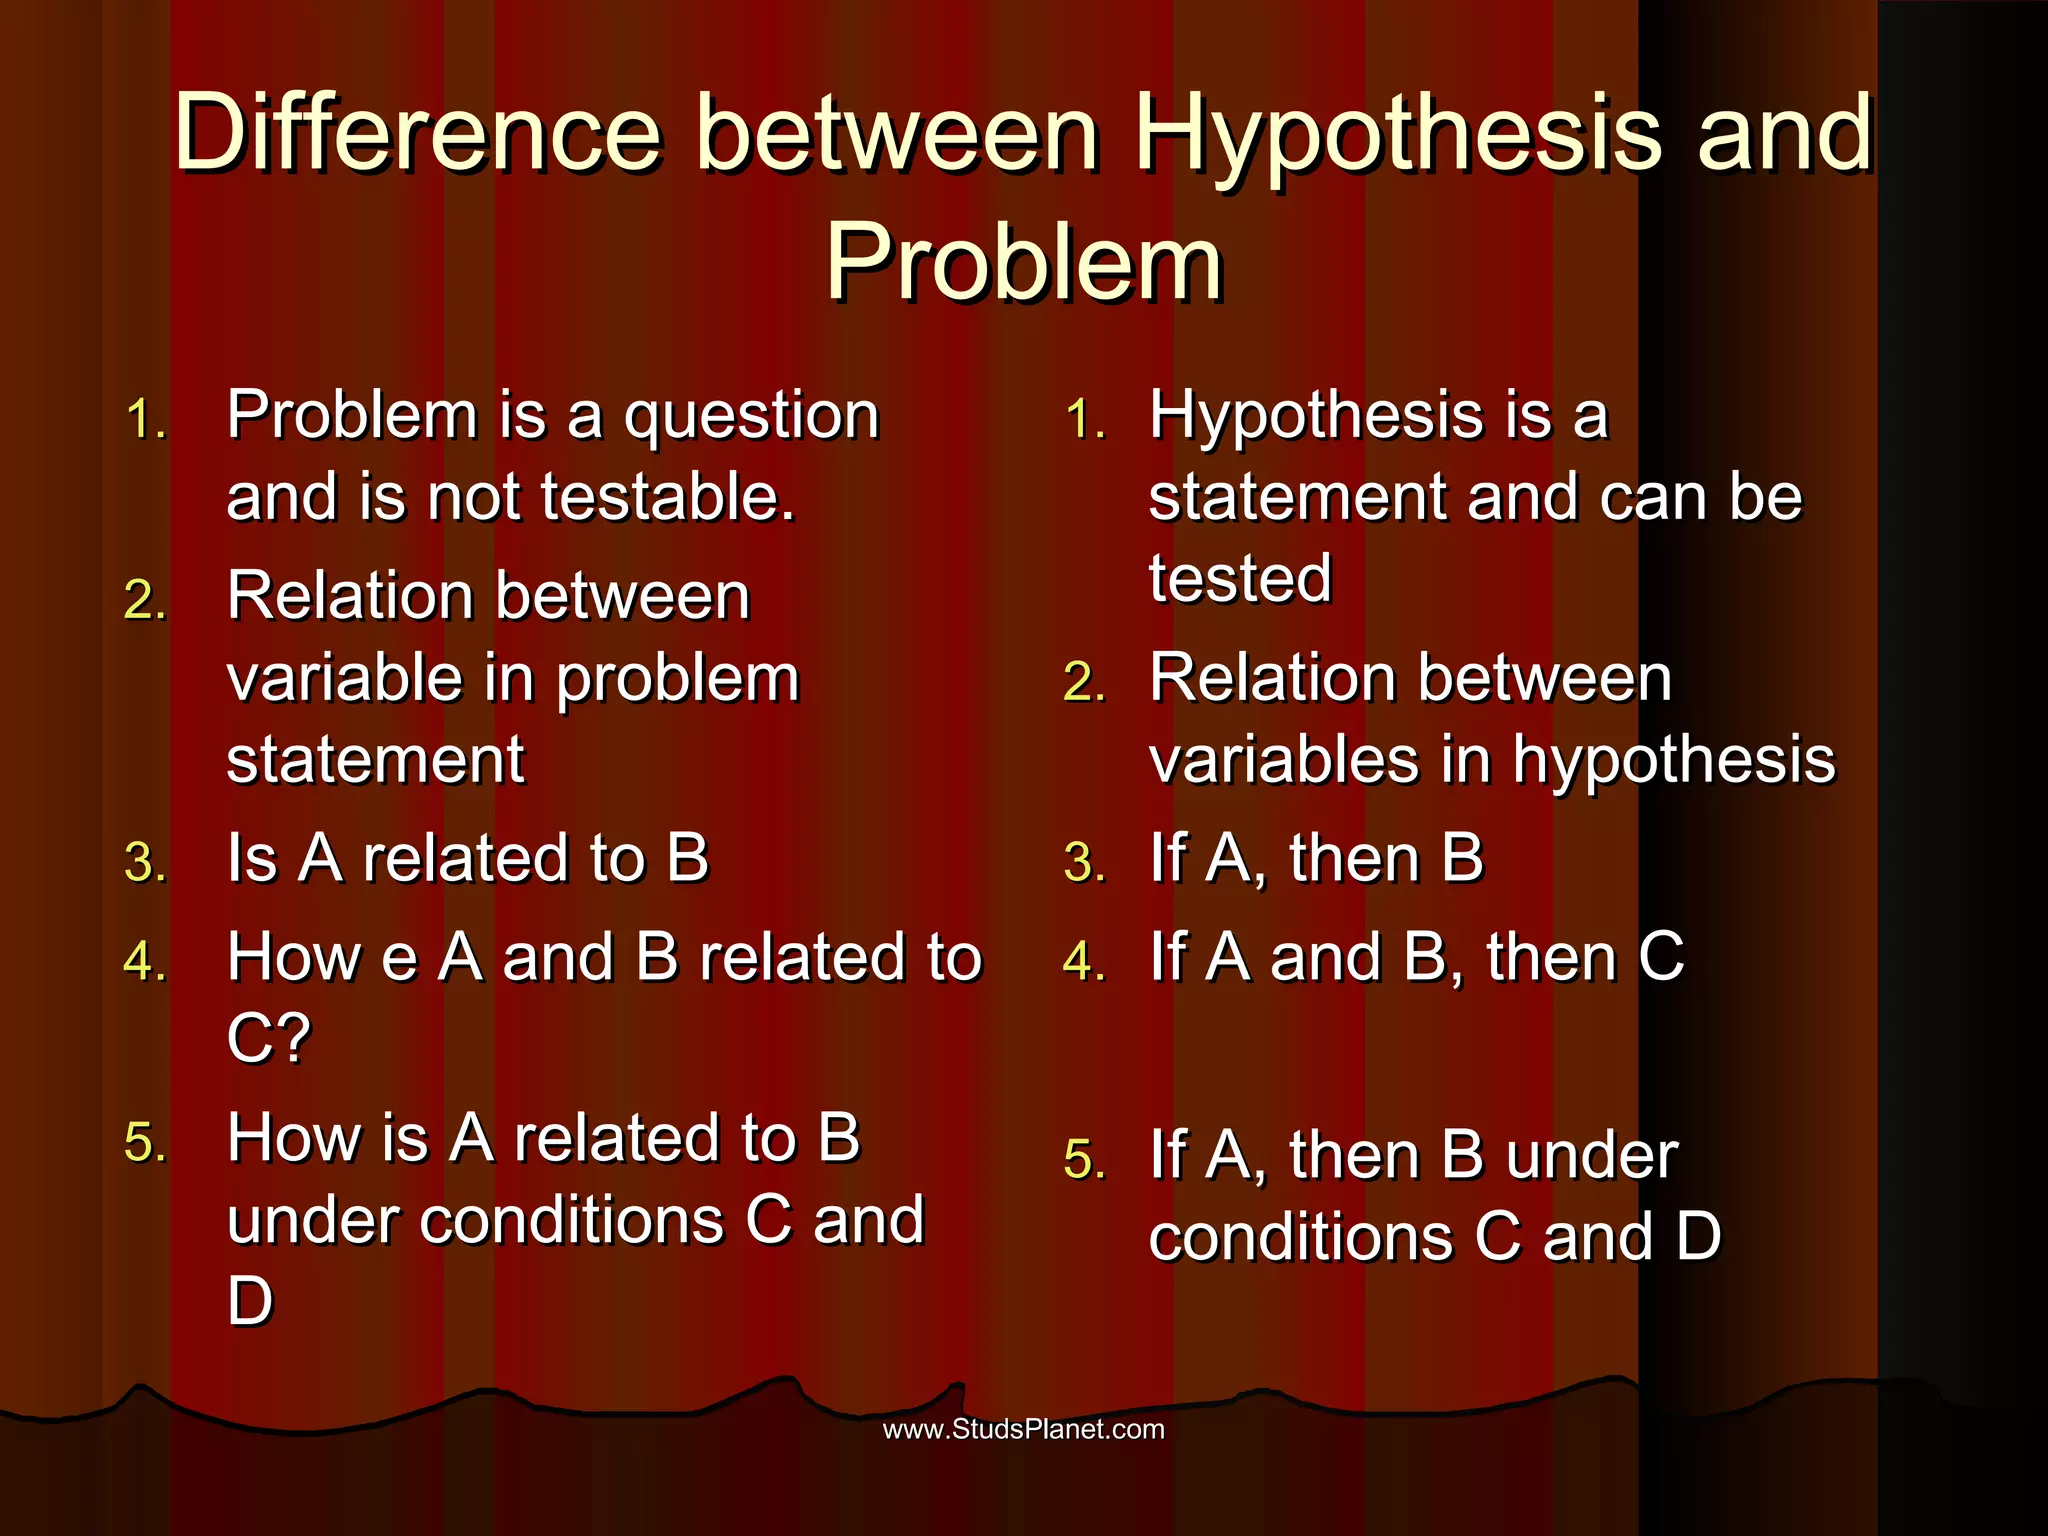
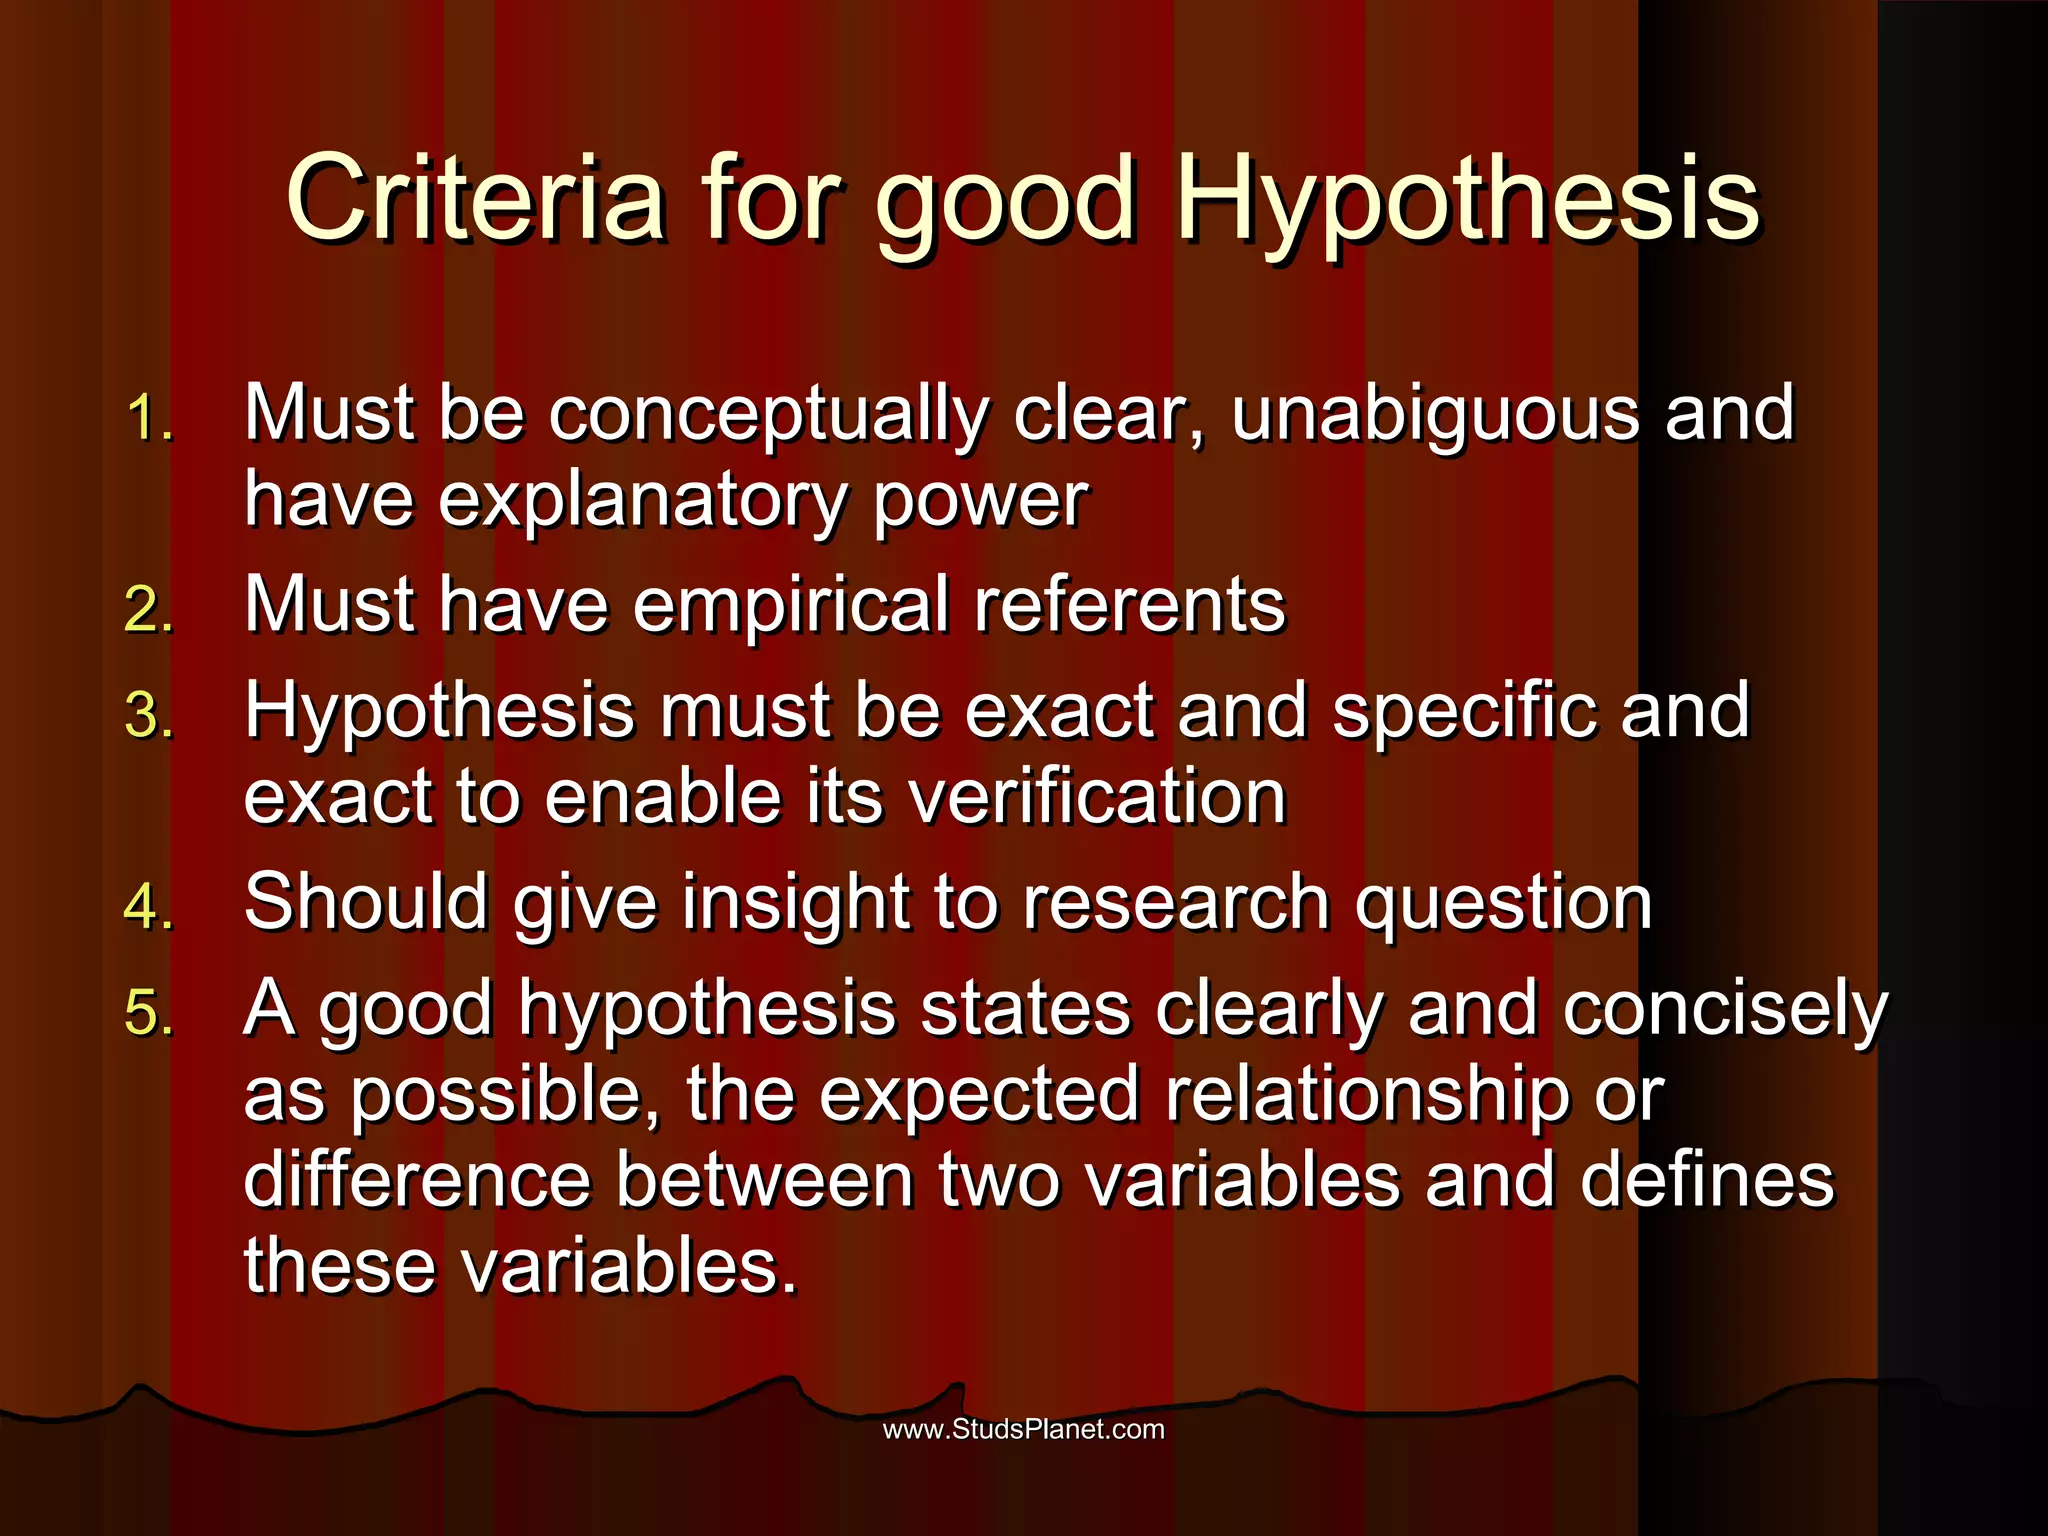
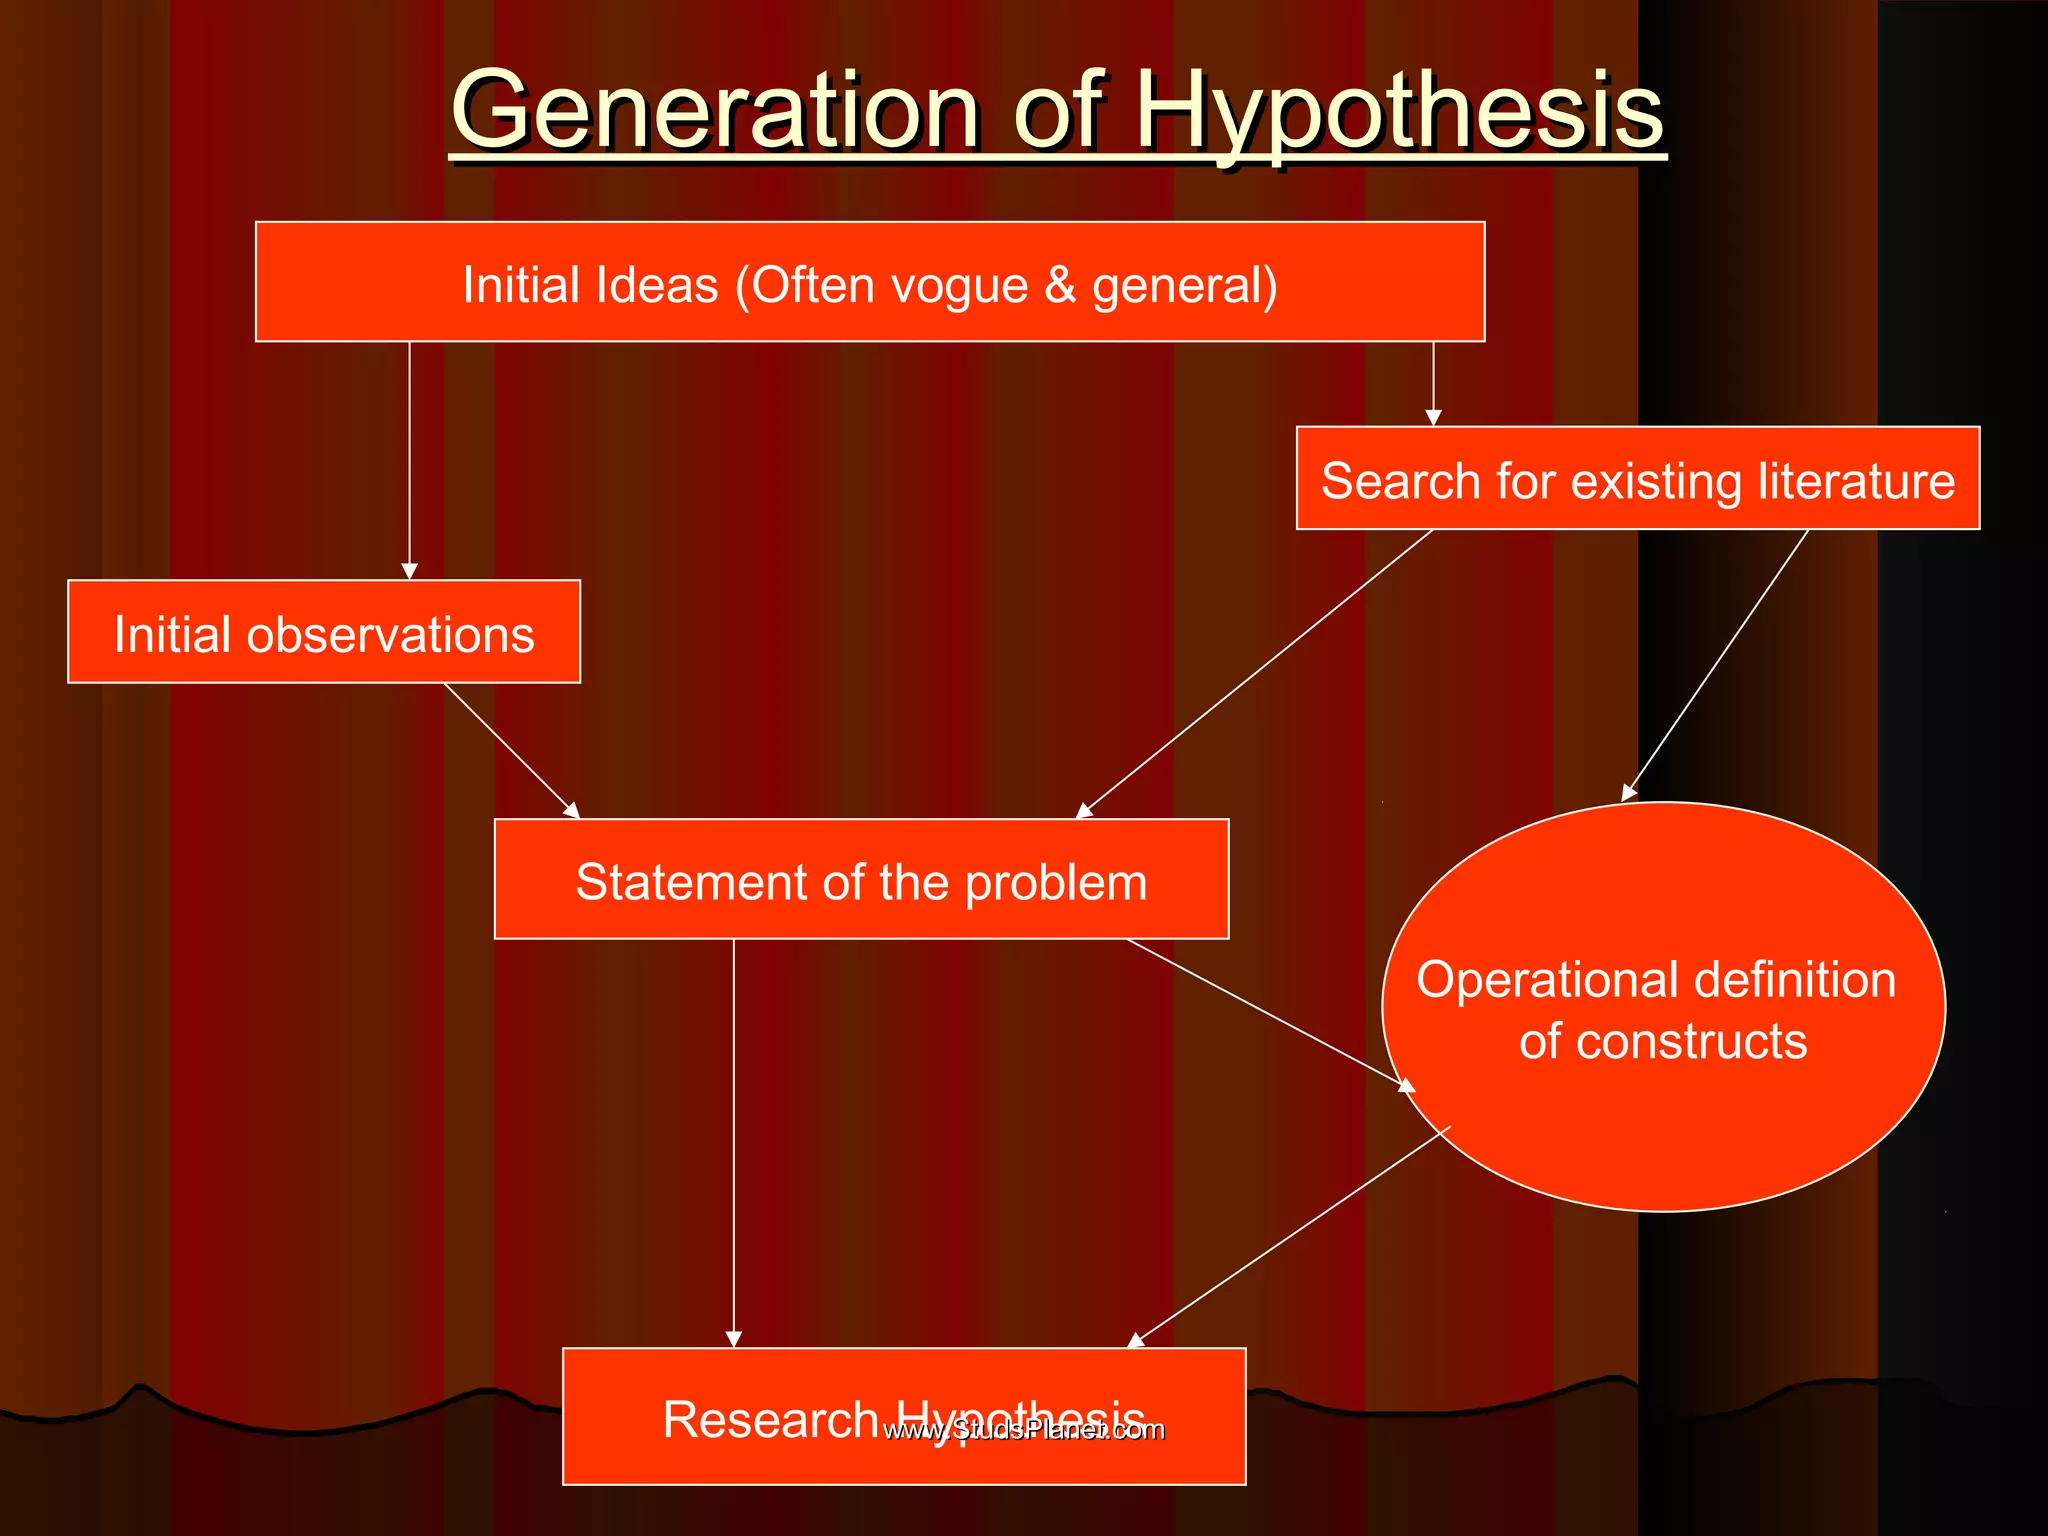
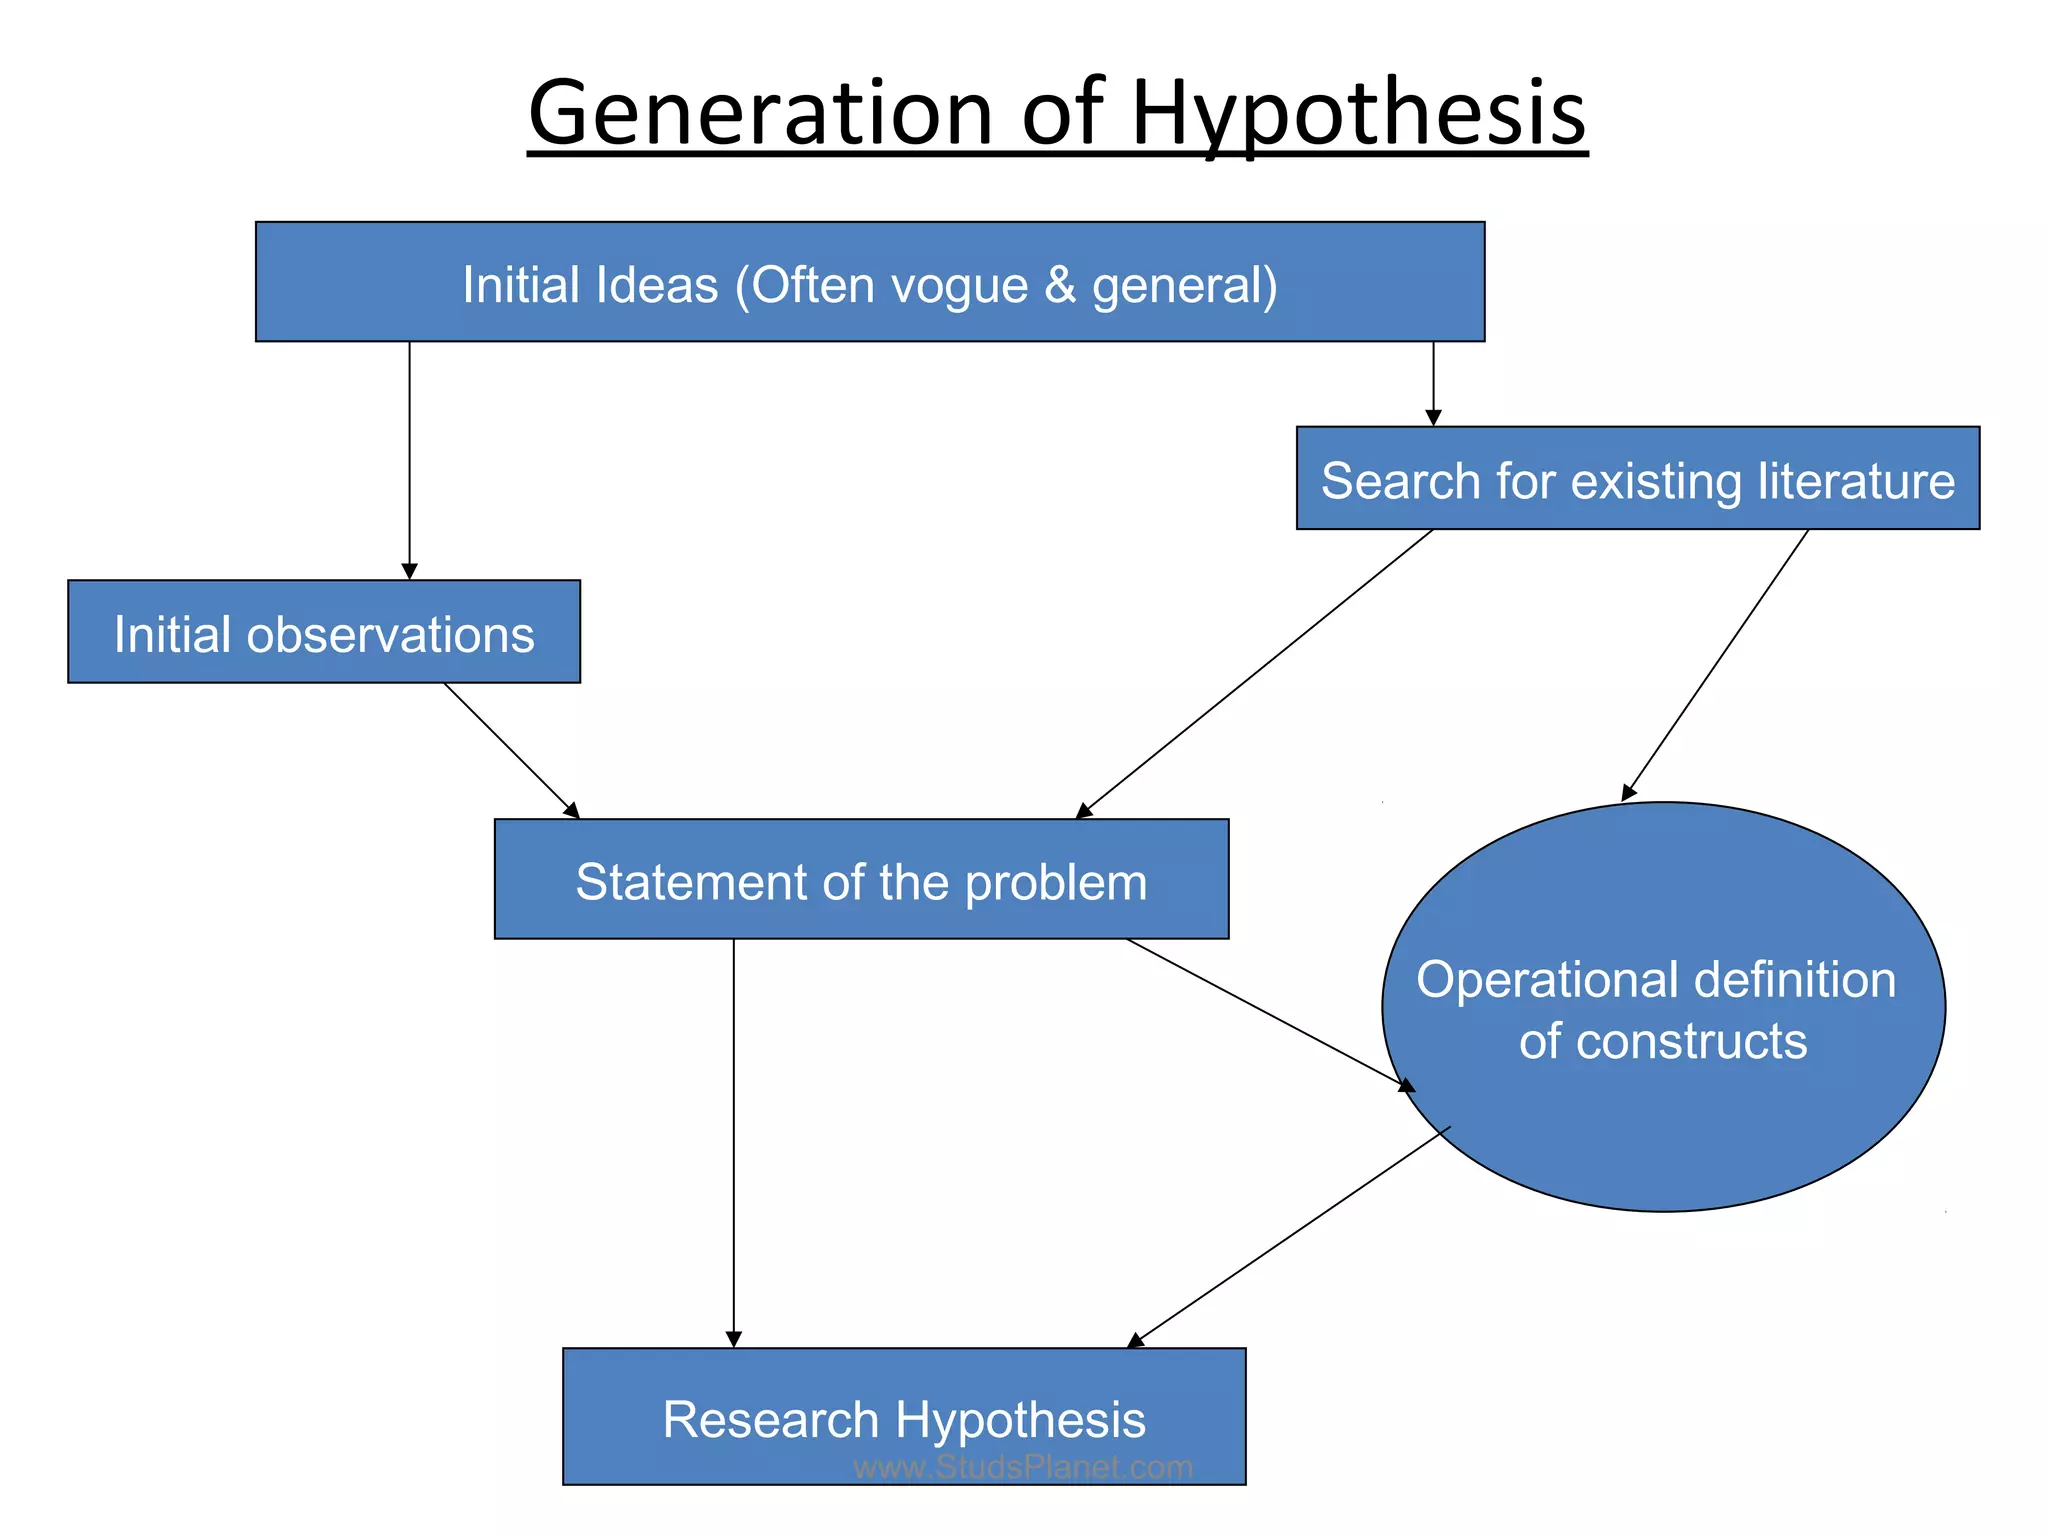
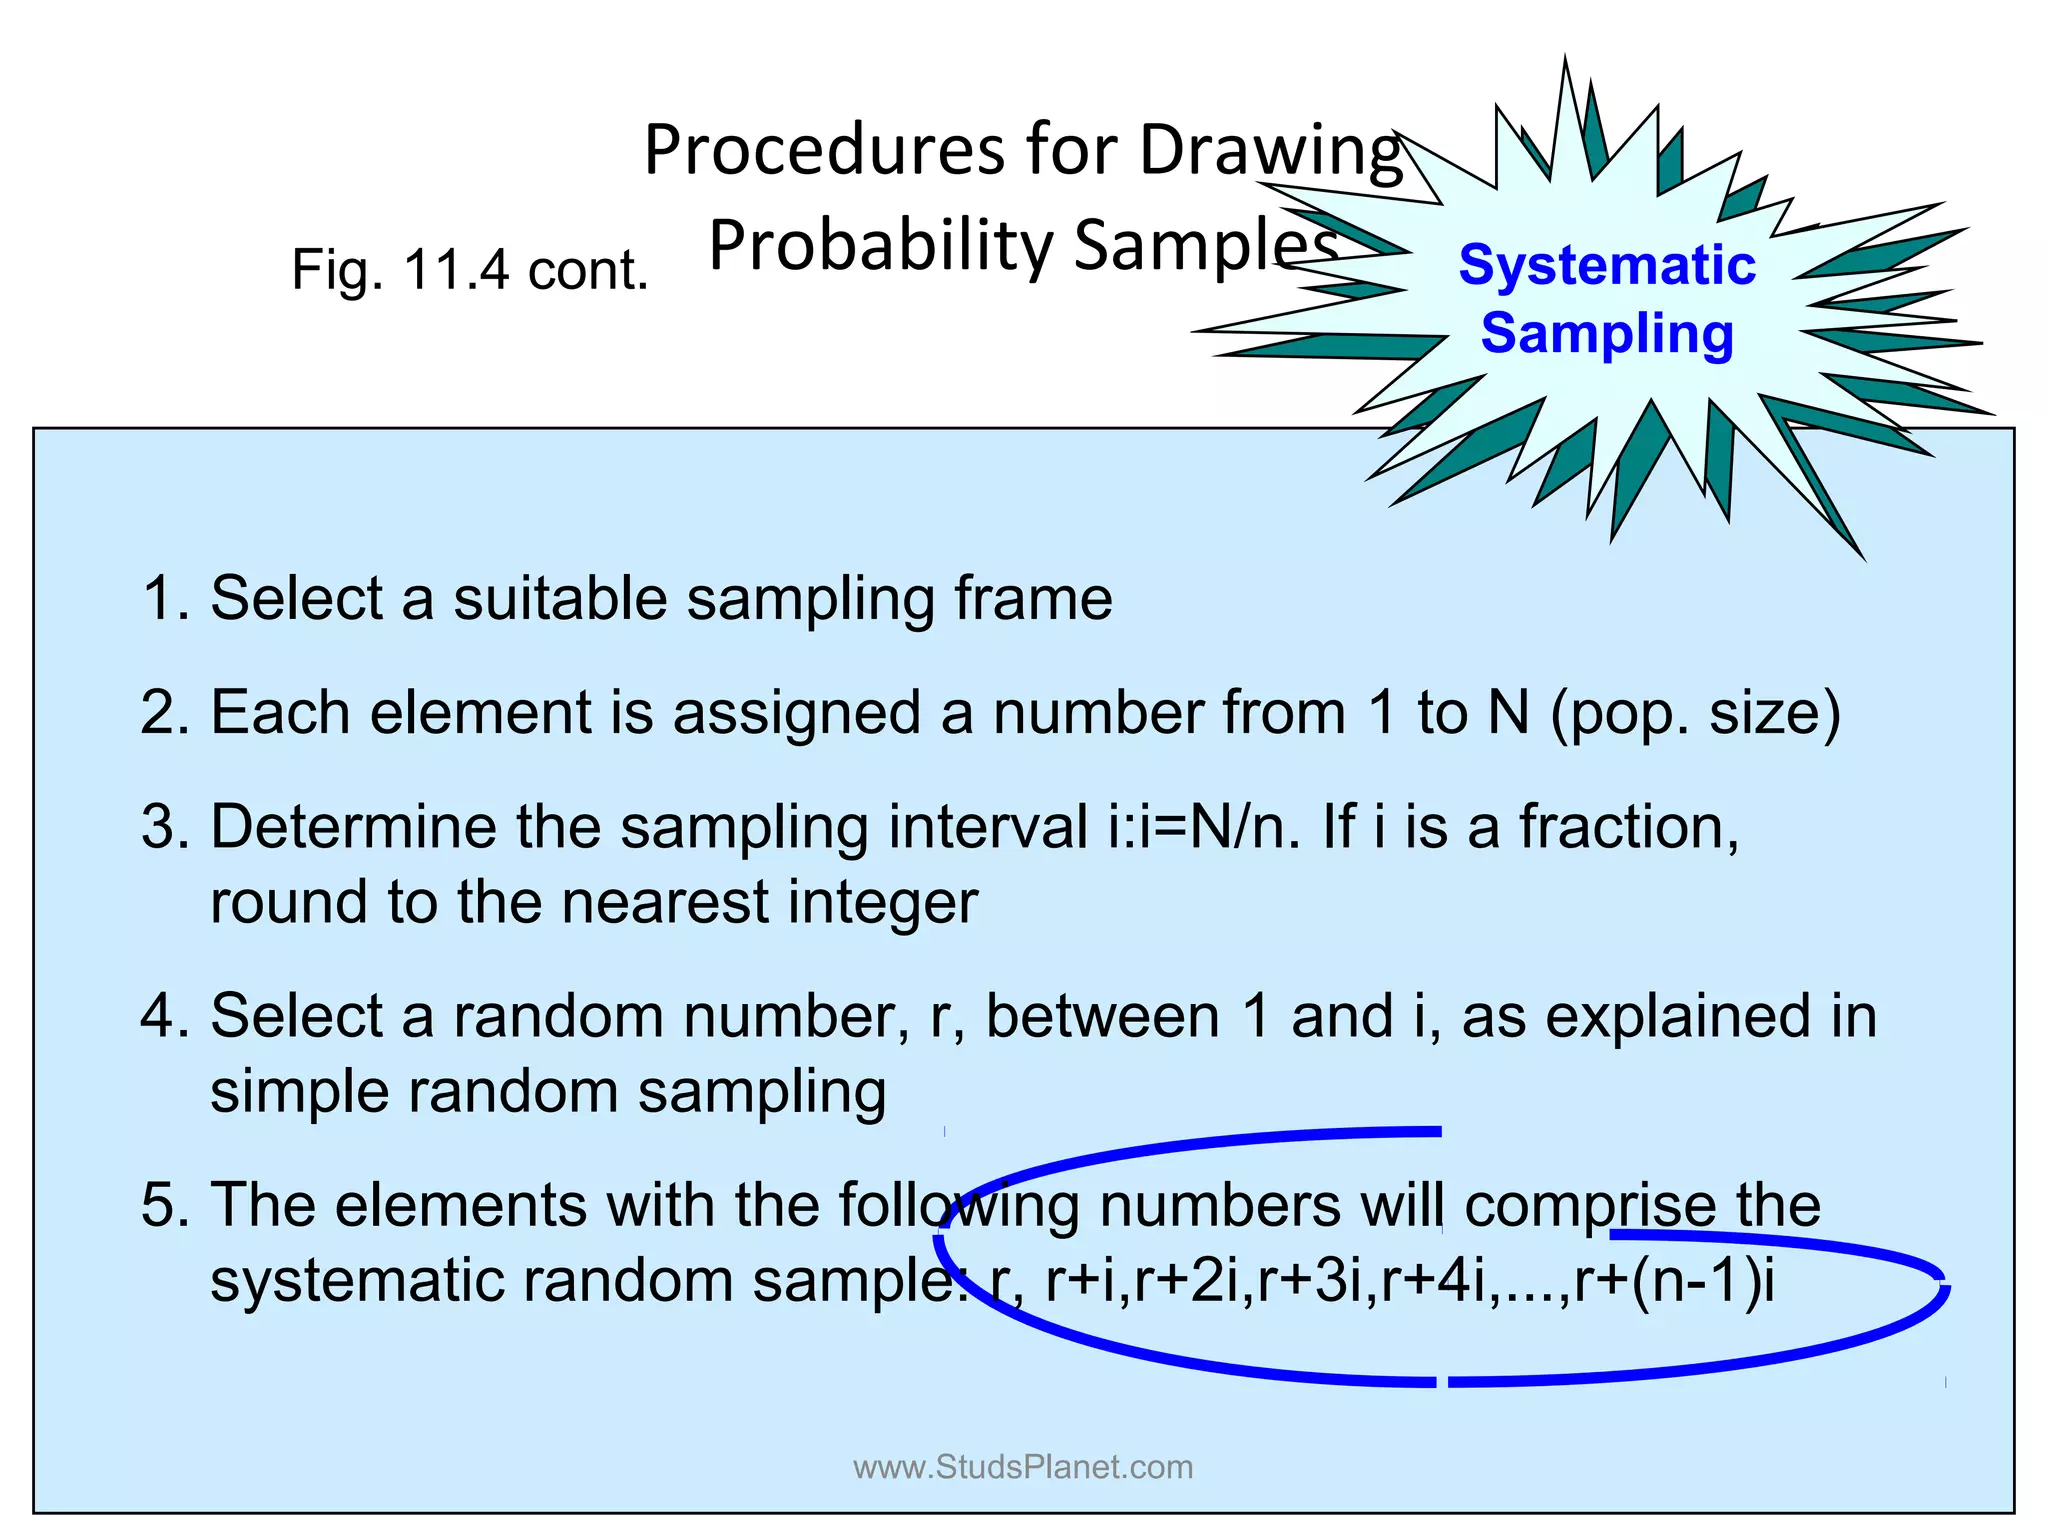
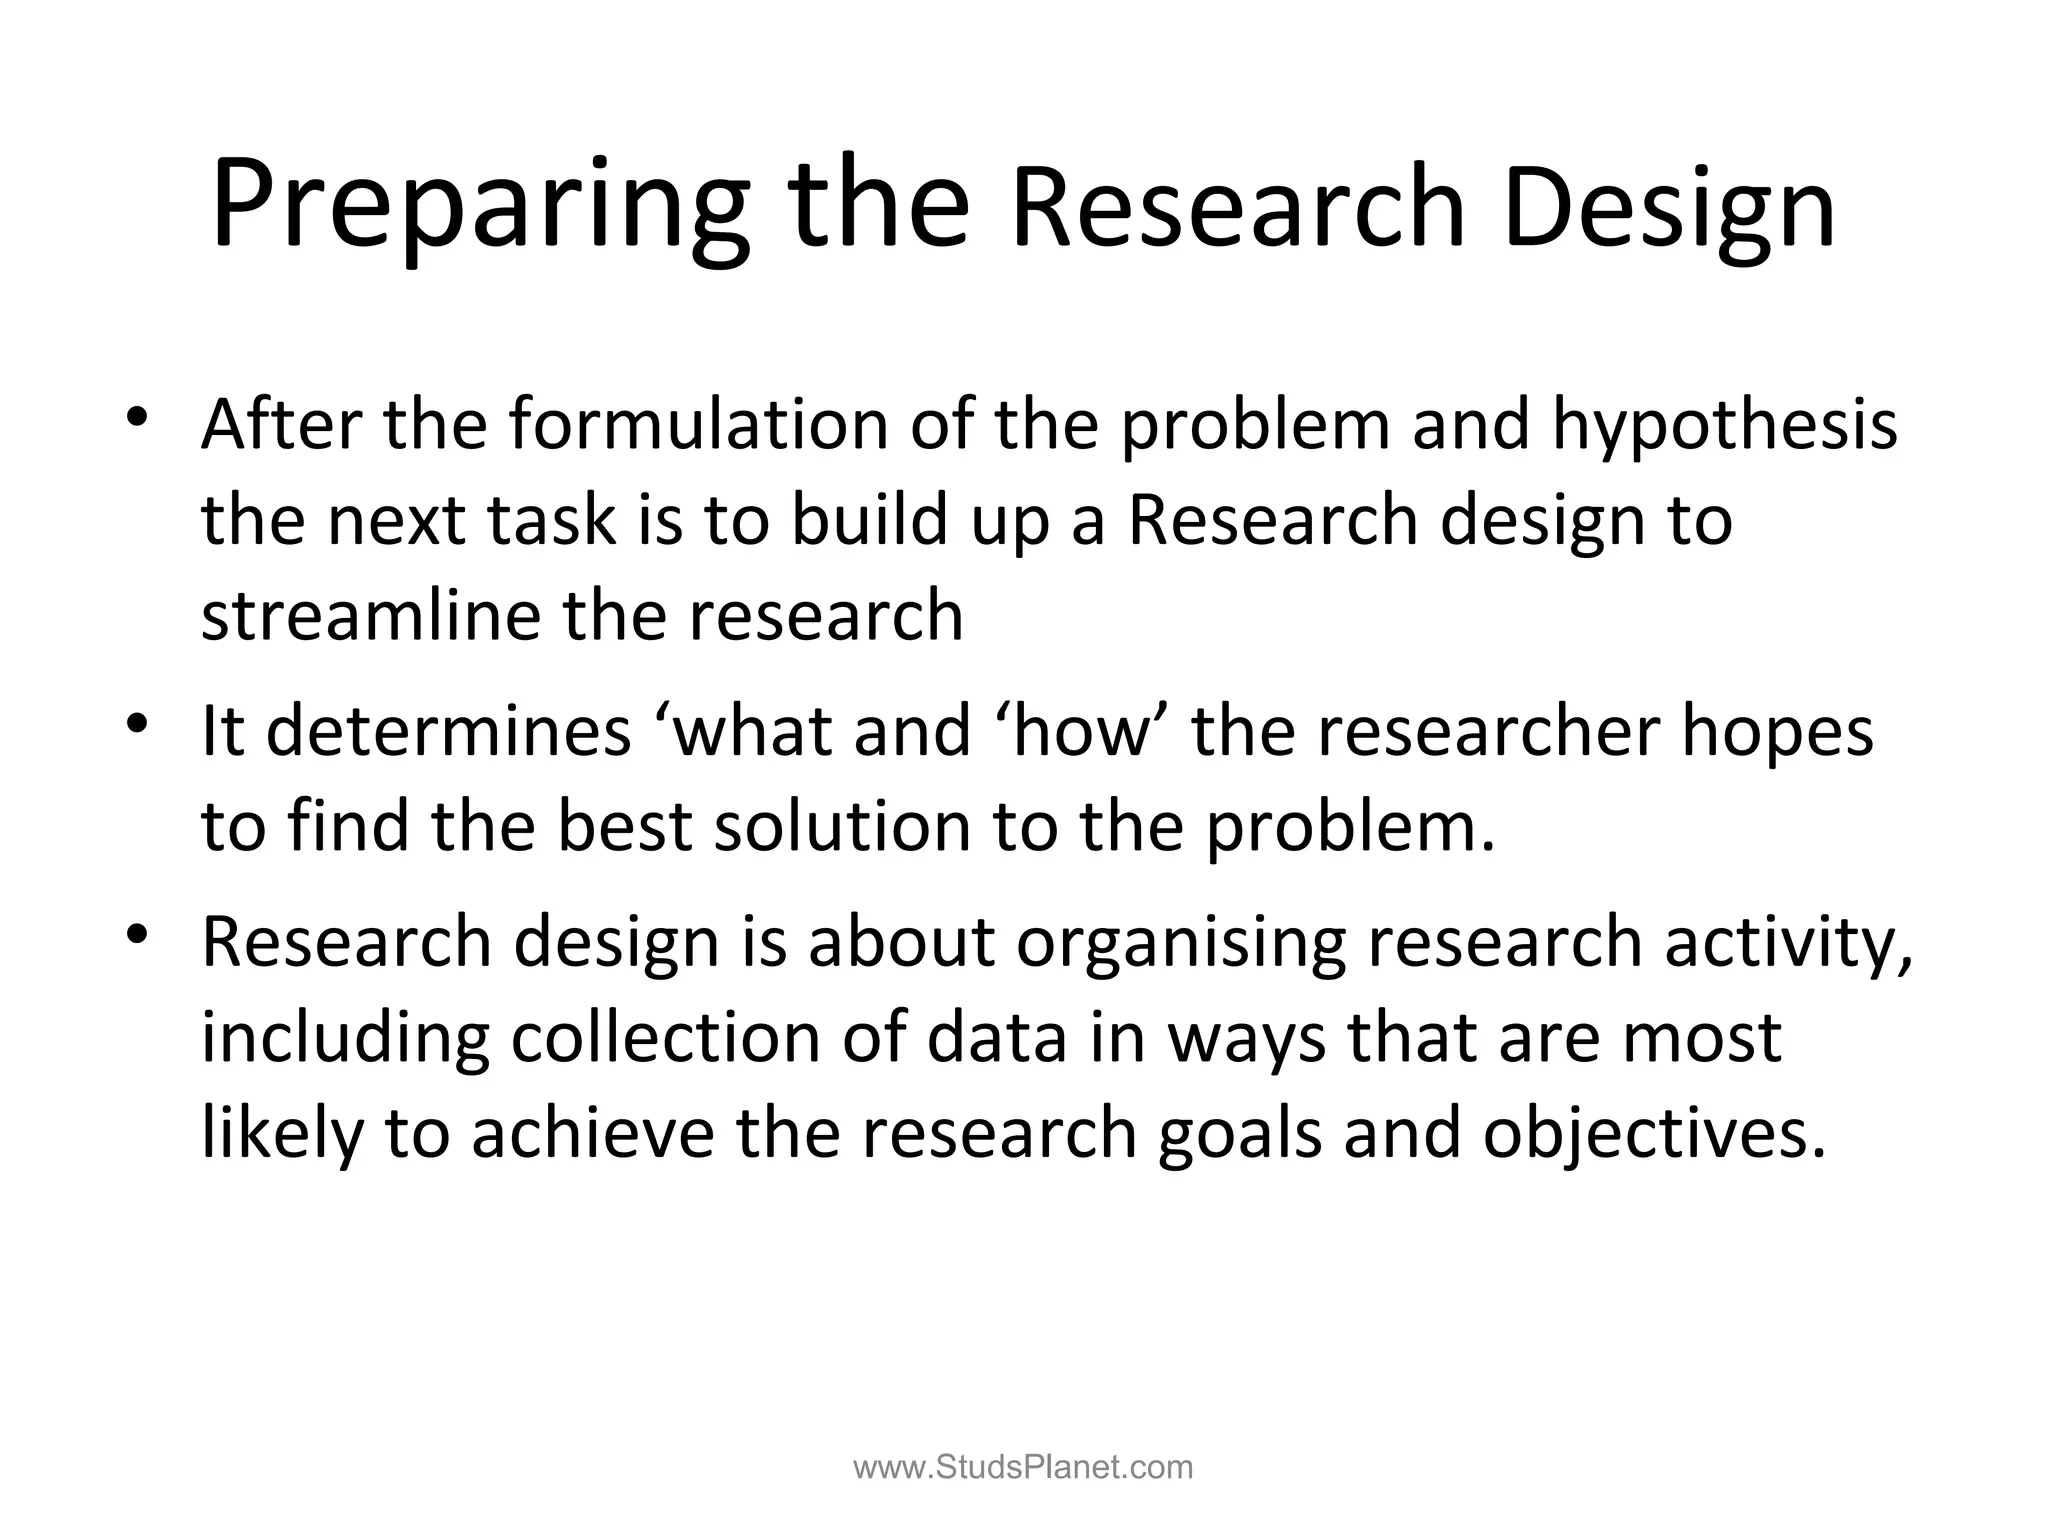
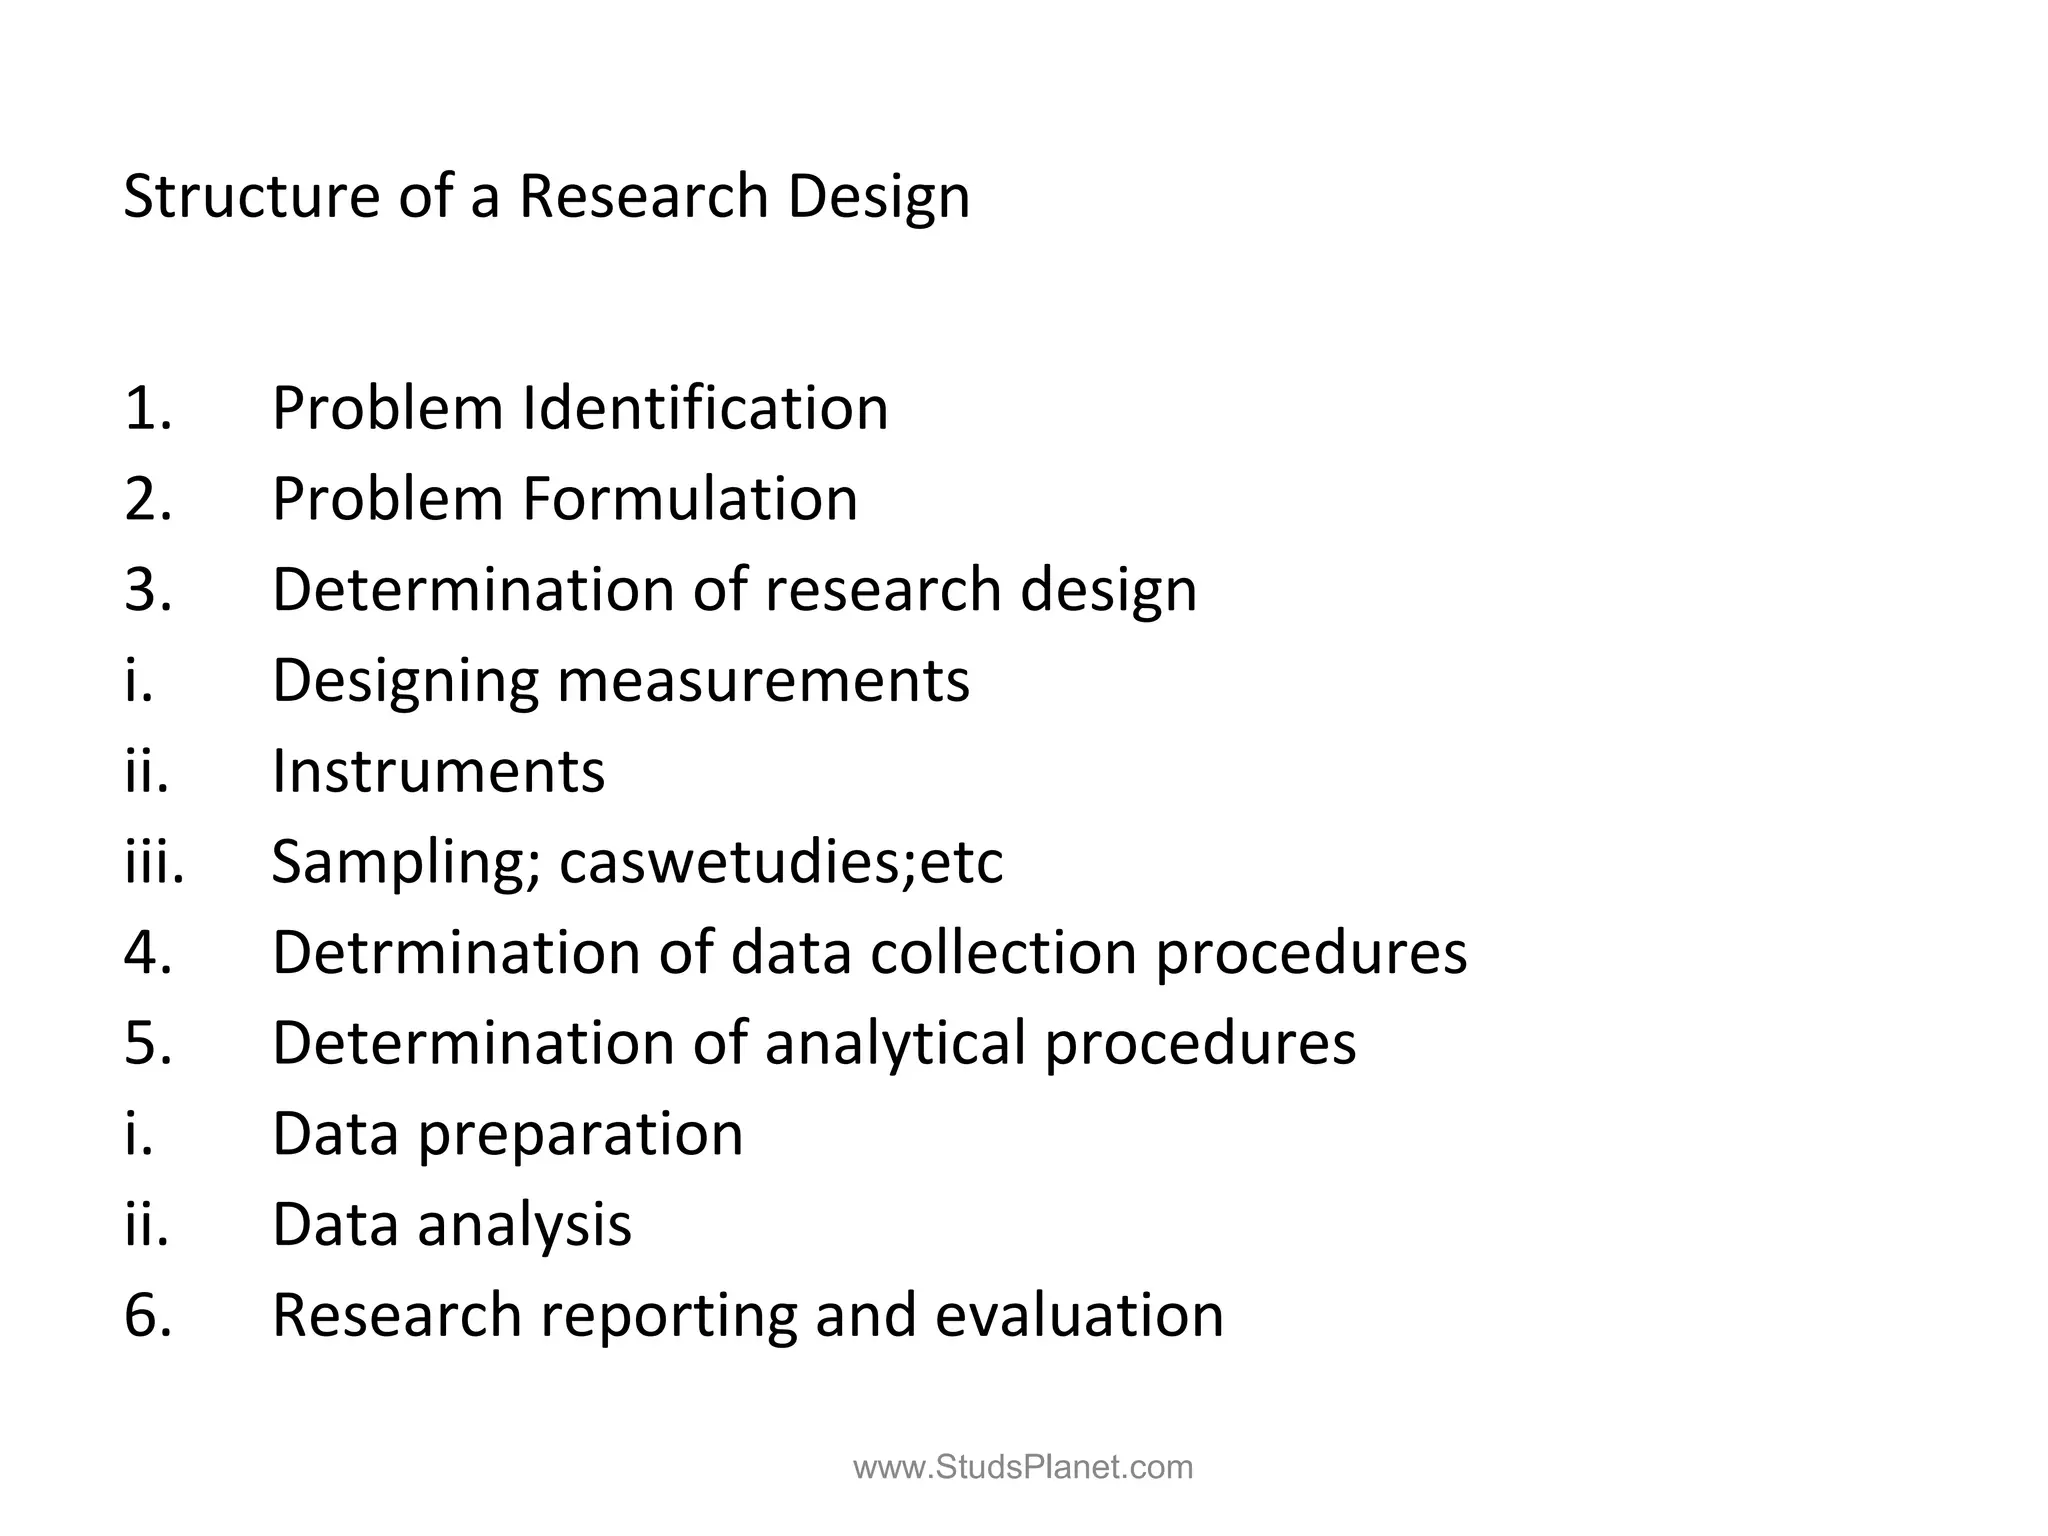
Module -2Module -2
www.StudsPlanet.comwww.StudsPlanet.com
Steps in searchSteps in search
 PlanningPlanning
1.1. Formulating research problemFormulating research problem
2.2. Review of LiteratureReview of Literature
3.3. Developing hypothesisDeveloping hypothesis
4.4. Preparing the research designPreparing the research design
5.5. Determining the sample designDetermining the sample design
 OperationOperation
6.6. Collection of dataCollection of data
7.7. Execution of projectExecution of project
8.8. Analysis of dataAnalysis of data
9.9. Hypothesis testingHypothesis testing
10.10. Generalisation and InterpretationGeneralisation and Interpretation
 ReportingReporting
11.11. Preparation and presentation of ReportPreparation and presentation of Report
www.StudsPlanet.comwww.StudsPlanet.com
HypothesisHypothesis
1.1. Imaginable verifiable conclusion is called aImaginable verifiable conclusion is called a
HypothesisHypothesis
2.2. The hypothesis starts from a proposition whichThe hypothesis starts from a proposition which
is defined as a statement about a concept thatis defined as a statement about a concept that
may turn out to be true or false when referredmay turn out to be true or false when referred
to observable phenomena.to observable phenomena.
When the proposition is suitably formulated forWhen the proposition is suitably formulated for
empirical verification, we name it as aempirical verification, we name it as a
hypothesis.hypothesis.
3.3. The hypothesis is a declarative tentativeThe hypothesis is a declarative tentative
statement and is conjectural in nature.statement and is conjectural in nature.
www.StudsPlanet.comwww.StudsPlanet.com
The suggestion formulated in theThe suggestion formulated in the
hypothesis may ultimately lead to thehypothesis may ultimately lead to the
solution of the problem.solution of the problem.
Hypothesis relates theory to observationHypothesis relates theory to observation
and observation to theory.and observation to theory.
Hypothesis is a clear statement of what isHypothesis is a clear statement of what is
intended to be investigated. It should beintended to be investigated. It should be
specified before research is conductedspecified before research is conducted
and openly stated in reporting the results.and openly stated in reporting the results.
www.StudsPlanet.comwww.StudsPlanet.com
It is neither too specific nor too general.It is neither too specific nor too general.
It is considered valuable even if provenIt is considered valuable even if proven
falsefalse
It is a prediction of consequences.It is a prediction of consequences.
A hypothesis can be directional or non-A hypothesis can be directional or non-
directionaldirectional
www.StudsPlanet.comwww.StudsPlanet.com
HypothesisHypothesis
 DefinitionDefinition
A hypothesis can be defined as aA hypothesis can be defined as a
tentative explanation for certaintentative explanation for certain
behaviors, phenomena or events thatbehaviors, phenomena or events that
have occurred or will occur, that is ahave occurred or will occur, that is a
possible outcome of the research or anpossible outcome of the research or an
educated guess about the researcheducated guess about the research
outcome which can be tested foroutcome which can be tested for
possible acceptance.possible acceptance.
www.StudsPlanet.comwww.StudsPlanet.com
Types of HypothesisTypes of Hypothesis
 With reference to function:With reference to function:
1.1. Descriptive hypothesisDescriptive hypothesis
2.2. Relational hypothesisRelational hypothesis
www.StudsPlanet.comwww.StudsPlanet.com
 Descriptive hypothesis are propositionsDescriptive hypothesis are propositions
that typically state the existence, size,that typically state the existence, size,
form or distribution of some variable.form or distribution of some variable.
Examples:Examples:
 Executives stay longer time in the officeExecutives stay longer time in the office
 Public enterprises are more amenablePublic enterprises are more amenable
for centralised planningfor centralised planning
 The educational system is not oriented toThe educational system is not oriented to
human resources needs of a country.human resources needs of a country.
www.StudsPlanet.comwww.StudsPlanet.com
 Relational hypothesis is used to describeRelational hypothesis is used to describe
a relationship between two variables.a relationship between two variables.
 The relation ships may be either anThe relation ships may be either an
unspecified relationship or anunspecified relationship or an
explanatory/casual relationshipexplanatory/casual relationship
 Cause-effect relationshipCause-effect relationship
www.StudsPlanet.comwww.StudsPlanet.com
 Relational hypothesisRelational hypothesis
1.1. Casual Hypotheses state that the existence of,Casual Hypotheses state that the existence of,
or a change in, one variable causes or leadsor a change in, one variable causes or leads
to an effect on another variable: First variable -to an effect on another variable: First variable -
Independent Second variable – DependentIndependent Second variable – Dependent
 Examples:Examples:
i.i. Families with higher incomes spend more forFamilies with higher incomes spend more for
recreationrecreation
ii.ii. Participative learning promotes motivationParticipative learning promotes motivation
among studentsamong students
www.StudsPlanet.comwww.StudsPlanet.com
2.2. Correlational hypothesisCorrelational hypothesis
The unspecified relationship gives rise toThe unspecified relationship gives rise to
Correlational hypotheses where theCorrelational hypotheses where the
variables occur together in a specifiedvariables occur together in a specified
manner without implying that one causesmanner without implying that one causes
the other.the other.
Example: Younger machinists are lessExample: Younger machinists are less
productive than those who are older.productive than those who are older.
www.StudsPlanet.comwww.StudsPlanet.com
 Working HypothesesWorking Hypotheses
While planning the study of a problemWhile planning the study of a problem
hypotheses are formed temporarilyhypotheses are formed temporarily
which are referred as Workingwhich are referred as Working
Hypotheses. These subject toHypotheses. These subject to
modifications while research proceeds.modifications while research proceeds.
1.1. Statistical HypothesesStatistical Hypotheses
2.2. Null HypothesesNull Hypotheses
www.StudsPlanet.comwww.StudsPlanet.com
 A research hypothesis is a statement about theA research hypothesis is a statement about the
relationship one expects to find the analysis ofrelationship one expects to find the analysis of
research results.research results.
 A null hypothesis is opposite of ResearchA null hypothesis is opposite of Research
hypothesishypothesis
 In case it is not possible to test ResearchIn case it is not possible to test Research
hypothesis with the help of statistical techniqueshypothesis with the help of statistical techniques
it can be transformed into another type ofit can be transformed into another type of
hypothesis called Null Hypothesishypothesis called Null Hypothesis
www.StudsPlanet.comwww.StudsPlanet.com
Statistical HypothesesStatistical Hypotheses
 These are statements about statisticalThese are statements about statistical
population. These are derived from apopulation. These are derived from a
sample. Quantitative in nature.sample. Quantitative in nature.
Ex. Group A is older than Group BEx. Group A is older than Group B
www.StudsPlanet.comwww.StudsPlanet.com
Null HypothesisNull Hypothesis
 A Null Hypothesis is the opposite of what theA Null Hypothesis is the opposite of what the
researcher expectsresearcher expects
 The reason for using Null Hypothesis is that itThe reason for using Null Hypothesis is that it
enables to distinguish the real difference fromenables to distinguish the real difference from
the observed difference due to chance only tothe observed difference due to chance only to
through statistical tests.through statistical tests.
 If the Null Hypothesis (Ho)is rejected, theIf the Null Hypothesis (Ho)is rejected, the
research hypothesis, stated as alternativeresearch hypothesis, stated as alternative
Hypothesis (HHypothesis (HA orA or HH1)1) is expected to be true.is expected to be true.
www.StudsPlanet.comwww.StudsPlanet.com
 Level of AbstractionLevel of Abstraction
1.1. Common-sense HypothesesCommon-sense Hypotheses
2.2. Complex HypothesesComplex Hypotheses
3.3. Analytical HypothesesAnalytical Hypotheses
www.StudsPlanet.comwww.StudsPlanet.com
1.1. Common-sense Hypotheses : TheseCommon-sense Hypotheses : These
represent the common sense ideas.represent the common sense ideas.
They state the existence of empiricalThey state the existence of empirical
uniformities perceived through day touniformities perceived through day to
day observationsday observations
Ex: Labour in un-organised sector lackEx: Labour in un-organised sector lack
motivationmotivation
www.StudsPlanet.comwww.StudsPlanet.com
2.2. Complex HypothesesComplex Hypotheses
 These aim at testing the existence ofThese aim at testing the existence of
logically derived relationships betweenlogically derived relationships between
empirical uniformities.empirical uniformities.
 The function of such hypothesis is to createThe function of such hypothesis is to create
tools and problems for further research intools and problems for further research in
otherwise very complex areas ofotherwise very complex areas of
investigations.investigations.
 Ex: 1.Concentric growth charectarize a cityEx: 1.Concentric growth charectarize a city
2. Members of minority group suffer from2. Members of minority group suffer from
oppression psychosisoppression psychosis
www.StudsPlanet.comwww.StudsPlanet.com
3.3. Analytical HypothesesAnalytical Hypotheses
 These are concerned with relation hip of analyticalThese are concerned with relation hip of analytical
variables. These hypothesis occur at the highest levelvariables. These hypothesis occur at the highest level
of abstraction.of abstraction.
 These specify relationship between changes in oneThese specify relationship between changes in one
property and changes in another.property and changes in another.
 This level of hypothesis is the most sophisticated modeThis level of hypothesis is the most sophisticated mode
of formulation and contributes to the development ofof formulation and contributes to the development of
‘brilliant’ abstract theories.‘brilliant’ abstract theories.
 Ex: There are two segments in India. One with higherEx: There are two segments in India. One with higher
income and the other with lower income. The higherincome and the other with lower income. The higher
income group have less children than the lower incomeincome group have less children than the lower income
group of peoplegroup of people
www.StudsPlanet.comwww.StudsPlanet.com
Difference between Hypothesis andDifference between Hypothesis and
ProblemProblem
1.1. Problem is a questionProblem is a question
and is not testable.and is not testable.
2.2. Relation betweenRelation between
variable in problemvariable in problem
statementstatement
3.3. Is A related to BIs A related to B
4.4. How e A and B related toHow e A and B related to
C?C?
5.5. How is A related to BHow is A related to B
under conditions C andunder conditions C and
DD
1.1. Hypothesis is aHypothesis is a
statement and can bestatement and can be
testedtested
2.2. Relation betweenRelation between
variables in hypothesisvariables in hypothesis
3.3. If A, then BIf A, then B
4.4. If A and B, then CIf A and B, then C
5.5. If A, then B underIf A, then B under
conditions C and Dconditions C and D
www.StudsPlanet.comwww.StudsPlanet.com
Criteria for good HypothesisCriteria for good Hypothesis
1.1. Must be conceptually clear, unabiguous andMust be conceptually clear, unabiguous and
have explanatory powerhave explanatory power
2.2. Must have empirical referentsMust have empirical referents
3.3. Hypothesis must be exact and specific andHypothesis must be exact and specific and
exact to enable its verificationexact to enable its verification
4.4. Should give insight to research questionShould give insight to research question
5.5. A good hypothesis states clearly and conciselyA good hypothesis states clearly and concisely
as possible, the expected relationship oras possible, the expected relationship or
difference between two variables and definesdifference between two variables and defines
these variables.these variables.
www.StudsPlanet.comwww.StudsPlanet.com
Generation of HypothesisGeneration of Hypothesis
Initial Ideas (Often vogue & general)
Initial observations
Search for existing literature
Statement of the problem
Operational definition
of constructs
Research Hypothesiswww.StudsPlanet.comwww.StudsPlanet.com
Generation of Hypothesis
Initial Ideas (Often vogue & general)
Initial observations
Search for existing literature
Statement of the problem
Operational definition
of constructs
Research Hypothesis
www.StudsPlanet.com
Sample vs. CensusTable 11.1
Conditions Favoring the Use of
Type of Study Sample Census
1. Budget Small Large
2. Time available Short Long
3. Population size Large Small
4. Variance in the characteristic Small Large
5. Cost of sampling errors Low High
6. Cost of nonsampling errors High Low
7. Nature of measurement Destructive Nondestructive
8. Attention to individual cases Yes Nowww.StudsPlanet.com
The Sampling Design Process
Fig. 11.1
Define the Population
Determine the Sampling Frame
Select Sampling Technique(s)
Determine the Sample Size
Execute the Sampling Process
www.StudsPlanet.com
Define the Target Population
The target population is the collection of elements or objects
that possess the information sought by the researcher and
about which inferences are to be made. The target
population should be defined in terms of elements, sampling
units, extent, and time.
– An element is the object about which or from which the
information is desired, e.g., the respondent.
– A sampling unit is an element, or a unit containing the
element, that is available for selection at some stage of
the sampling process.
– Extent refers to the geographical boundaries.
– Time is the time period under consideration.
www.StudsPlanet.com
Define the Target Population
Important qualitative factors in determining the sample size
– the importance of the decision
– the nature of the research
– the number of variables
– the nature of the analysis
– sample sizes used in similar studies
– incidence rates
– completion rates
– resource constraints
www.StudsPlanet.com
Sample Sizes Used in Marketing
Research StudiesTable 11.2
Type of Study Minimum Size Typical Range
Problem identification research
(e.g. market potential)
500 1,000-2,500
Problem-solving research (e.g.
pricing)
200 300-500
Product tests 200 300-500
Test marketing studies 200 300-500
TV, radio, or print advertising (per
commercial or ad tested)
150 200-300
Test-market audits 10 stores 10-20 stores
Focus groups 2 groups 4-12 groupswww.StudsPlanet.com
Classification of Sampling Techniques
Fig. 11.2
Sampling Techniques
Nonprobability
Sampling Techniques
Probability
Sampling Techniques
Convenience
Sampling
Judgmental
Sampling
Quota
Sampling
Snowball
Sampling
Systematic
Sampling
Stratified
Sampling
Cluster
Sampling
Other Sampling
Techniques
Simple
Random
Sampling www.StudsPlanet.com
Convenience Sampling
Convenience sampling attempts to obtain a sample of
convenient elements. Often, respondents are selected
because they happen to be in the right place at the right time.
– use of students, and members of social organizations
– mall intercept interviews without qualifying the
respondents
– department stores using charge account lists
– “people on the street” interviews
www.StudsPlanet.com
Judgmental Sampling
Judgmental sampling is a form of convenience sampling in
which the population elements are selected based on the
judgment of the researcher.
– test markets
– purchase engineers selected in industrial marketing
research
– bellwether precincts selected in voting behavior research
– expert witnesses used in court
www.StudsPlanet.com
Quota Sampling
Quota sampling may be viewed as two-stage restricted judgmental sampling.
– The first stage consists of developing control categories, or quotas, of
population elements.
– In the second stage, sample elements are selected based on convenience
or judgment.
Population Sample
composition composition
Control
Characteristic Percentage Percentage Number
Sex
Male 48 48 480
Female 52 52 520
____ ____ ____
100 100 1000
www.StudsPlanet.com
Snowball Sampling
In snowball sampling, an initial group of respondents is
selected, usually at random.
– After being interviewed, these respondents are asked to
identify others who belong to the target population of
interest.
– Subsequent respondents are selected based on the
referrals.
www.StudsPlanet.com
Simple Random Sampling
• Each element in the population has a known and equal
probability of selection.
• Each possible sample of a given size (n) has a known and
equal probability of being the sample actually selected.
• This implies that every element is selected independently of
every other element.
www.StudsPlanet.com
Systematic Sampling
• The sample is chosen by selecting a random starting point and then
picking every ith element in succession from the sampling frame.
• The sampling interval, i, is determined by dividing the population size N by
the sample size n and rounding to the nearest integer.
• When the ordering of the elements is related to the characteristic of
interest, systematic sampling increases the representativeness of the
sample.
• If the ordering of the elements produces a cyclical pattern, systematic
sampling may decrease the representativeness of the sample.
For example, there are 100,000 elements in the population and a sample
of 1,000 is desired. In this case the sampling interval, i, is 100. A random
number between 1 and 100 is selected. If, for example, this number is 23,
the sample consists of elements 23, 123, 223, 323, 423, 523, and so on.
www.StudsPlanet.com
Stratified Sampling
• A two-step process in which the population is partitioned into
subpopulations, or strata.
• The strata should be mutually exclusive and collectively
exhaustive in that every population element should be
assigned to one and only one stratum and no population
elements should be omitted.
• Next, elements are selected from each stratum by a random
procedure, usually SRS.
• A major objective of stratified sampling is to increase
precision without increasing cost.
www.StudsPlanet.com
Stratified Sampling
• The elements within a stratum should be as homogeneous as possible,
but the elements in different strata should be as heterogeneous as
possible.
• The stratification variables should also be closely related to the
characteristic of interest.
• Finally, the variables should decrease the cost of the stratification process
by being easy to measure and apply.
• In proportionate stratified sampling, the size of the sample drawn from
each stratum is proportionate to the relative size of that stratum in the
total population.
• In disproportionate stratified sampling, the size of the sample from each
stratum is proportionate to the relative size of that stratum and to the
standard deviation of the distribution of the characteristic of interest
among all the elements in that stratum.
www.StudsPlanet.com
Cluster Sampling
• The target population is first divided into mutually exclusive and
collectively exhaustive subpopulations, or clusters.
• Then a random sample of clusters is selected, based on a probability
sampling technique such as SRS.
• For each selected cluster, either all the elements are included in the
sample (one-stage) or a sample of elements is drawn probabilistically
(two-stage).
• Elements within a cluster should be as heterogeneous as possible, but
clusters themselves should be as homogeneous as possible. Ideally, each
cluster should be a small-scale representation of the population.
• In probability proportionate to size sampling, the clusters are sampled
with probability proportional to size. In the second stage, the probability
of selecting a sampling unit in a selected cluster varies inversely with the
size of the cluster.
www.StudsPlanet.com
Types of Cluster SamplingFig. 11.3 Cluster Sampling
One-Stage
Sampling
Multistage
Sampling
Two-Stage
Sampling
Simple Cluster
Sampling
Probability
Proportionate
to Size Sampling
www.StudsPlanet.com
Technique Strengths Weaknesses
Non probability Sampling
Convenience sampling
Least expensive, least
time-consuming, most
convenient
Selection bias, sample not
representative, not recommended for
descriptive or causal research
Judgmental sampling Low cost, convenient,
not time-consuming
Does not allow generalization,
subjective
Quota sampling Sample can be controlled
for certain characteristics
Selection bias, no assurance of
representativeness
Snowball sampling Can estimate rare
characteristics
Time-consuming
Probability sampling
Simple random sampling
(SRS)
Easily understood,
resultsprojectable
Difficult to construct sampling
frame, expensive, lower precision,
no assurance ofrepresentativeness.
Systematic sampling Can increase
representativeness,
easier to implement than
SRS, sampling frame not
necessary
Can decreaserepresentativeness
Stratified sampling Include all important
subpopulations,
precision
Difficult to select relevant
stratification variables, not feasible to
stratify on many variables, expensive
Cluster sampling Easy to implement, cost
effective
Imprecise, difficult to compute and
interpret results
Table 11.3
Strengths and Weaknesses of
Basic Sampling Techniques
www.StudsPlanet.com
Procedures for Drawing Probability Samples
Fig. 11.4
Simple Random
Sampling
1. Select a suitable sampling frame
2. Each element is assigned a number from 1 to N
(pop. size)
3. Generate n (sample size) different random numbers
between 1 and N
4. The numbers generated denote the elements that
should be included in the sample
www.StudsPlanet.com
Procedures for Drawing
Probability SamplesFig. 11.4 cont. Systematic
Sampling
1. Select a suitable sampling frame
2. Each element is assigned a number from 1 to N (pop. size)
3. Determine the sampling interval i:i=N/n. If i is a fraction,
round to the nearest integer
4. Select a random number, r, between 1 and i, as explained in
simple random sampling
5. The elements with the following numbers will comprise the
systematic random sample: r, r+i,r+2i,r+3i,r+4i,...,r+(n-1)i
www.StudsPlanet.com
Choosing Nonprobability vs.
Probability Sampling
Conditions Favoring the Use of
Factors Nonprobability
sampling
Probability
sampling
Nature of research Exploratory Conclusive
Relative magnitude of sampling
and nonsampling errors
Nonsampling
errors are
larger
Sampling
errors are
larger
Variability in the population Homogeneous
(low )
Heterogeneous
(high)
Statistical considerations Unfavorable Favorable
Operational considerations Favorable Unfavorable
Table 11.4 cont.
www.StudsPlanet.com
Preparing the Research Design
• After the formulation of the problem and hypothesis
the next task is to build up a Research design to
streamline the research
• It determines ‘what and ‘how’ the researcher hopes
to find the best solution to the problem.
• Research design is about organising research activity,
including collection of data in ways that are most
likely to achieve the research goals and objectives.
www.StudsPlanet.com
• A research design is a string of logic or blue
print that ultimately links the data to be
collected and the conclusions to be drawn to
the initial questions of study.
• It is a plan/blue print for conducting the
proposed research work.
www.StudsPlanet.com
Need for a Research Design
1. Research design systematises the research operations.
2. Advanced planning helps organising data collection which
involves the availability of field staff, time and money and
devising solutions for possible field problems.
3. A proper design of research study enhances the reliability
of research results and minimises any error that may upset
the project
4. An appropriate design helps the researcher to
systematically organise his ideas in a form which enable
him to locate any flaws and inadequacies and thereby
prompting him to revise the research design.
www.StudsPlanet.com
Classification of Research Design:
• Common classification is according to
purpose known as Basic research designs:
1. Exploratory Research Design
2. Conclusive Research Design
i. Descriptive research design
ii. Casual research design
www.StudsPlanet.com
Other types of classification are:
• Data Collection techniques
1. Personal observation
2. Interviewing
• Period of study
1. Cross sectional
2. Longitudinal
• Scope of Study
1. Case studies
2. Statistical studies
• Types of research questions
1. Explorative
2. Formal
www.StudsPlanet.com
• Study enviroment:
1. Field condition
2. Laboratory condition
• Simulation
1. Control of independent variables
2. Exprimental quasi-experimental
3. Non-experimental
• Participants perceptions
1. Unbiased
2. Biased
www.StudsPlanet.com
Basic Research Designs
Research Designs
Exploratory
Research Conclusive Research
Descriptive Research Casual Research
Cross-sectional Research Longitudinal Researchwww.StudsPlanet.com
Exploratory research Design
1. Ex: Our sales are declining and we do not know
why?
2. Discovery of ideas and insights
3. Exploratory research are useful when the
researcher does not have a clear idea about the
problem or may have a vague idea
4. Tend to rely more on secondary data
5. Uses both qualitative and quantitative but relies
more on qualitative techniques.
www.StudsPlanet.com
Conclusive Research Design
• This is meant to provide information that is
useful in reaching conclusions or decision
making
• Relies both on Primary and Secondary data
www.StudsPlanet.com
Descriptive Research design:
• Ex: What kind of people buy our product ?
Who buy’s our competitors products ?
Describe market charecteristics or functions
• This is a statistical research providing data about the
population.
• It is useful for researches including population
census, Industrial census, employment survey, etc.
• This is a factual data as accurate as possible.
www.StudsPlanet.com
• Cross-sectional research: Cross sectional study
calls for data for a single time.
• Longitudanal study are studies which observe
the state of the world without manipulating,
at several points of time.
www.StudsPlanet.com
Casual Relationship
• Ex: Would buyers prefer this new package design.
• Cause and effect between two variables or more
• Manipulation of one or more independent variable
i. Symmetrical
ii. Asymmetrical
iii. Reciprocal
www.StudsPlanet.com
Structure of a Research Design
1. Problem Identification
2. Problem Formulation
3. Determination of research design
i. Designing measurements
ii. Instruments
iii. Sampling; caswetudies;etc
4. Detrmination of data collection procedures
5. Determination of analytical procedures
i. Data preparation
ii. Data analysis
6. Research reporting and evaluation
www.StudsPlanet.com

Research methodology

  • 1.
  • 2.
    Steps in searchStepsin search  PlanningPlanning 1.1. Formulating research problemFormulating research problem 2.2. Review of LiteratureReview of Literature 3.3. Developing hypothesisDeveloping hypothesis 4.4. Preparing the research designPreparing the research design 5.5. Determining the sample designDetermining the sample design  OperationOperation 6.6. Collection of dataCollection of data 7.7. Execution of projectExecution of project 8.8. Analysis of dataAnalysis of data 9.9. Hypothesis testingHypothesis testing 10.10. Generalisation and InterpretationGeneralisation and Interpretation  ReportingReporting 11.11. Preparation and presentation of ReportPreparation and presentation of Report www.StudsPlanet.comwww.StudsPlanet.com
  • 3.
    HypothesisHypothesis 1.1. Imaginable verifiableconclusion is called aImaginable verifiable conclusion is called a HypothesisHypothesis 2.2. The hypothesis starts from a proposition whichThe hypothesis starts from a proposition which is defined as a statement about a concept thatis defined as a statement about a concept that may turn out to be true or false when referredmay turn out to be true or false when referred to observable phenomena.to observable phenomena. When the proposition is suitably formulated forWhen the proposition is suitably formulated for empirical verification, we name it as aempirical verification, we name it as a hypothesis.hypothesis. 3.3. The hypothesis is a declarative tentativeThe hypothesis is a declarative tentative statement and is conjectural in nature.statement and is conjectural in nature. www.StudsPlanet.comwww.StudsPlanet.com
  • 4.
    The suggestion formulatedin theThe suggestion formulated in the hypothesis may ultimately lead to thehypothesis may ultimately lead to the solution of the problem.solution of the problem. Hypothesis relates theory to observationHypothesis relates theory to observation and observation to theory.and observation to theory. Hypothesis is a clear statement of what isHypothesis is a clear statement of what is intended to be investigated. It should beintended to be investigated. It should be specified before research is conductedspecified before research is conducted and openly stated in reporting the results.and openly stated in reporting the results. www.StudsPlanet.comwww.StudsPlanet.com
  • 5.
    It is neithertoo specific nor too general.It is neither too specific nor too general. It is considered valuable even if provenIt is considered valuable even if proven falsefalse It is a prediction of consequences.It is a prediction of consequences. A hypothesis can be directional or non-A hypothesis can be directional or non- directionaldirectional www.StudsPlanet.comwww.StudsPlanet.com
  • 6.
    HypothesisHypothesis  DefinitionDefinition A hypothesiscan be defined as aA hypothesis can be defined as a tentative explanation for certaintentative explanation for certain behaviors, phenomena or events thatbehaviors, phenomena or events that have occurred or will occur, that is ahave occurred or will occur, that is a possible outcome of the research or anpossible outcome of the research or an educated guess about the researcheducated guess about the research outcome which can be tested foroutcome which can be tested for possible acceptance.possible acceptance. www.StudsPlanet.comwww.StudsPlanet.com
  • 7.
    Types of HypothesisTypesof Hypothesis  With reference to function:With reference to function: 1.1. Descriptive hypothesisDescriptive hypothesis 2.2. Relational hypothesisRelational hypothesis www.StudsPlanet.comwww.StudsPlanet.com
  • 8.
     Descriptive hypothesisare propositionsDescriptive hypothesis are propositions that typically state the existence, size,that typically state the existence, size, form or distribution of some variable.form or distribution of some variable. Examples:Examples:  Executives stay longer time in the officeExecutives stay longer time in the office  Public enterprises are more amenablePublic enterprises are more amenable for centralised planningfor centralised planning  The educational system is not oriented toThe educational system is not oriented to human resources needs of a country.human resources needs of a country. www.StudsPlanet.comwww.StudsPlanet.com
  • 9.
     Relational hypothesisis used to describeRelational hypothesis is used to describe a relationship between two variables.a relationship between two variables.  The relation ships may be either anThe relation ships may be either an unspecified relationship or anunspecified relationship or an explanatory/casual relationshipexplanatory/casual relationship  Cause-effect relationshipCause-effect relationship www.StudsPlanet.comwww.StudsPlanet.com
  • 10.
     Relational hypothesisRelationalhypothesis 1.1. Casual Hypotheses state that the existence of,Casual Hypotheses state that the existence of, or a change in, one variable causes or leadsor a change in, one variable causes or leads to an effect on another variable: First variable -to an effect on another variable: First variable - Independent Second variable – DependentIndependent Second variable – Dependent  Examples:Examples: i.i. Families with higher incomes spend more forFamilies with higher incomes spend more for recreationrecreation ii.ii. Participative learning promotes motivationParticipative learning promotes motivation among studentsamong students www.StudsPlanet.comwww.StudsPlanet.com
  • 11.
    2.2. Correlational hypothesisCorrelationalhypothesis The unspecified relationship gives rise toThe unspecified relationship gives rise to Correlational hypotheses where theCorrelational hypotheses where the variables occur together in a specifiedvariables occur together in a specified manner without implying that one causesmanner without implying that one causes the other.the other. Example: Younger machinists are lessExample: Younger machinists are less productive than those who are older.productive than those who are older. www.StudsPlanet.comwww.StudsPlanet.com
  • 12.
     Working HypothesesWorkingHypotheses While planning the study of a problemWhile planning the study of a problem hypotheses are formed temporarilyhypotheses are formed temporarily which are referred as Workingwhich are referred as Working Hypotheses. These subject toHypotheses. These subject to modifications while research proceeds.modifications while research proceeds. 1.1. Statistical HypothesesStatistical Hypotheses 2.2. Null HypothesesNull Hypotheses www.StudsPlanet.comwww.StudsPlanet.com
  • 13.
     A researchhypothesis is a statement about theA research hypothesis is a statement about the relationship one expects to find the analysis ofrelationship one expects to find the analysis of research results.research results.  A null hypothesis is opposite of ResearchA null hypothesis is opposite of Research hypothesishypothesis  In case it is not possible to test ResearchIn case it is not possible to test Research hypothesis with the help of statistical techniqueshypothesis with the help of statistical techniques it can be transformed into another type ofit can be transformed into another type of hypothesis called Null Hypothesishypothesis called Null Hypothesis www.StudsPlanet.comwww.StudsPlanet.com
  • 14.
    Statistical HypothesesStatistical Hypotheses These are statements about statisticalThese are statements about statistical population. These are derived from apopulation. These are derived from a sample. Quantitative in nature.sample. Quantitative in nature. Ex. Group A is older than Group BEx. Group A is older than Group B www.StudsPlanet.comwww.StudsPlanet.com
  • 15.
    Null HypothesisNull Hypothesis A Null Hypothesis is the opposite of what theA Null Hypothesis is the opposite of what the researcher expectsresearcher expects  The reason for using Null Hypothesis is that itThe reason for using Null Hypothesis is that it enables to distinguish the real difference fromenables to distinguish the real difference from the observed difference due to chance only tothe observed difference due to chance only to through statistical tests.through statistical tests.  If the Null Hypothesis (Ho)is rejected, theIf the Null Hypothesis (Ho)is rejected, the research hypothesis, stated as alternativeresearch hypothesis, stated as alternative Hypothesis (HHypothesis (HA orA or HH1)1) is expected to be true.is expected to be true. www.StudsPlanet.comwww.StudsPlanet.com
  • 16.
     Level ofAbstractionLevel of Abstraction 1.1. Common-sense HypothesesCommon-sense Hypotheses 2.2. Complex HypothesesComplex Hypotheses 3.3. Analytical HypothesesAnalytical Hypotheses www.StudsPlanet.comwww.StudsPlanet.com
  • 17.
    1.1. Common-sense Hypotheses: TheseCommon-sense Hypotheses : These represent the common sense ideas.represent the common sense ideas. They state the existence of empiricalThey state the existence of empirical uniformities perceived through day touniformities perceived through day to day observationsday observations Ex: Labour in un-organised sector lackEx: Labour in un-organised sector lack motivationmotivation www.StudsPlanet.comwww.StudsPlanet.com
  • 18.
    2.2. Complex HypothesesComplexHypotheses  These aim at testing the existence ofThese aim at testing the existence of logically derived relationships betweenlogically derived relationships between empirical uniformities.empirical uniformities.  The function of such hypothesis is to createThe function of such hypothesis is to create tools and problems for further research intools and problems for further research in otherwise very complex areas ofotherwise very complex areas of investigations.investigations.  Ex: 1.Concentric growth charectarize a cityEx: 1.Concentric growth charectarize a city 2. Members of minority group suffer from2. Members of minority group suffer from oppression psychosisoppression psychosis www.StudsPlanet.comwww.StudsPlanet.com
  • 19.
    3.3. Analytical HypothesesAnalyticalHypotheses  These are concerned with relation hip of analyticalThese are concerned with relation hip of analytical variables. These hypothesis occur at the highest levelvariables. These hypothesis occur at the highest level of abstraction.of abstraction.  These specify relationship between changes in oneThese specify relationship between changes in one property and changes in another.property and changes in another.  This level of hypothesis is the most sophisticated modeThis level of hypothesis is the most sophisticated mode of formulation and contributes to the development ofof formulation and contributes to the development of ‘brilliant’ abstract theories.‘brilliant’ abstract theories.  Ex: There are two segments in India. One with higherEx: There are two segments in India. One with higher income and the other with lower income. The higherincome and the other with lower income. The higher income group have less children than the lower incomeincome group have less children than the lower income group of peoplegroup of people www.StudsPlanet.comwww.StudsPlanet.com
  • 20.
    Difference between HypothesisandDifference between Hypothesis and ProblemProblem 1.1. Problem is a questionProblem is a question and is not testable.and is not testable. 2.2. Relation betweenRelation between variable in problemvariable in problem statementstatement 3.3. Is A related to BIs A related to B 4.4. How e A and B related toHow e A and B related to C?C? 5.5. How is A related to BHow is A related to B under conditions C andunder conditions C and DD 1.1. Hypothesis is aHypothesis is a statement and can bestatement and can be testedtested 2.2. Relation betweenRelation between variables in hypothesisvariables in hypothesis 3.3. If A, then BIf A, then B 4.4. If A and B, then CIf A and B, then C 5.5. If A, then B underIf A, then B under conditions C and Dconditions C and D www.StudsPlanet.comwww.StudsPlanet.com
  • 21.
    Criteria for goodHypothesisCriteria for good Hypothesis 1.1. Must be conceptually clear, unabiguous andMust be conceptually clear, unabiguous and have explanatory powerhave explanatory power 2.2. Must have empirical referentsMust have empirical referents 3.3. Hypothesis must be exact and specific andHypothesis must be exact and specific and exact to enable its verificationexact to enable its verification 4.4. Should give insight to research questionShould give insight to research question 5.5. A good hypothesis states clearly and conciselyA good hypothesis states clearly and concisely as possible, the expected relationship oras possible, the expected relationship or difference between two variables and definesdifference between two variables and defines these variables.these variables. www.StudsPlanet.comwww.StudsPlanet.com
  • 22.
    Generation of HypothesisGenerationof Hypothesis Initial Ideas (Often vogue & general) Initial observations Search for existing literature Statement of the problem Operational definition of constructs Research Hypothesiswww.StudsPlanet.comwww.StudsPlanet.com
  • 23.
    Generation of Hypothesis InitialIdeas (Often vogue & general) Initial observations Search for existing literature Statement of the problem Operational definition of constructs Research Hypothesis www.StudsPlanet.com
  • 24.
    Sample vs. CensusTable11.1 Conditions Favoring the Use of Type of Study Sample Census 1. Budget Small Large 2. Time available Short Long 3. Population size Large Small 4. Variance in the characteristic Small Large 5. Cost of sampling errors Low High 6. Cost of nonsampling errors High Low 7. Nature of measurement Destructive Nondestructive 8. Attention to individual cases Yes Nowww.StudsPlanet.com
  • 25.
    The Sampling DesignProcess Fig. 11.1 Define the Population Determine the Sampling Frame Select Sampling Technique(s) Determine the Sample Size Execute the Sampling Process www.StudsPlanet.com
  • 26.
    Define the TargetPopulation The target population is the collection of elements or objects that possess the information sought by the researcher and about which inferences are to be made. The target population should be defined in terms of elements, sampling units, extent, and time. – An element is the object about which or from which the information is desired, e.g., the respondent. – A sampling unit is an element, or a unit containing the element, that is available for selection at some stage of the sampling process. – Extent refers to the geographical boundaries. – Time is the time period under consideration. www.StudsPlanet.com
  • 27.
    Define the TargetPopulation Important qualitative factors in determining the sample size – the importance of the decision – the nature of the research – the number of variables – the nature of the analysis – sample sizes used in similar studies – incidence rates – completion rates – resource constraints www.StudsPlanet.com
  • 28.
    Sample Sizes Usedin Marketing Research StudiesTable 11.2 Type of Study Minimum Size Typical Range Problem identification research (e.g. market potential) 500 1,000-2,500 Problem-solving research (e.g. pricing) 200 300-500 Product tests 200 300-500 Test marketing studies 200 300-500 TV, radio, or print advertising (per commercial or ad tested) 150 200-300 Test-market audits 10 stores 10-20 stores Focus groups 2 groups 4-12 groupswww.StudsPlanet.com
  • 29.
    Classification of SamplingTechniques Fig. 11.2 Sampling Techniques Nonprobability Sampling Techniques Probability Sampling Techniques Convenience Sampling Judgmental Sampling Quota Sampling Snowball Sampling Systematic Sampling Stratified Sampling Cluster Sampling Other Sampling Techniques Simple Random Sampling www.StudsPlanet.com
  • 30.
    Convenience Sampling Convenience samplingattempts to obtain a sample of convenient elements. Often, respondents are selected because they happen to be in the right place at the right time. – use of students, and members of social organizations – mall intercept interviews without qualifying the respondents – department stores using charge account lists – “people on the street” interviews www.StudsPlanet.com
  • 31.
    Judgmental Sampling Judgmental samplingis a form of convenience sampling in which the population elements are selected based on the judgment of the researcher. – test markets – purchase engineers selected in industrial marketing research – bellwether precincts selected in voting behavior research – expert witnesses used in court www.StudsPlanet.com
  • 32.
    Quota Sampling Quota samplingmay be viewed as two-stage restricted judgmental sampling. – The first stage consists of developing control categories, or quotas, of population elements. – In the second stage, sample elements are selected based on convenience or judgment. Population Sample composition composition Control Characteristic Percentage Percentage Number Sex Male 48 48 480 Female 52 52 520 ____ ____ ____ 100 100 1000 www.StudsPlanet.com
  • 33.
    Snowball Sampling In snowballsampling, an initial group of respondents is selected, usually at random. – After being interviewed, these respondents are asked to identify others who belong to the target population of interest. – Subsequent respondents are selected based on the referrals. www.StudsPlanet.com
  • 34.
    Simple Random Sampling •Each element in the population has a known and equal probability of selection. • Each possible sample of a given size (n) has a known and equal probability of being the sample actually selected. • This implies that every element is selected independently of every other element. www.StudsPlanet.com
  • 35.
    Systematic Sampling • Thesample is chosen by selecting a random starting point and then picking every ith element in succession from the sampling frame. • The sampling interval, i, is determined by dividing the population size N by the sample size n and rounding to the nearest integer. • When the ordering of the elements is related to the characteristic of interest, systematic sampling increases the representativeness of the sample. • If the ordering of the elements produces a cyclical pattern, systematic sampling may decrease the representativeness of the sample. For example, there are 100,000 elements in the population and a sample of 1,000 is desired. In this case the sampling interval, i, is 100. A random number between 1 and 100 is selected. If, for example, this number is 23, the sample consists of elements 23, 123, 223, 323, 423, 523, and so on. www.StudsPlanet.com
  • 36.
    Stratified Sampling • Atwo-step process in which the population is partitioned into subpopulations, or strata. • The strata should be mutually exclusive and collectively exhaustive in that every population element should be assigned to one and only one stratum and no population elements should be omitted. • Next, elements are selected from each stratum by a random procedure, usually SRS. • A major objective of stratified sampling is to increase precision without increasing cost. www.StudsPlanet.com
  • 37.
    Stratified Sampling • Theelements within a stratum should be as homogeneous as possible, but the elements in different strata should be as heterogeneous as possible. • The stratification variables should also be closely related to the characteristic of interest. • Finally, the variables should decrease the cost of the stratification process by being easy to measure and apply. • In proportionate stratified sampling, the size of the sample drawn from each stratum is proportionate to the relative size of that stratum in the total population. • In disproportionate stratified sampling, the size of the sample from each stratum is proportionate to the relative size of that stratum and to the standard deviation of the distribution of the characteristic of interest among all the elements in that stratum. www.StudsPlanet.com
  • 38.
    Cluster Sampling • Thetarget population is first divided into mutually exclusive and collectively exhaustive subpopulations, or clusters. • Then a random sample of clusters is selected, based on a probability sampling technique such as SRS. • For each selected cluster, either all the elements are included in the sample (one-stage) or a sample of elements is drawn probabilistically (two-stage). • Elements within a cluster should be as heterogeneous as possible, but clusters themselves should be as homogeneous as possible. Ideally, each cluster should be a small-scale representation of the population. • In probability proportionate to size sampling, the clusters are sampled with probability proportional to size. In the second stage, the probability of selecting a sampling unit in a selected cluster varies inversely with the size of the cluster. www.StudsPlanet.com
  • 39.
    Types of ClusterSamplingFig. 11.3 Cluster Sampling One-Stage Sampling Multistage Sampling Two-Stage Sampling Simple Cluster Sampling Probability Proportionate to Size Sampling www.StudsPlanet.com
  • 40.
    Technique Strengths Weaknesses Nonprobability Sampling Convenience sampling Least expensive, least time-consuming, most convenient Selection bias, sample not representative, not recommended for descriptive or causal research Judgmental sampling Low cost, convenient, not time-consuming Does not allow generalization, subjective Quota sampling Sample can be controlled for certain characteristics Selection bias, no assurance of representativeness Snowball sampling Can estimate rare characteristics Time-consuming Probability sampling Simple random sampling (SRS) Easily understood, resultsprojectable Difficult to construct sampling frame, expensive, lower precision, no assurance ofrepresentativeness. Systematic sampling Can increase representativeness, easier to implement than SRS, sampling frame not necessary Can decreaserepresentativeness Stratified sampling Include all important subpopulations, precision Difficult to select relevant stratification variables, not feasible to stratify on many variables, expensive Cluster sampling Easy to implement, cost effective Imprecise, difficult to compute and interpret results Table 11.3 Strengths and Weaknesses of Basic Sampling Techniques www.StudsPlanet.com
  • 41.
    Procedures for DrawingProbability Samples Fig. 11.4 Simple Random Sampling 1. Select a suitable sampling frame 2. Each element is assigned a number from 1 to N (pop. size) 3. Generate n (sample size) different random numbers between 1 and N 4. The numbers generated denote the elements that should be included in the sample www.StudsPlanet.com
  • 42.
    Procedures for Drawing ProbabilitySamplesFig. 11.4 cont. Systematic Sampling 1. Select a suitable sampling frame 2. Each element is assigned a number from 1 to N (pop. size) 3. Determine the sampling interval i:i=N/n. If i is a fraction, round to the nearest integer 4. Select a random number, r, between 1 and i, as explained in simple random sampling 5. The elements with the following numbers will comprise the systematic random sample: r, r+i,r+2i,r+3i,r+4i,...,r+(n-1)i www.StudsPlanet.com
  • 43.
    Choosing Nonprobability vs. ProbabilitySampling Conditions Favoring the Use of Factors Nonprobability sampling Probability sampling Nature of research Exploratory Conclusive Relative magnitude of sampling and nonsampling errors Nonsampling errors are larger Sampling errors are larger Variability in the population Homogeneous (low ) Heterogeneous (high) Statistical considerations Unfavorable Favorable Operational considerations Favorable Unfavorable Table 11.4 cont. www.StudsPlanet.com
  • 44.
    Preparing the ResearchDesign • After the formulation of the problem and hypothesis the next task is to build up a Research design to streamline the research • It determines ‘what and ‘how’ the researcher hopes to find the best solution to the problem. • Research design is about organising research activity, including collection of data in ways that are most likely to achieve the research goals and objectives. www.StudsPlanet.com
  • 45.
    • A researchdesign is a string of logic or blue print that ultimately links the data to be collected and the conclusions to be drawn to the initial questions of study. • It is a plan/blue print for conducting the proposed research work. www.StudsPlanet.com
  • 46.
    Need for aResearch Design 1. Research design systematises the research operations. 2. Advanced planning helps organising data collection which involves the availability of field staff, time and money and devising solutions for possible field problems. 3. A proper design of research study enhances the reliability of research results and minimises any error that may upset the project 4. An appropriate design helps the researcher to systematically organise his ideas in a form which enable him to locate any flaws and inadequacies and thereby prompting him to revise the research design. www.StudsPlanet.com
  • 47.
    Classification of ResearchDesign: • Common classification is according to purpose known as Basic research designs: 1. Exploratory Research Design 2. Conclusive Research Design i. Descriptive research design ii. Casual research design www.StudsPlanet.com
  • 48.
    Other types ofclassification are: • Data Collection techniques 1. Personal observation 2. Interviewing • Period of study 1. Cross sectional 2. Longitudinal • Scope of Study 1. Case studies 2. Statistical studies • Types of research questions 1. Explorative 2. Formal www.StudsPlanet.com
  • 49.
    • Study enviroment: 1.Field condition 2. Laboratory condition • Simulation 1. Control of independent variables 2. Exprimental quasi-experimental 3. Non-experimental • Participants perceptions 1. Unbiased 2. Biased www.StudsPlanet.com
  • 50.
    Basic Research Designs ResearchDesigns Exploratory Research Conclusive Research Descriptive Research Casual Research Cross-sectional Research Longitudinal Researchwww.StudsPlanet.com
  • 51.
    Exploratory research Design 1.Ex: Our sales are declining and we do not know why? 2. Discovery of ideas and insights 3. Exploratory research are useful when the researcher does not have a clear idea about the problem or may have a vague idea 4. Tend to rely more on secondary data 5. Uses both qualitative and quantitative but relies more on qualitative techniques. www.StudsPlanet.com
  • 52.
    Conclusive Research Design •This is meant to provide information that is useful in reaching conclusions or decision making • Relies both on Primary and Secondary data www.StudsPlanet.com
  • 53.
    Descriptive Research design: •Ex: What kind of people buy our product ? Who buy’s our competitors products ? Describe market charecteristics or functions • This is a statistical research providing data about the population. • It is useful for researches including population census, Industrial census, employment survey, etc. • This is a factual data as accurate as possible. www.StudsPlanet.com
  • 54.
    • Cross-sectional research:Cross sectional study calls for data for a single time. • Longitudanal study are studies which observe the state of the world without manipulating, at several points of time. www.StudsPlanet.com
  • 55.
    Casual Relationship • Ex:Would buyers prefer this new package design. • Cause and effect between two variables or more • Manipulation of one or more independent variable i. Symmetrical ii. Asymmetrical iii. Reciprocal www.StudsPlanet.com
  • 56.
    Structure of aResearch Design 1. Problem Identification 2. Problem Formulation 3. Determination of research design i. Designing measurements ii. Instruments iii. Sampling; caswetudies;etc 4. Detrmination of data collection procedures 5. Determination of analytical procedures i. Data preparation ii. Data analysis 6. Research reporting and evaluation www.StudsPlanet.com