Download to read offline
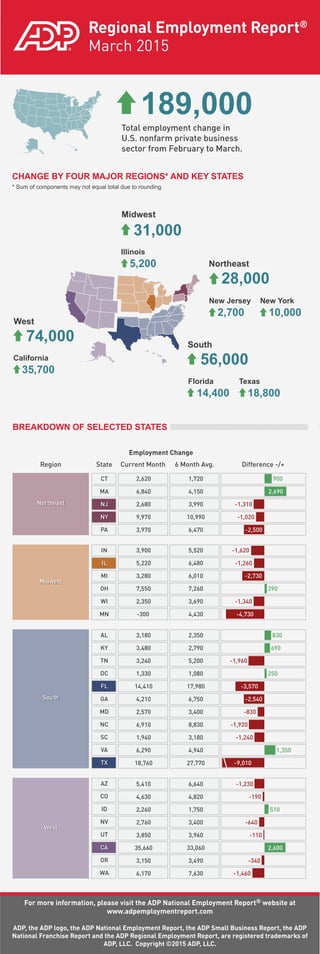

The regional employment report from March 2015 shows: - Total U.S. nonfarm private business sector employment increased by 189,000 from February to March. - The Midwest saw the largest increase in employment of 56,000 jobs, followed by the South with an increase of 74,000 jobs. - Among states, Texas saw the largest increase of 18,800 jobs while New Jersey and Illinois both added over 10,000 jobs each.


![January 2018 Real Estate Housing Market Report | Phoenix, Arizona [East Valley]](https://cdn.slidesharecdn.com/ss_thumbnails/azbsellermarketwatchreportjan2018-180116164131-thumbnail.jpg?width=640&height=640&fit=bounds)


