Download to read offline
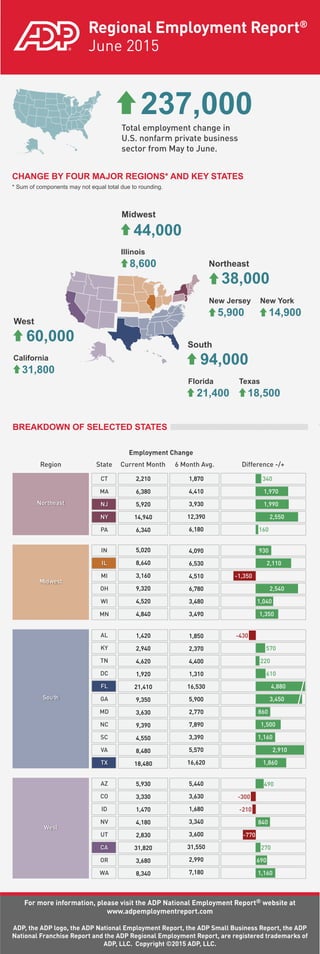

In June 2015, the U.S. nonfarm private business sector experienced a total employment change of 237,000, with regional breakdowns indicating varied employment growth across four major regions and key states. Notable changes included increases in states like Texas and California. The report emphasizes the trends and variations in employment as captured by the ADP National Employment Report.