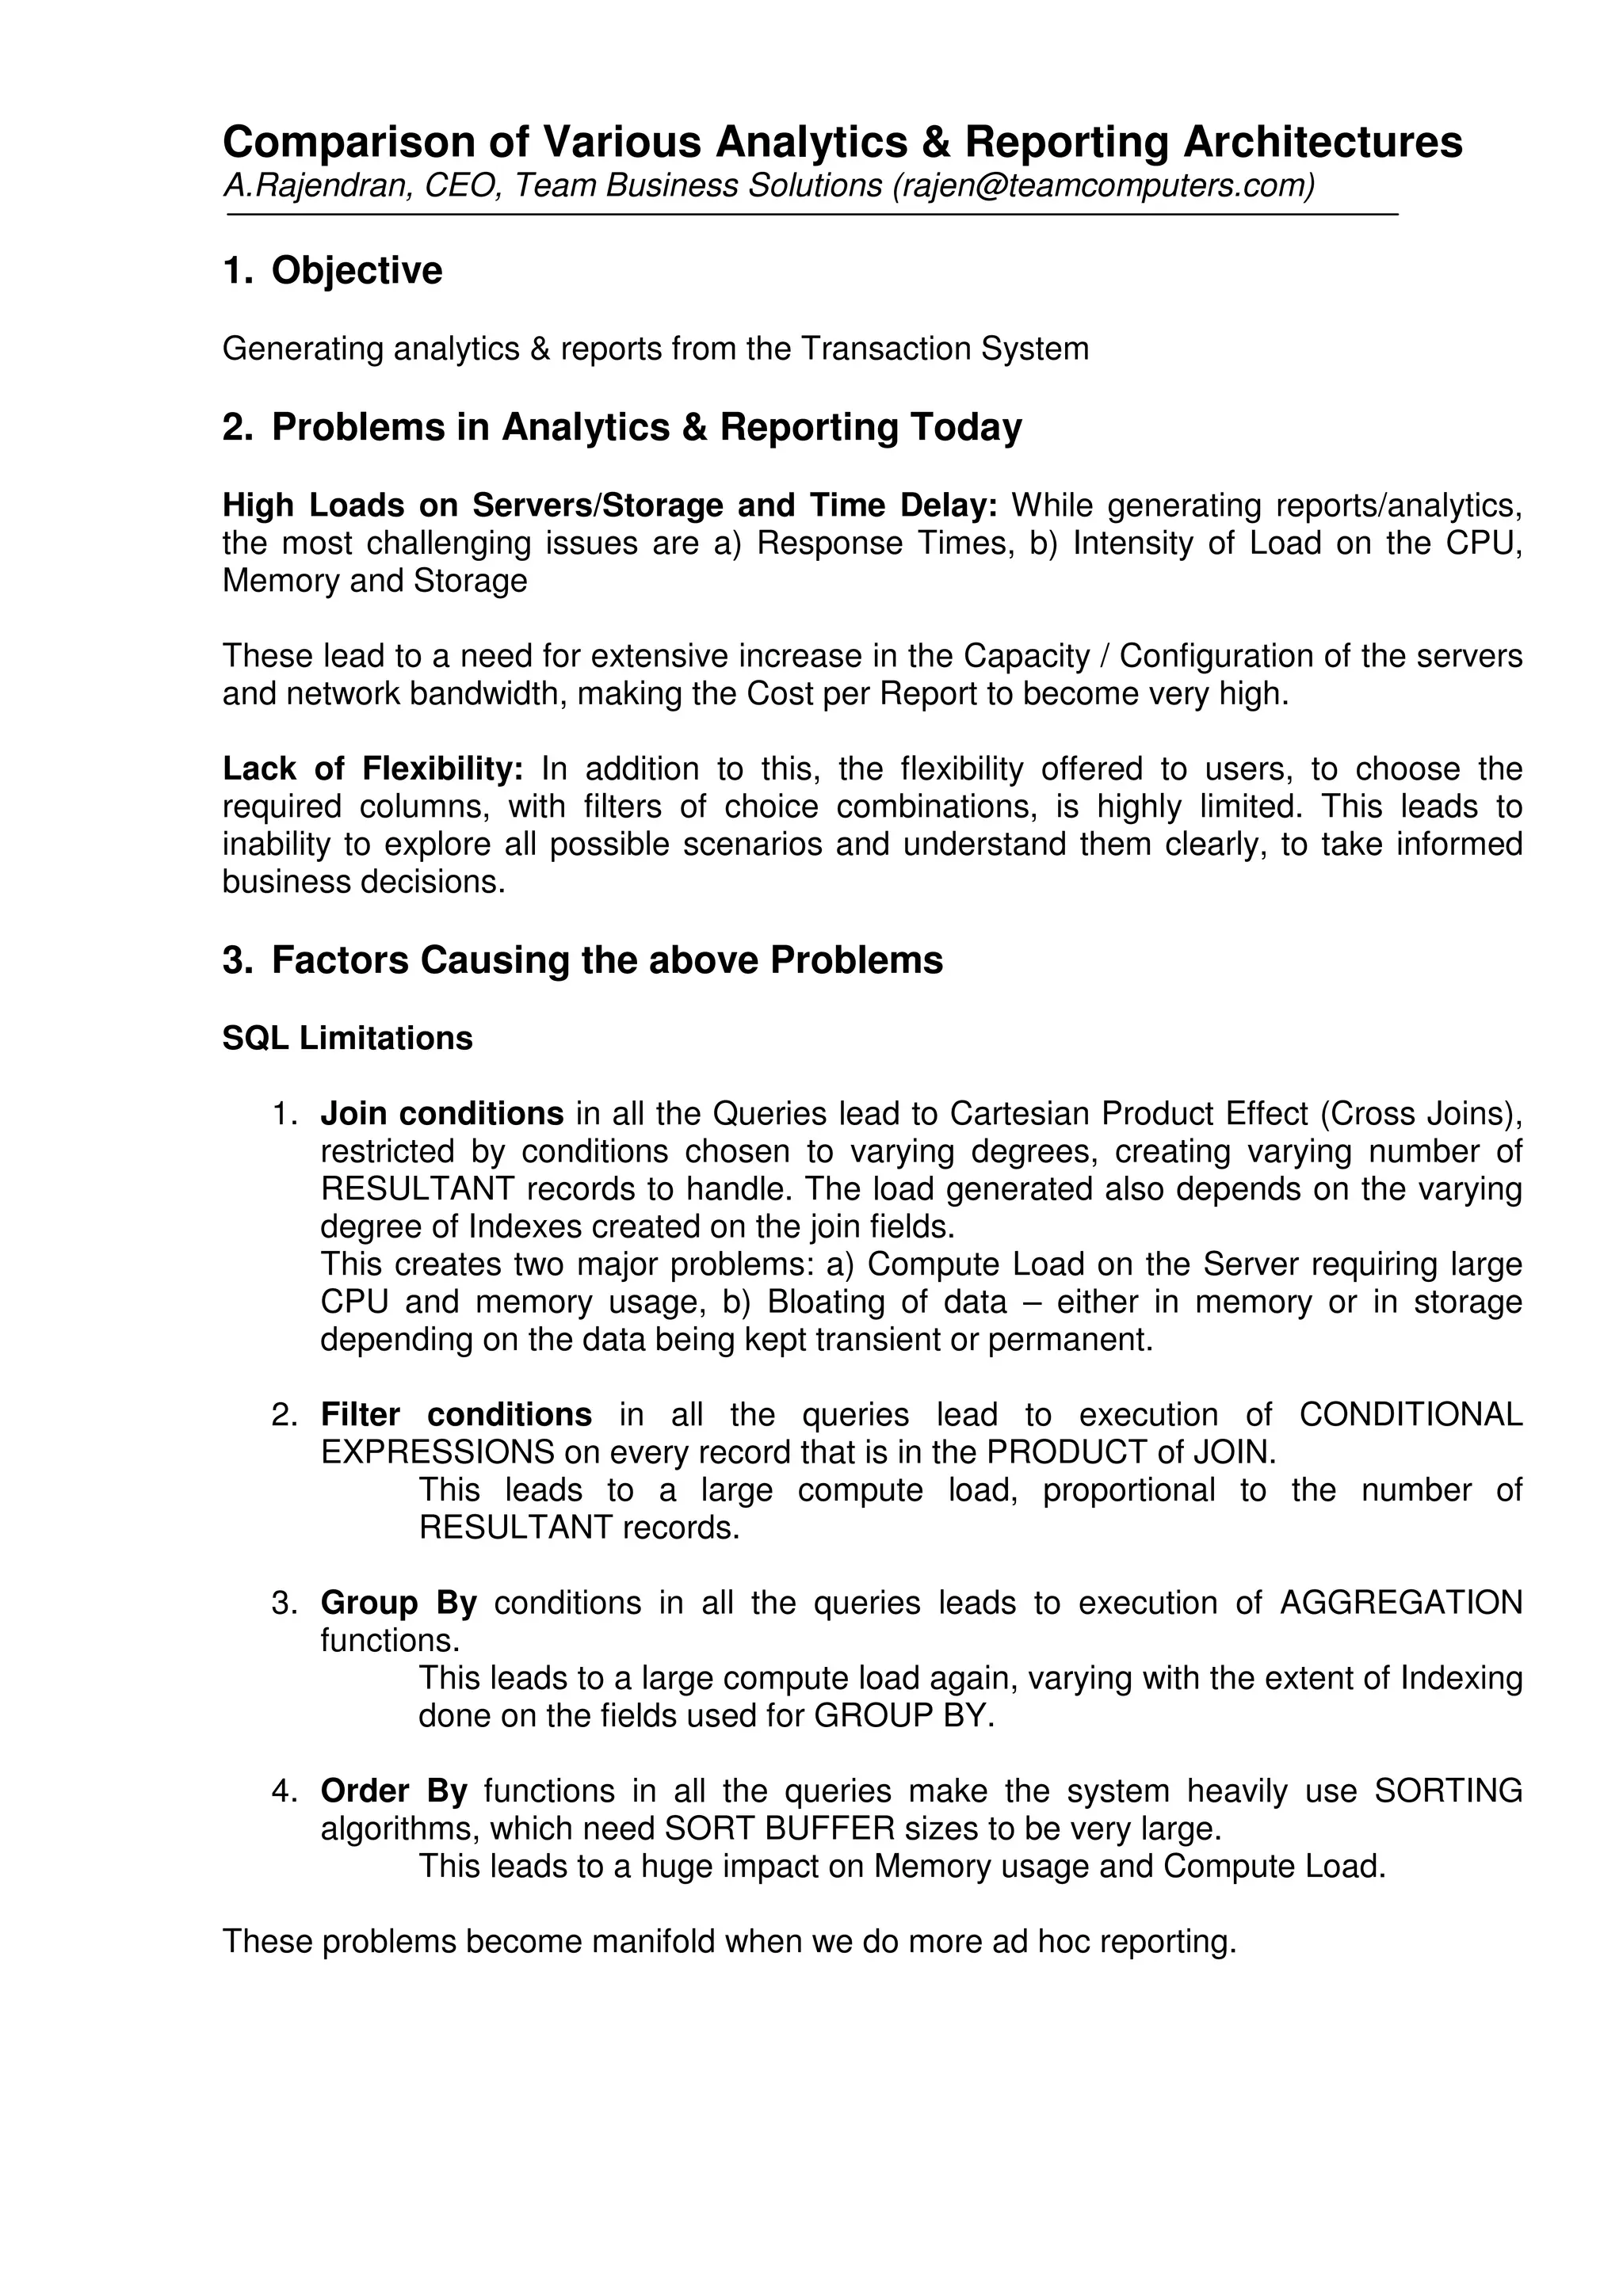
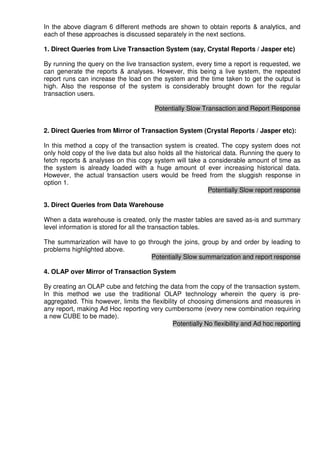
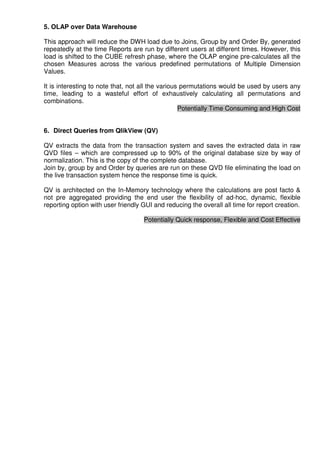
Comparison of Various Analytics & Reporting Architectures
A.Rajendran, CEO, Team Business Solutions (rajen@teamcomputers.com)

1. Objective
Generating analytics & reports from the Transaction System

2. Problems in Analytics & Reporting Today
High Loads on Servers/Storage and Time Delay: While generating reports/analytics,
the most challenging issues are a) Response Times, b) Intensity of Load on the CPU,
Memory and Storage

These lead to a need for extensive increase in the Capacity / Configuration of the servers
and network bandwidth, making the Cost per Report to become very high.

Lack of Flexibility: In addition to this, the flexibility offered to users, to choose the
required columns, with filters of choice combinations, is highly limited. This leads to
inability to explore all possible scenarios and understand them clearly, to take informed
business decisions.

3. Factors Causing the above Problems
SQL Limitations

   1. Join conditions in all the Queries lead to Cartesian Product Effect (Cross Joins),
      restricted by conditions chosen to varying degrees, creating varying number of
      RESULTANT records to handle. The load generated also depends on the varying
      degree of Indexes created on the join fields.
      This creates two major problems: a) Compute Load on the Server requiring large
      CPU and memory usage, b) Bloating of data – either in memory or in storage
      depending on the data being kept transient or permanent.

   2. Filter conditions in all the queries lead to execution of CONDITIONAL
      EXPRESSIONS on every record that is in the PRODUCT of JOIN.
             This leads to a large compute load, proportional to the number of
             RESULTANT records.

   3. Group By conditions in all the queries leads to execution of AGGREGATION
      functions.
             This leads to a large compute load again, varying with the extent of Indexing
             done on the fields used for GROUP BY.

   4. Order By functions in all the queries make the system heavily use SORTING
      algorithms, which need SORT BUFFER sizes to be very large.
              This leads to a huge impact on Memory usage and Compute Load.

These problems become manifold when we do more ad hoc reporting.
4. Various Solutions for the Problems Above
Over time, various solutions have been devised to overcome the above problems: some
of them focusing on shifting this problem to a different time than the reporting time, while
others have really made a difference in reducing the problems significantly.

The following are the various distinct approaches used in these solutions:

      1. Direct Queries from Live Transaction System (say, Crystal Reports / Jasper etc)
      2. Direct Queries from Mirror of Transaction System (Crystal Reports / Jasper etc):
      3. Direct Queries from Data Warehouse
      4. OLAP over Mirror of Transaction System
      5. OLAP over Data Warehouse
      6. Direct Queries from QlikView (QV)


Details of a Typical Sample Transaction System:
Database Size – 1 TB, Tables – 100
In the above diagram 6 different methods are shown to obtain reports & analytics, and
each of these approaches is discussed separately in the next sections.

1. Direct Queries from Live Transaction System (say, Crystal Reports / Jasper etc)

By running the query on the live transaction system, every time a report is requested, we
can generate the reports & analyses. However, this being a live system, the repeated
report runs can increase the load on the system and the time taken to get the output is
high. Also the response of the system is considerably brought down for the regular
transaction users.

                                        Potentially Slow Transaction and Report Response


2. Direct Queries from Mirror of Transaction System (Crystal Reports / Jasper etc):

In this method a copy of the transaction system is created. The copy system does not
only hold copy of the live data but also holds all the historical data. Running the query to
fetch reports & analyses on this copy system will take a considerable amount of time as
the system is already loaded with a huge amount of ever increasing historical data.
However, the actual transaction users would be freed from the sluggish response in
option 1.
                                                            Potentially Slow report response

3. Direct Queries from Data Warehouse

When a data warehouse is created, only the master tables are saved as-is and summary
level information is stored for all the transaction tables.

The summarization will have to go through the joins, group by and order by leading to
problems highlighted above.
                                   Potentially Slow summarization and report response

4. OLAP over Mirror of Transaction System

By creating an OLAP cube and fetching the data from the copy of the transaction system.
In this method we use the traditional OLAP technology wherein the query is pre-
aggregated. This however, limits the flexibility of choosing dimensions and measures in
any report, making Ad Hoc reporting very cumbersome (every new combination requiring
a new CUBE to be made).
                                              Potentially No flexibility and Ad hoc reporting
5. OLAP over Data Warehouse

This approach will reduce the DWH load due to Joins, Group by and Order By, generated
repeatedly at the time Reports are run by different users at different times. However, this
load is shifted to the CUBE refresh phase, where the OLAP engine pre-calculates all the
chosen Measures across the various predefined permutations of Multiple Dimension
Values.

It is interesting to note that, not all the various permutations would be used by users any
time, leading to a wasteful effort of exhaustively calculating all permutations and
combinations.
                                                   Potentially Time Consuming and High Cost


6. Direct Queries from QlikView (QV)

QV extracts the data from the transaction system and saves the extracted data in raw
QVD files – which are compressed up to 90% of the original database size by way of
normalization. This is the copy of the complete database.
Join by, group by and Order by queries are run on these QVD file eliminating the load on
the live transaction system hence the response time is quick.

QV is architected on the In-Memory technology where the calculations are post facto &
not pre aggregated providing the end user the flexibility of ad-hoc, dynamic, flexible
reporting option with user friendly GUI and reducing the overall all time for report creation.

                                    Potentially Quick response, Flexible and Cost Effective

Comparison of Reporting architectures

  • 1.
    Comparison of VariousAnalytics & Reporting Architectures A.Rajendran, CEO, Team Business Solutions (rajen@teamcomputers.com) 1. Objective Generating analytics & reports from the Transaction System 2. Problems in Analytics & Reporting Today High Loads on Servers/Storage and Time Delay: While generating reports/analytics, the most challenging issues are a) Response Times, b) Intensity of Load on the CPU, Memory and Storage These lead to a need for extensive increase in the Capacity / Configuration of the servers and network bandwidth, making the Cost per Report to become very high. Lack of Flexibility: In addition to this, the flexibility offered to users, to choose the required columns, with filters of choice combinations, is highly limited. This leads to inability to explore all possible scenarios and understand them clearly, to take informed business decisions. 3. Factors Causing the above Problems SQL Limitations 1. Join conditions in all the Queries lead to Cartesian Product Effect (Cross Joins), restricted by conditions chosen to varying degrees, creating varying number of RESULTANT records to handle. The load generated also depends on the varying degree of Indexes created on the join fields. This creates two major problems: a) Compute Load on the Server requiring large CPU and memory usage, b) Bloating of data – either in memory or in storage depending on the data being kept transient or permanent. 2. Filter conditions in all the queries lead to execution of CONDITIONAL EXPRESSIONS on every record that is in the PRODUCT of JOIN. This leads to a large compute load, proportional to the number of RESULTANT records. 3. Group By conditions in all the queries leads to execution of AGGREGATION functions. This leads to a large compute load again, varying with the extent of Indexing done on the fields used for GROUP BY. 4. Order By functions in all the queries make the system heavily use SORTING algorithms, which need SORT BUFFER sizes to be very large. This leads to a huge impact on Memory usage and Compute Load. These problems become manifold when we do more ad hoc reporting.
  • 2.
    4. Various Solutionsfor the Problems Above Over time, various solutions have been devised to overcome the above problems: some of them focusing on shifting this problem to a different time than the reporting time, while others have really made a difference in reducing the problems significantly. The following are the various distinct approaches used in these solutions: 1. Direct Queries from Live Transaction System (say, Crystal Reports / Jasper etc) 2. Direct Queries from Mirror of Transaction System (Crystal Reports / Jasper etc): 3. Direct Queries from Data Warehouse 4. OLAP over Mirror of Transaction System 5. OLAP over Data Warehouse 6. Direct Queries from QlikView (QV) Details of a Typical Sample Transaction System: Database Size – 1 TB, Tables – 100
  • 3.
    In the abovediagram 6 different methods are shown to obtain reports & analytics, and each of these approaches is discussed separately in the next sections. 1. Direct Queries from Live Transaction System (say, Crystal Reports / Jasper etc) By running the query on the live transaction system, every time a report is requested, we can generate the reports & analyses. However, this being a live system, the repeated report runs can increase the load on the system and the time taken to get the output is high. Also the response of the system is considerably brought down for the regular transaction users. Potentially Slow Transaction and Report Response 2. Direct Queries from Mirror of Transaction System (Crystal Reports / Jasper etc): In this method a copy of the transaction system is created. The copy system does not only hold copy of the live data but also holds all the historical data. Running the query to fetch reports & analyses on this copy system will take a considerable amount of time as the system is already loaded with a huge amount of ever increasing historical data. However, the actual transaction users would be freed from the sluggish response in option 1. Potentially Slow report response 3. Direct Queries from Data Warehouse When a data warehouse is created, only the master tables are saved as-is and summary level information is stored for all the transaction tables. The summarization will have to go through the joins, group by and order by leading to problems highlighted above. Potentially Slow summarization and report response 4. OLAP over Mirror of Transaction System By creating an OLAP cube and fetching the data from the copy of the transaction system. In this method we use the traditional OLAP technology wherein the query is pre- aggregated. This however, limits the flexibility of choosing dimensions and measures in any report, making Ad Hoc reporting very cumbersome (every new combination requiring a new CUBE to be made). Potentially No flexibility and Ad hoc reporting
  • 4.
    5. OLAP overData Warehouse This approach will reduce the DWH load due to Joins, Group by and Order By, generated repeatedly at the time Reports are run by different users at different times. However, this load is shifted to the CUBE refresh phase, where the OLAP engine pre-calculates all the chosen Measures across the various predefined permutations of Multiple Dimension Values. It is interesting to note that, not all the various permutations would be used by users any time, leading to a wasteful effort of exhaustively calculating all permutations and combinations. Potentially Time Consuming and High Cost 6. Direct Queries from QlikView (QV) QV extracts the data from the transaction system and saves the extracted data in raw QVD files – which are compressed up to 90% of the original database size by way of normalization. This is the copy of the complete database. Join by, group by and Order by queries are run on these QVD file eliminating the load on the live transaction system hence the response time is quick. QV is architected on the In-Memory technology where the calculations are post facto & not pre aggregated providing the end user the flexibility of ad-hoc, dynamic, flexible reporting option with user friendly GUI and reducing the overall all time for report creation. Potentially Quick response, Flexible and Cost Effective