This feasibility study evaluates acquiring the exclusive Renault dealership in KSA. Key points include:
- Renault has a small market share but growing product lines and a marketing strategy is proposed to reposition the brand.
- The KSA auto market is growing, especially in subcompact and compact segments. Acquiring Renault could capitalize on opportunities in growing segments.
- An analysis of Renault's past performance is presented along with sales forecasts projecting market share growth over five years if the dealership is acquired.
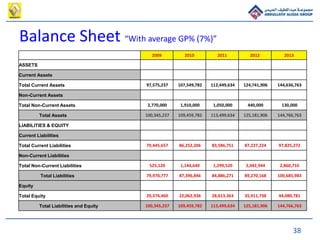
- Challenges like Renault's brand image are addressed with solutions like re-launch marketing activities. Financials and an organization chart are included.