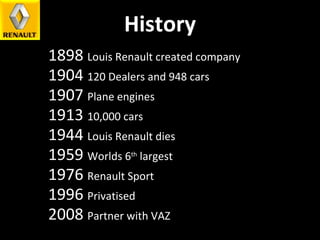
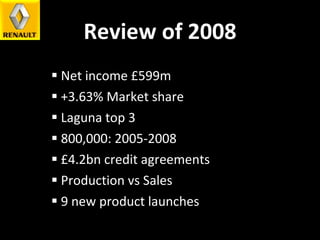
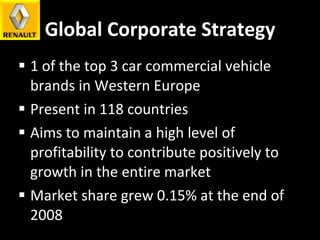
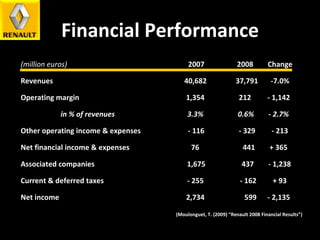
NAME: VIVEK SHARMA  M100700065
History 1898  Louis Renault created company 1904  120 Dealers and 948 cars 1907  Plane engines  1913  10,000 cars 1944  Louis Renault dies 1959  Worlds 6 th  largest 1976  Renault Sport 1996  Privatised 2008  Partner with VAZ
Mission Statement “  TO MAKE & SUSTAIN RENAULT AS THE MOST PROFITABLE AND COMPETITIVE EUROPEAN VOLUME CAR COMPANY”
Change in Renault Logos
The first Renault logo, drawn in 1900 featured the three initials of the Renault brothers: Louis, Ferdinand and Marcel. In 1906, the logo changed to a front end of a car enclosed in a gear whee Louis Renault was 21 when he made his first car in the backyard of his parent’s home. He soon got orders for cars, so in 1898, along with his brothers and friends, Louis opened the company  Société Renault Frères  in Boulogne-Billancourt, France
Review of 2008 Net income £599m +3.63% Market share Laguna top 3 800,000: 2005-2008 £4.2bn credit agreements Production vs Sales 9 new product launches
Global Corporate Strategy 1 of the top 3 car commercial vehicle brands in Western Europe Present in 118 countries  Aims to maintain a high level of profitability to contribute positively to growth in the entire market Market share grew 0.15% at the end of 2008
Vehicle Volumes By Region  (000’s) RCI BANQUE February 2009 2007 279 283 2008 Europe 2008 2007 497 447 2007 Americas 46 2008 47 43 2007 EuroMed 2008 41 Asia Africa France 2007 2008 32 40 World 2008 2007 898 858
Differentiated Premium Price Stategy Unit Cost & Unit Price (€) Low High Volume Margin for Quality Player Industry Cost Curve Premium Price Prevailing Price (Source: www.strategycompass.com, McNamee, 2004)
Product Market Portfolio MARKET PRODUCTS Sales Value (£millions) Number 1 Competitor Number 1 Competitor Sales RMS Market Growth Rate % Twingo 3,622 Astra  4,138 0.87 +2.2 Clio 3,137 Corsa 3,106 1.01 +2.6 Megane  2,872 Scirocco 2,578 1.11 +2.0 Laguna 1,587 Passat 2,384 0.67 +1.1 Espace 4,686 Picasso 3,869 1.20 +2.4 Koleos 1,247 Hilux 2,013 0.62 +3.3
Ansoff Matrix PRODUCTS New Existing Existing New MARKETS Build/protect Megane Coupe Clio Product Development Megane Renaultsport Clio Scenic  Market Development Asian Market Diversification Formula 1 Buses & HGV Electric Cars
Porters 5 Forces
STRENGTHS THREATS OPPORTUNITIES WEAKNESSES SWOT Analysis Strategic Alliance Global Operations Strong Focus on R&D Innovators Renault Brand Weak Operational   Performance Weak performance in key    markets Reliance on Western Europe Economic Climate  Competitors Fuel Fluctuations Growing Asian    Automobile  Industry  New Model launches Increasing demand for hybrid    electric vehicles
PESTEL Analysis ECONOMICAL POLITICAL LEGAL ENVIRONMENTAL TECHNOLOGICAL SOCIAL
PESTEL Analysis POLITICAL EU Emissions  Standards Product development ECONOMICAL Credit Crunch Rising Fuel Prices SOCIAL Commitment to Renault Good Code of Conduct Relations with stake-holders TECHNOLOGICAL Development & Implementation of technologies Drive these technologies ahead ENVIRONMENTAL ECO 2 Symbol Demand for HEV vehicles LEGAL Safety of vehicles Investing in R & D
Defining the Business Customers PRODUCTS First-time buyers Teens Professionals Family Fleet Twingo Clio Megane  Laguna Espace Koleos
Boston Matrix Market Growth Rate 0% 2.0 2% 4% 1.0 0.01 Relative Market Share Megane Clio Laguna Koleos Espace Twingo Stars Problem Children Cash Cows Dogs
Competitor Analysis Theory Competitor  Leader/ follower Growth rate Competition Goals Strengths Weaknesses Follower Low Severe Dominance Quality Negative perceptions of brand Leader High Severe Remain Dominant Tailored Products Bad publicity with certain product lines Follower Low Severe Growth Targets price-driven customers Identified poor after-sales service Leader High Severe Remain Dominant Partnered with BMW Safety Issues
Financial Performance (million euros) 2008 FINANCIAL RESULTS FEBRUARY 2007   2008  Change Revenues    40,682  37,791  -7.0% Operating margin    1,354  212  - 1,142 in % of revenues  3.3%  0.6%  - 2.7% Other operating income & expenses  - 116  - 329  - 213 Net financial income & expenses  76  441  + 365 Associated companies  1,675  437  - 1,238 Current & deferred taxes  - 255  - 162  + 93 Net income  2,734  599  - 2,135 (Moulonguet, T. (2009) “Renault 2008 Financial Results”)
Future performance projections Maximisation of Revenue Sources Cost Reduction Free Cash Flow Management
Review
Thank  You

Renaultpresentation 12671299877818-phpapp01

  • 1.
    NAME: VIVEK SHARMA M100700065
  • 2.
    History 1898 Louis Renault created company 1904 120 Dealers and 948 cars 1907 Plane engines 1913 10,000 cars 1944 Louis Renault dies 1959 Worlds 6 th largest 1976 Renault Sport 1996 Privatised 2008 Partner with VAZ
  • 3.
    Mission Statement “ TO MAKE & SUSTAIN RENAULT AS THE MOST PROFITABLE AND COMPETITIVE EUROPEAN VOLUME CAR COMPANY”
  • 4.
  • 5.
    The first Renaultlogo, drawn in 1900 featured the three initials of the Renault brothers: Louis, Ferdinand and Marcel. In 1906, the logo changed to a front end of a car enclosed in a gear whee Louis Renault was 21 when he made his first car in the backyard of his parent’s home. He soon got orders for cars, so in 1898, along with his brothers and friends, Louis opened the company  Société Renault Frères  in Boulogne-Billancourt, France
  • 6.
    Review of 2008Net income £599m +3.63% Market share Laguna top 3 800,000: 2005-2008 £4.2bn credit agreements Production vs Sales 9 new product launches
  • 7.
    Global Corporate Strategy1 of the top 3 car commercial vehicle brands in Western Europe Present in 118 countries Aims to maintain a high level of profitability to contribute positively to growth in the entire market Market share grew 0.15% at the end of 2008
  • 8.
    Vehicle Volumes ByRegion (000’s) RCI BANQUE February 2009 2007 279 283 2008 Europe 2008 2007 497 447 2007 Americas 46 2008 47 43 2007 EuroMed 2008 41 Asia Africa France 2007 2008 32 40 World 2008 2007 898 858
  • 9.
    Differentiated Premium PriceStategy Unit Cost & Unit Price (€) Low High Volume Margin for Quality Player Industry Cost Curve Premium Price Prevailing Price (Source: www.strategycompass.com, McNamee, 2004)
  • 10.
    Product Market PortfolioMARKET PRODUCTS Sales Value (£millions) Number 1 Competitor Number 1 Competitor Sales RMS Market Growth Rate % Twingo 3,622 Astra 4,138 0.87 +2.2 Clio 3,137 Corsa 3,106 1.01 +2.6 Megane 2,872 Scirocco 2,578 1.11 +2.0 Laguna 1,587 Passat 2,384 0.67 +1.1 Espace 4,686 Picasso 3,869 1.20 +2.4 Koleos 1,247 Hilux 2,013 0.62 +3.3
  • 11.
    Ansoff Matrix PRODUCTSNew Existing Existing New MARKETS Build/protect Megane Coupe Clio Product Development Megane Renaultsport Clio Scenic Market Development Asian Market Diversification Formula 1 Buses & HGV Electric Cars
  • 12.
  • 13.
    STRENGTHS THREATS OPPORTUNITIESWEAKNESSES SWOT Analysis Strategic Alliance Global Operations Strong Focus on R&D Innovators Renault Brand Weak Operational Performance Weak performance in key markets Reliance on Western Europe Economic Climate Competitors Fuel Fluctuations Growing Asian Automobile Industry New Model launches Increasing demand for hybrid electric vehicles
  • 14.
    PESTEL Analysis ECONOMICALPOLITICAL LEGAL ENVIRONMENTAL TECHNOLOGICAL SOCIAL
  • 15.
    PESTEL Analysis POLITICALEU Emissions Standards Product development ECONOMICAL Credit Crunch Rising Fuel Prices SOCIAL Commitment to Renault Good Code of Conduct Relations with stake-holders TECHNOLOGICAL Development & Implementation of technologies Drive these technologies ahead ENVIRONMENTAL ECO 2 Symbol Demand for HEV vehicles LEGAL Safety of vehicles Investing in R & D
  • 16.
    Defining the BusinessCustomers PRODUCTS First-time buyers Teens Professionals Family Fleet Twingo Clio Megane Laguna Espace Koleos
  • 17.
    Boston Matrix MarketGrowth Rate 0% 2.0 2% 4% 1.0 0.01 Relative Market Share Megane Clio Laguna Koleos Espace Twingo Stars Problem Children Cash Cows Dogs
  • 18.
    Competitor Analysis TheoryCompetitor Leader/ follower Growth rate Competition Goals Strengths Weaknesses Follower Low Severe Dominance Quality Negative perceptions of brand Leader High Severe Remain Dominant Tailored Products Bad publicity with certain product lines Follower Low Severe Growth Targets price-driven customers Identified poor after-sales service Leader High Severe Remain Dominant Partnered with BMW Safety Issues
  • 19.
    Financial Performance (millioneuros) 2008 FINANCIAL RESULTS FEBRUARY 2007 2008 Change Revenues 40,682 37,791 -7.0% Operating margin 1,354 212 - 1,142 in % of revenues 3.3% 0.6% - 2.7% Other operating income & expenses - 116 - 329 - 213 Net financial income & expenses 76 441 + 365 Associated companies 1,675 437 - 1,238 Current & deferred taxes - 255 - 162 + 93 Net income 2,734 599 - 2,135 (Moulonguet, T. (2009) “Renault 2008 Financial Results”)
  • 20.
    Future performance projectionsMaximisation of Revenue Sources Cost Reduction Free Cash Flow Management
  • 21.
  • 22.