This document provides an overview of remote sensing and its applications in fruit crops. It discusses the basic principles and components of remote sensing, including electromagnetic radiation, sensors, platforms, spectral signatures, and image resolution. It also describes different types of remote sensing based on energy source and wavelength. Several satellite imaging systems and software for analyzing remote sensing data are mentioned. The document outlines how remote sensing can be used to monitor fruit orchards over large areas for applications such as yield estimation, disease detection, and recommending fertilizer doses. Remote sensing is presented as a cost-effective way to gather information over large areas compared to traditional ground-based monitoring.
Remote Sensing and its Applications in AgricultureVikas Kashyap
Here is a presentation prepared by me on Remote sensing and its Applications in agriculture. This presentation created after studying many regarding websites, articles and research papers. Thank You
Introduction -Remote means – far away ; Sensing means – believing or observing or acquiring some information.
Remote sensing means acquiring information of things from a distance with sensors. (without touching the things)
Sensors are like simple cameras except that they not only use visible light but also other bands of the electromagnetic spectrum such as infrared, microwaves and ultraviolet regions.
Distance of Remote Sensing, Definition of remote sensing - Remote Sensing is:
“The art and science of obtaining information about an object without being in direct contact with the object” (Jensen 2000).
India’s National Remote Sensing Agency (NRSA) defined as : “Remote sensing is the technique of deriving information about objects on the surface of the earth without physically coming into contact with them.”
Remote Sensing Process, - (A) Energy Source or Illumination.
(B) Radiation and the Atmosphere.
(C) Interaction with the Target.
(D) Recording of Energy by the Sensor.
(E) Transmission, Reception, & Processing.
(F) Interpretation and Analysis.
(G) Application.
Remote sensing platforms , History of Remote Sensing, Applications of remote sensing - In Agriculture, In Geology, Applications of National Priority.
Application of remote sensing in forest ecosystemaliya nasir
Established remote sensing systems provide opportunities to develop and apply new measurements of ecosystem function across landscapes, regions and continents.
New efforts to predict the consequences of ecosystem function change, both natural and human- induced, on the regional and global distributions and abundances of species should be a high research priority
Remote sensing in plants, botany, application in vegetation classification and conservation, basic mechanism of remote sensing,how it works, satellite mapping techniques and aerial mapping
Remote sensing application in agriculture & forestry_Dr Menon A R R (The Kera...India Water Portal
This presentation by Dr A R R Menon, Emeritus scientist, CED on Remote Sensing applications in agriculture and forestry was made at at the Kerala Environment Congress, Trivandrum organised by the Centre for Environment and Development
Remote Sensing Applications in Agriculture in PakistanGhulam Asghar
"Remote sensing is the science of acquiring, processing, and Interpreting images and related data without physical contact with object that are obtained from ground based, air or space-borne instruments that record the interaction between target and electromagnetic radiation."
Remote Sensing - A tool of plant disease managementAnand Choudhary
Definition, history , type of remote sensing, plateform used in remote sensing, type of resolution used in sensor, objective of remote sensing in plant disease management
Application of Remote Sensing in AgricultureUTTAM KUMAR
Remote sensing has been found to be a valuable tool in evaluation, monitoring and management of land, water and crop resources. The launching of the Indian remote sensing satellite (IRS) has enhanced the capabilities for better utilization of this technology and significant progress has been made in soil and land cover mapping, land degradation studies, monitoring of waste land, assessment of crop conditions crop acreage and production estimates
Optical and Microwave Remote Sensing for Crop Monitoring in MexicoCIMMYT
Remote sensing –Beyond images
Mexico 14-15 December 2013
The workshop was organized by CIMMYT Global Conservation Agriculture Program (GCAP) and funded by the Bill & Melinda Gates Foundation (BMGF), the Mexican Secretariat of Agriculture, Livestock, Rural Development, Fisheries and Food (SAGARPA), the International Maize and Wheat Improvement Center (CIMMYT), CGIAR Research Program on Maize, the Cereal System Initiative for South Asia (CSISA) and the Sustainable Modernization of the Traditional Agriculture (MasAgro)
APPLICATION OF REMOTE SENSING AND GIS IN AGRICULTURELagnajeetRoy
India is a country that depends on agriculture. Today in this era of technological supremacy, agriculture is also using different new technologies like some robotic machinery to remote sensing and Geographical Information System (GIS) for the betterment of agriculture. It is easy to get the information about that area where human cannot check the condition everyday and help in gathering the data with the help of remote sensing. Whereas GIS helps in preparation of map that shows an accurate representation of data we get through remote sensing. From disease estimation to stress factor due to water, from ground water quality index to acreage estimation in various way agriculture is being profited by the application of remote sensing and GIS in agriculture. The applications of those software or techniques are very new to the agriculture domain still much more exploration is needed in this part. New software’s are developing in different parts of the world and remote sensing. Today farmers understand the beneficiaries of these kinds of techniques to the farm field which help in increasing productivity that will help future generation as technology is hype in traditional system of farming.
In India, agriculture is one of the major application areas of the remote sensing technology. Various national level agricultural applications have been developed which showcases the use of remote sensing data provided by the sensors/satellites launched by the country’s space agency, Indian Space Research Organisation (ISRO)
To meet the various information requirements in forest management, different data sources like field survey, aerial photography, and satellite imagery is used, depending on the level of detail required and the extension of the area under study.
Remote sensing and aerial photography study notes. Including concept and history of RS, visual image interpretation, digital image interpretation, application of RS, digital imaging, application of remote sensing etc.
This is all about remote sensing. Remote sensing is the acquisition of information about an object or phenomenon without making physical contact with the object and thus in contrast to on-site observation, especially the Earth.Remote sensing is the process of detecting and monitoring the physical characteristics of an area by measuring its reflected and emitted radiation at a distance from the targeted area. Special cameras collect remotely sensed imagesof the Earth, which help researchers "sense" things about the Earth.
Element Of Civil Engineering and surveying subject as per GTU syllabus 1st sem carry out all content. also usefull for general idea about civil branch.
PHP Frameworks: I want to break free (IPC Berlin 2024)Ralf Eggert
In this presentation, we examine the challenges and limitations of relying too heavily on PHP frameworks in web development. We discuss the history of PHP and its frameworks to understand how this dependence has evolved. The focus will be on providing concrete tips and strategies to reduce reliance on these frameworks, based on real-world examples and practical considerations. The goal is to equip developers with the skills and knowledge to create more flexible and future-proof web applications. We'll explore the importance of maintaining autonomy in a rapidly changing tech landscape and how to make informed decisions in PHP development.
This talk is aimed at encouraging a more independent approach to using PHP frameworks, moving towards a more flexible and future-proof approach to PHP development.
GDG Cloud Southlake #33: Boule & Rebala: Effective AppSec in SDLC using Deplo...James Anderson
Effective Application Security in Software Delivery lifecycle using Deployment Firewall and DBOM
The modern software delivery process (or the CI/CD process) includes many tools, distributed teams, open-source code, and cloud platforms. Constant focus on speed to release software to market, along with the traditional slow and manual security checks has caused gaps in continuous security as an important piece in the software supply chain. Today organizations feel more susceptible to external and internal cyber threats due to the vast attack surface in their applications supply chain and the lack of end-to-end governance and risk management.
The software team must secure its software delivery process to avoid vulnerability and security breaches. This needs to be achieved with existing tool chains and without extensive rework of the delivery processes. This talk will present strategies and techniques for providing visibility into the true risk of the existing vulnerabilities, preventing the introduction of security issues in the software, resolving vulnerabilities in production environments quickly, and capturing the deployment bill of materials (DBOM).
Speakers:
Bob Boule
Robert Boule is a technology enthusiast with PASSION for technology and making things work along with a knack for helping others understand how things work. He comes with around 20 years of solution engineering experience in application security, software continuous delivery, and SaaS platforms. He is known for his dynamic presentations in CI/CD and application security integrated in software delivery lifecycle.
Gopinath Rebala
Gopinath Rebala is the CTO of OpsMx, where he has overall responsibility for the machine learning and data processing architectures for Secure Software Delivery. Gopi also has a strong connection with our customers, leading design and architecture for strategic implementations. Gopi is a frequent speaker and well-known leader in continuous delivery and integrating security into software delivery.
Epistemic Interaction - tuning interfaces to provide information for AI supportAlan Dix
Paper presented at SYNERGY workshop at AVI 2024, Genoa, Italy. 3rd June 2024
https://alandix.com/academic/papers/synergy2024-epistemic/
As machine learning integrates deeper into human-computer interactions, the concept of epistemic interaction emerges, aiming to refine these interactions to enhance system adaptability. This approach encourages minor, intentional adjustments in user behaviour to enrich the data available for system learning. This paper introduces epistemic interaction within the context of human-system communication, illustrating how deliberate interaction design can improve system understanding and adaptation. Through concrete examples, we demonstrate the potential of epistemic interaction to significantly advance human-computer interaction by leveraging intuitive human communication strategies to inform system design and functionality, offering a novel pathway for enriching user-system engagements.
JMeter webinar - integration with InfluxDB and GrafanaRTTS
Watch this recorded webinar about real-time monitoring of application performance. See how to integrate Apache JMeter, the open-source leader in performance testing, with InfluxDB, the open-source time-series database, and Grafana, the open-source analytics and visualization application.
In this webinar, we will review the benefits of leveraging InfluxDB and Grafana when executing load tests and demonstrate how these tools are used to visualize performance metrics.
Length: 30 minutes
Session Overview
-------------------------------------------
During this webinar, we will cover the following topics while demonstrating the integrations of JMeter, InfluxDB and Grafana:
- What out-of-the-box solutions are available for real-time monitoring JMeter tests?
- What are the benefits of integrating InfluxDB and Grafana into the load testing stack?
- Which features are provided by Grafana?
- Demonstration of InfluxDB and Grafana using a practice web application
To view the webinar recording, go to:
https://www.rttsweb.com/jmeter-integration-webinar
Smart TV Buyer Insights Survey 2024 by 91mobiles.pdf91mobiles
91mobiles recently conducted a Smart TV Buyer Insights Survey in which we asked over 3,000 respondents about the TV they own, aspects they look at on a new TV, and their TV buying preferences.
LF Energy Webinar: Electrical Grid Modelling and Simulation Through PowSyBl -...DanBrown980551
Do you want to learn how to model and simulate an electrical network from scratch in under an hour?
Then welcome to this PowSyBl workshop, hosted by Rte, the French Transmission System Operator (TSO)!
During the webinar, you will discover the PowSyBl ecosystem as well as handle and study an electrical network through an interactive Python notebook.
PowSyBl is an open source project hosted by LF Energy, which offers a comprehensive set of features for electrical grid modelling and simulation. Among other advanced features, PowSyBl provides:
- A fully editable and extendable library for grid component modelling;
- Visualization tools to display your network;
- Grid simulation tools, such as power flows, security analyses (with or without remedial actions) and sensitivity analyses;
The framework is mostly written in Java, with a Python binding so that Python developers can access PowSyBl functionalities as well.
What you will learn during the webinar:
- For beginners: discover PowSyBl's functionalities through a quick general presentation and the notebook, without needing any expert coding skills;
- For advanced developers: master the skills to efficiently apply PowSyBl functionalities to your real-world scenarios.
Software Delivery At the Speed of AI: Inflectra Invests In AI-Powered QualityInflectra
In this insightful webinar, Inflectra explores how artificial intelligence (AI) is transforming software development and testing. Discover how AI-powered tools are revolutionizing every stage of the software development lifecycle (SDLC), from design and prototyping to testing, deployment, and monitoring.
Learn about:
• The Future of Testing: How AI is shifting testing towards verification, analysis, and higher-level skills, while reducing repetitive tasks.
• Test Automation: How AI-powered test case generation, optimization, and self-healing tests are making testing more efficient and effective.
• Visual Testing: Explore the emerging capabilities of AI in visual testing and how it's set to revolutionize UI verification.
• Inflectra's AI Solutions: See demonstrations of Inflectra's cutting-edge AI tools like the ChatGPT plugin and Azure Open AI platform, designed to streamline your testing process.
Whether you're a developer, tester, or QA professional, this webinar will give you valuable insights into how AI is shaping the future of software delivery.
Essentials of Automations: Optimizing FME Workflows with ParametersSafe Software
Are you looking to streamline your workflows and boost your projects’ efficiency? Do you find yourself searching for ways to add flexibility and control over your FME workflows? If so, you’re in the right place.
Join us for an insightful dive into the world of FME parameters, a critical element in optimizing workflow efficiency. This webinar marks the beginning of our three-part “Essentials of Automation” series. This first webinar is designed to equip you with the knowledge and skills to utilize parameters effectively: enhancing the flexibility, maintainability, and user control of your FME projects.
Here’s what you’ll gain:
- Essentials of FME Parameters: Understand the pivotal role of parameters, including Reader/Writer, Transformer, User, and FME Flow categories. Discover how they are the key to unlocking automation and optimization within your workflows.
- Practical Applications in FME Form: Delve into key user parameter types including choice, connections, and file URLs. Allow users to control how a workflow runs, making your workflows more reusable. Learn to import values and deliver the best user experience for your workflows while enhancing accuracy.
- Optimization Strategies in FME Flow: Explore the creation and strategic deployment of parameters in FME Flow, including the use of deployment and geometry parameters, to maximize workflow efficiency.
- Pro Tips for Success: Gain insights on parameterizing connections and leveraging new features like Conditional Visibility for clarity and simplicity.
We’ll wrap up with a glimpse into future webinars, followed by a Q&A session to address your specific questions surrounding this topic.
Don’t miss this opportunity to elevate your FME expertise and drive your projects to new heights of efficiency.
UiPath Test Automation using UiPath Test Suite series, part 3DianaGray10
Welcome to UiPath Test Automation using UiPath Test Suite series part 3. In this session, we will cover desktop automation along with UI automation.
Topics covered:
UI automation Introduction,
UI automation Sample
Desktop automation flow
Pradeep Chinnala, Senior Consultant Automation Developer @WonderBotz and UiPath MVP
Deepak Rai, Automation Practice Lead, Boundaryless Group and UiPath MVP
How world-class product teams are winning in the AI era by CEO and Founder, P...
Remote sensing in fruit crops
1. ~ 2479 ~
Journal of Pharmacognosy and Phytochemistry 2017; 6(5): 2479-2484
E-ISSN: 2278-4136
P-ISSN: 2349-8234
JPP 2017; 6(5): 2479-2484
Received: 14-07-2017
Accepted: 15-08-2017
Deepa U Pujar
University of Horticultural
Sciences, Bagalkot, Karnataka,
India
Udachappa U Pujar
University of Horticultural
Sciences, Bagalkot, Karnataka,
India
Shruthi CR
University of Horticultural
Sciences, Bagalkot, Karnataka,
India
Anuradha Wadagave
University of Horticultural
Sciences, Bagalkot, Karnataka,
India
Madhu Chulaki
University of Horticultural
Sciences, Bagalkot, Karnataka,
India
Correspondence
Deepa U Pujar
University of Horticultural
Sciences, Bagalkot, Karnataka,
India
Remote sensing in fruit crops
Deepa U Pujar, Udachappa U Pujar, Shruthi CR, Anuradha Wadagave
and Madhu Chulaki
Abstract
Horticultural crops, especially fruit crops play a significant role in the food and nutritional security of the
country. Hence, it is necessary to increase both production and quality. For enhancing fruit production,
frequent monitoring of orchard is essential which is highly difficult because of large area coverage.
Remote sensing is one of the emerging advanced technologies to gather accurate information on many
parameters required for horticultural sector especially fruit crops over large area.
Keywords: Remote sensing, fruit crops, Horticultural crops, radiation
Introduction
Definition: It is process of obtaining information about land, water, or an object without any
physical contact between the sensor and the subject of analysis (Remote – Not in contact with
an object and Sensing – Getting information). Or it is the measurement or acquisition of
information of some property of an object or phenomena by a recording device that is not in
physical or intimate contact with the object or phenomena under study.
‘’Remote sensing is teaching us a new way of seeing".
Remote sensing is a multidisciplinary approach which includes different sciences such as,
optics, spectroscopy, computer, satellite launching, photography and electronics. Basic
knowledge of all these science is very important and it is being used in applications of remote
sensing.
History: In ancient India apparently had a clear concept of remote sensing. For instance epic
‘Maha Bharata’ Sanjaya had been endowed, presumably with some equipment which enabled
him to report (in real time) all the events at the distant “Kurukshetra” battle field, whether they
were open or camouflaged and occurred in day or by night. History of remote sensing goes
back to 18th
century. In recent times, Frenchman Mr. Tournachen took photographs for the first
time from a balloon which floated over Paris in 1858. Earlier pigeons were used as a platform
for getting information (1800) later in 1859 first time photography was taken from parachute
and in 1909 from airplane. William Maxwell in 1873, he invented theory of electromagnetic
spectrum (basic of remote sensing). In 1960 first TIROS meteorological satellite was launched
later on landsat was launched. The term “Remote sensing” was first used in 1961 when U.S.
Naval project on the study of aerial photographs was renamed as “remote sensing”. The
application of remote sensing technology to agriculture and forestry was presented in couple of
papers in 1968 at the occasion of U.N. conference on peaceful uses of on the space uses and
the first satellite in remote sensing technology was launched in July 1972 in U.S.A. In India
the remote sensing activities were initiated in 1969. After 2000s onwards work on high
resolution data and development of hyperspectral sensors were going on.
Principle: Different objects based on their structural, chemical and physical properties reflect
or emit different amount of energy in different wave length ranges of the electromagnetic
spectrum. When a radiation falls on any object (ex. red and green apple) emits radiation in the
form of electromagnetic spectrum (which carries some information about that object). These
radiations are very specific to their objects and that dictates properties of object. For example,
here both red and green apple emit their own pattern of radiation by which we can able to
discriminate between red and green apple in terms of their color, condition and shape. Same
principle is being used in remote sensing also, when radiation falls on object it emits their own
pattern of radiation that radiation was detected by sensors.
2.
~ 2480 ~
Journal of Pharmacognosy and Phytochemistry
Sensors: These are the device that receive electromagnetic
radiation and converts it into signal that can be recorded or
displayed as either numerical data or an image. There are
many types of sensors are there, those are
1. Microwave radiometer
2. Gravimeter
3. Spectrometer
4. Camera
5. Solid scanner
6. Optical mechanical scanner
7. Laser water depth meter
8. Laser distance meter
9. Radar
10. Satellites also act as a sensor
Remote sensing platforms: There are 3 types of platforms
based on altitude (Fig.1) on which information about objects
were obtained. They are
1. Ground based: Here distance between sensors and objects
will be up to 50 meters. Ex: Aerial vehicle
2. Airplane based: Here distance between sensors and
objects will be up to 50 km. Ex: Parachote, Airplane and
Helicopter
3. Space based: This is done at higher altitude of about100-
36000 km.Ex: Satellite, Rockets and Shuttle
Fig 1: Remote sensing platforms at different altitude.
Basics of remote sensing
1. Electromagnetic spectrum: EMS is an array of
electromagnetic radiation as a function of wavelength.
Shortest waves are gamma rays and longest waves radio
waves. Longer the wavelength stronger will be the
transmittance (Fig. 2).
Fig 2: Electromagnetic spectrum
Understanding of different electromagnetic waves is very
important to know about object and its properties based on
reflected radiation. In different condition viz., high
temperature, stress condition, drought stress etc different
radiations with varied wavelength will emit which carries
information about objects.
A. Wavelength: It is a distance between consecutive crest
and trough.
B. Frequency: Number of wave cycles completed per unit
time per unit distance (Fig. 3).
Fig 3: Frequency and wavelength of radiations
Radition taget (object) interaction: When radiation falls on
object, there will be three interactions takes place between
radiation and object. Those are
1. Transmittance- Incident radiation will transmit through
object or target. This radiation is of no use.
2. Absorption- When radiation falls on target it is absorbed
into the target. It is also of no use.
3. Reflection- When radiation falls on target it is reflected
from target and revert back its direction. This radiation is
perceived by sensor and informaton will be analysed.
Only this radiation is used in remote sensing technique.
Radiation atmosphere interaction: There are three
interaction are there. It happens only when satellite used as
platform where radiation has to be interact with atmospheric
layer.
1. Scattering- Radiations were scattered by atmospheric
constituents such as ozone, CO2 and water vapor.
2. Absorption- Radiations are absorbed into atmospheric
constituents.
3. Transmittance- Radiations are transmitted through
atmospheric layer.
Amoong these interactions scattered and absorbed radiations
were not used in remote sensing. But transmitted radiation
will be carrying some information about object that can be
received by sensor for getting information. So, we should
select radiations in such a way that it should be strongly
transmissible through atmospheric layer without absorption
and scattering.
Atmospheric Windows: These are the radiations (areas of
the spectrum) which are not severly influenced by
atmospheric absorption and which are useful to remote
sensors, are called as atmospheric windows (Table 1).
3.
~ 2481 ~
Journal of Pharmacognosy and Phytochemistry
Table 1: Major Atmospheric Windows-
Radiations Wavelength
UV and VIS 0.30-0.75 µm
Near Infrared
0.77-0.91 µm
1.55-1.75 µm
2.05-2.40 µm
Thermal Infrared
8.00-9.20 µm
10.2-12.4 µm
Microwave(Radar)
7.5-11.5mm
20.00+ mm
These are some radiations are atmospheric windows which
are not either bsorbed or scattered by atmosphere. These can
be used in remote sensing technology.
Spectral Signature: Any Remotely sensed parameter, which
directly or indirectly characterizes the nature and or condition
of the object under observation, as defined as spectral
signature. Hence, it is the ratio of reflected energy to incident
energy as a function.
ρ(λ) = [ER(λ) / EI(λ)] x 100ρ
(λ) = Spectral reflectance (reflectivity) at a particular
wavelength.
ER (λ) = Energy of wavelength reflected from object
EI (λ) = Energy of wavelength incident upon the object
Resolution: The smallest measurable/observable difference.
It measures clearance of image or information. There are four
type of resolutions.
1. Spectral resolution: Part of EMS measured.Single image
aws taken with different spectral bands for getting higher
accuracy.
2. Radiometric resolution: Smallest difference in energy that
can be measured. Single image is taken with single
wavelength at different intensities (8-14 bit).
3. Sptial resolution: Smallest unit area measured.Ability of
senor to resolve two adjecent things as separate or
distinct.
4. Temporal resolution: Time between two successive image
aqusition over same area. EX.Landsat- temporal
resolution 18 days (takes observation once in 18 days).
IRS satellite – 5 days (takes observation once in 5 days)
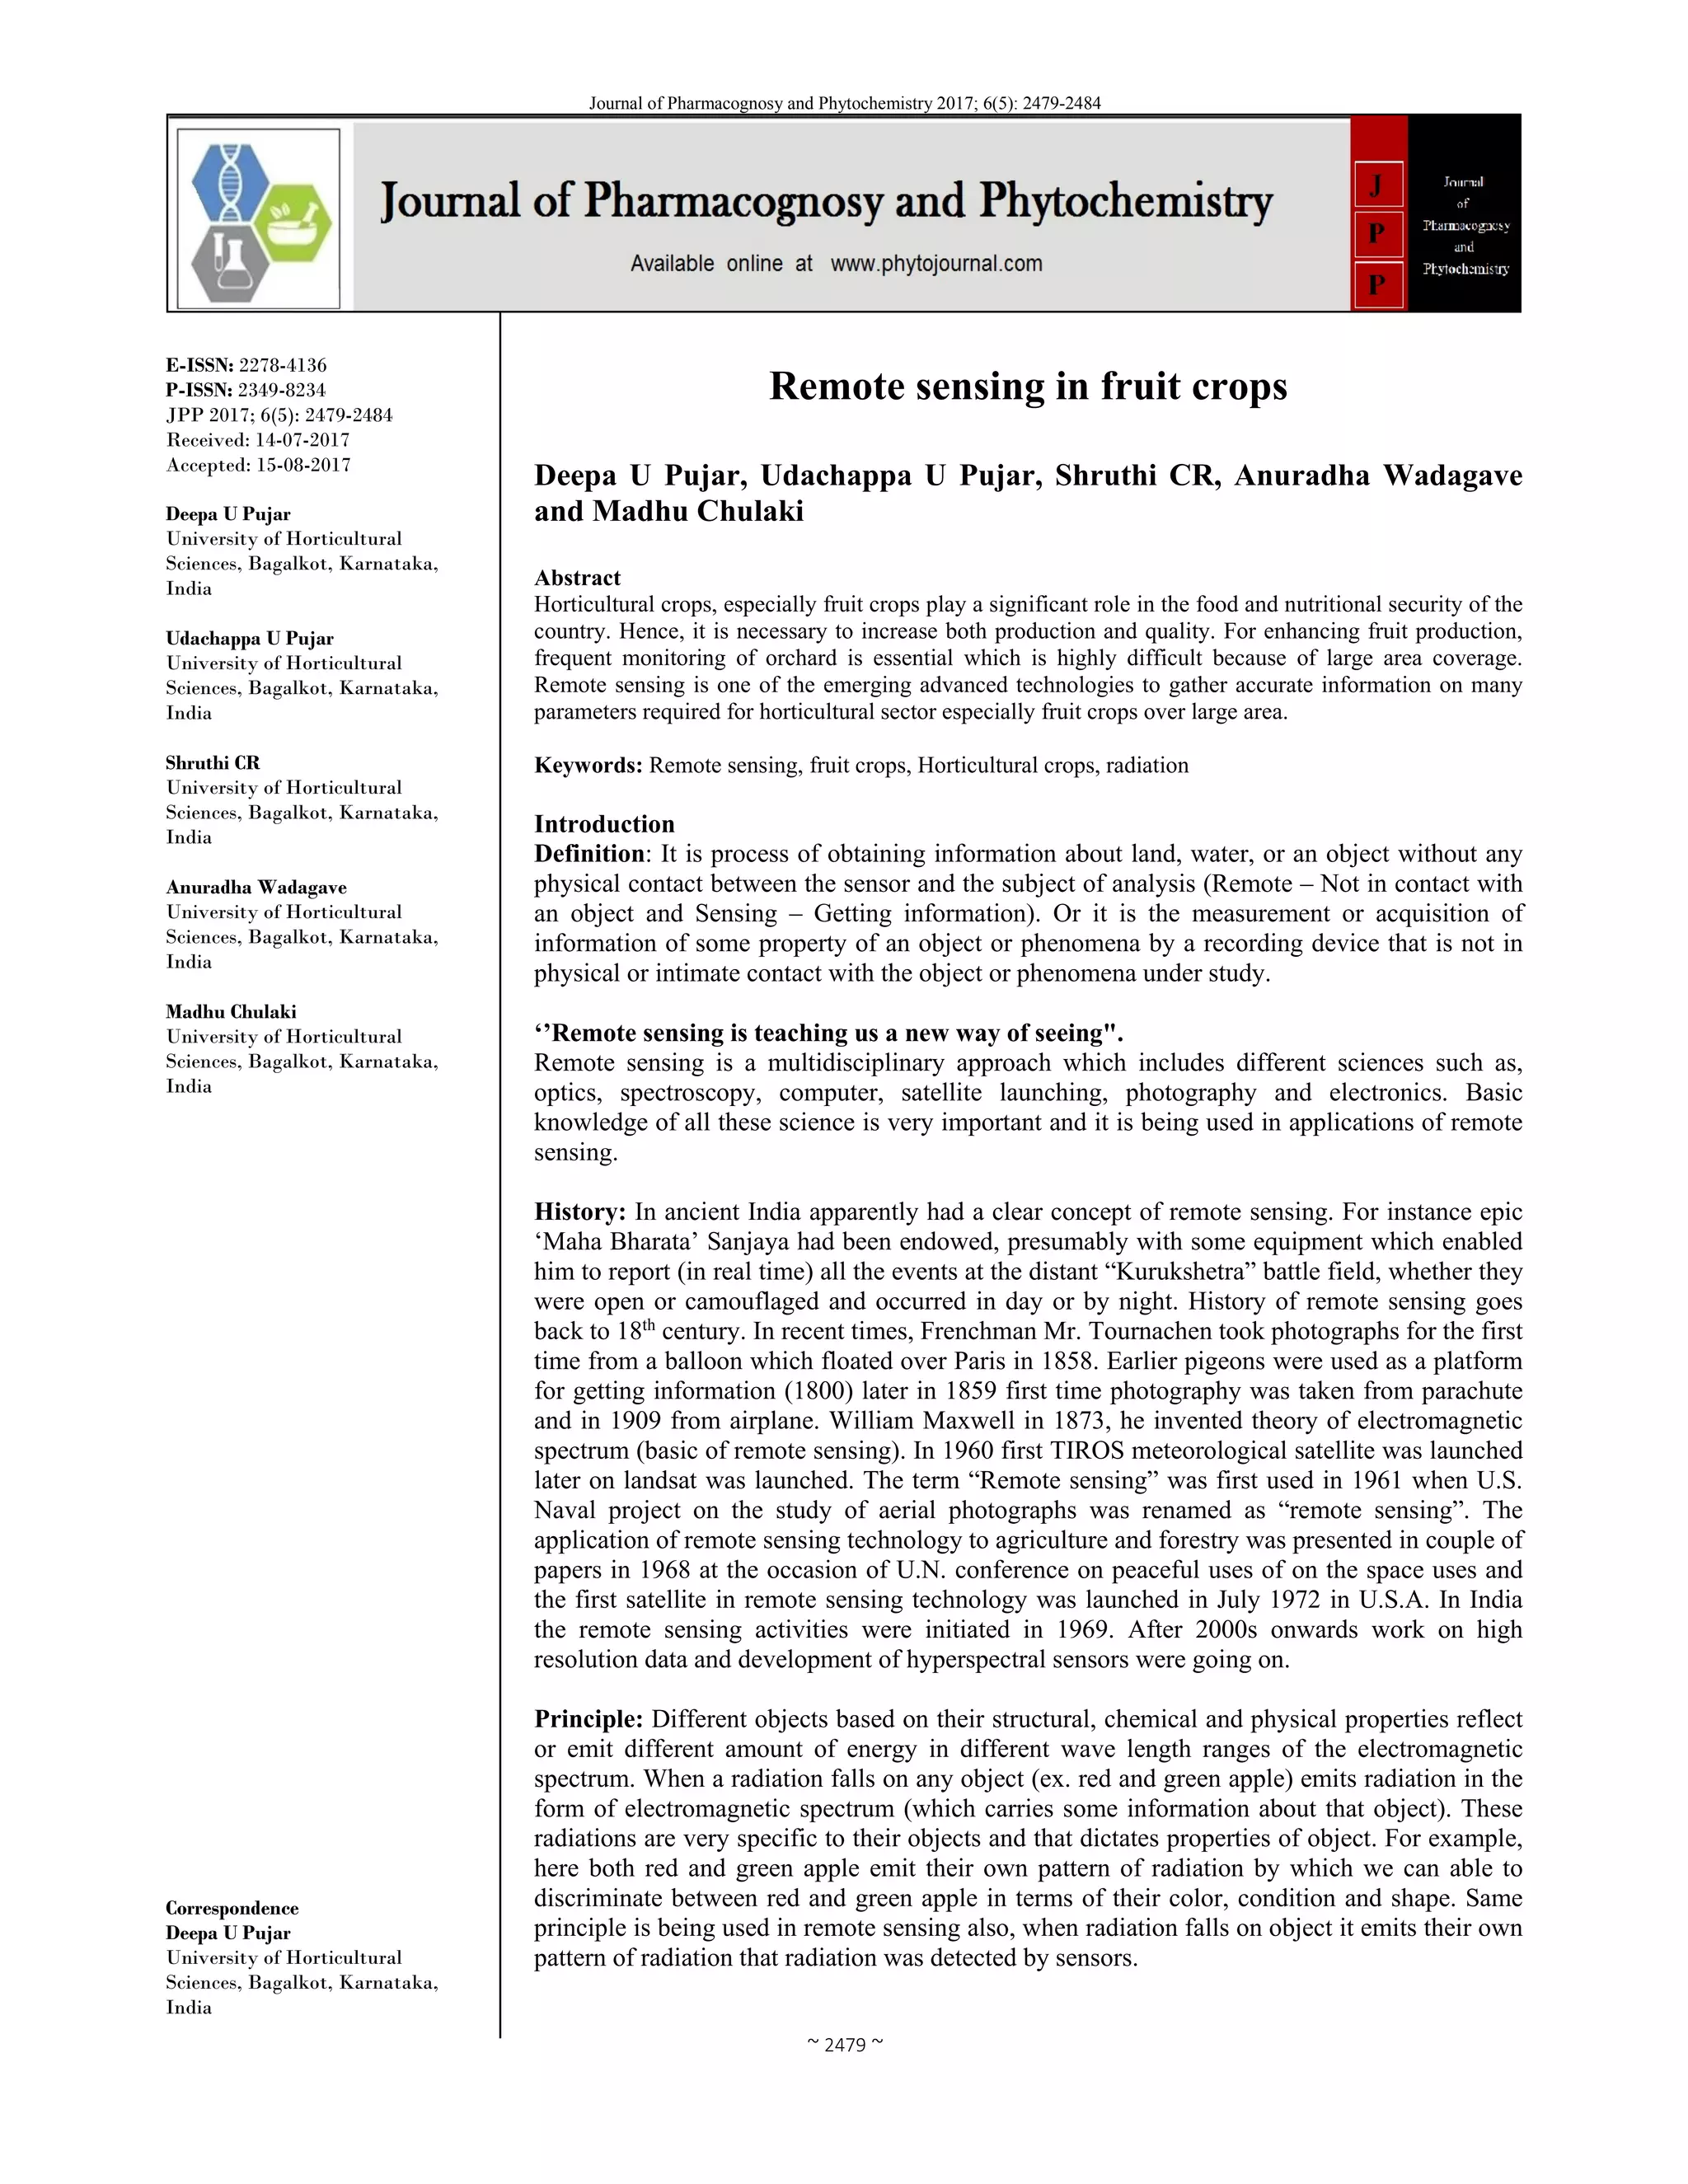
Components of RS
1. Energy Source or Illumination (A) - the first requirement
for remote sensing is to have an energy source which
illuminates or provides electromagnetic energy to the target of
interest.
2. Radiation and the Atmosphere (B) - as the energy travels
from its source to the target, it will come in contact with and
interact with the atmosphere it passes through. This
interaction may take place a second time as the energy travels
from the target to the sensor.
3. Interaction with the Target (C) - once the energy makes
its way to the target through the atmosphere, it interacts with
the target depending on the properties of both the target and
the radiation.
4. Recording of Energy by the Sensor (D) - after the energy
has been scattered by, or emitted from the target, we require a
sensor (remote - not in contact with the target) to collect and
record the electromagnetic radiation.
5. Transmission, Reception, and Processing (E) - the
energy recorded by the sensor has to be transmitted, often in
electronic form, to a receiving and processing station where
the data are processed into an image (hardcopy and/or digital).
6. Interpretation and Analysis (F) - the processed image is
interpreted, visually and/or digitally or electronically, to
extract information about the target which was illuminated.
7. Application (G) - the final element of the remote sensing
process is achieved when we apply the information we have
been able to extract from the imagery about the target in order
to better understand it, reveal some new information, or assist
in solving a particular problem (Fig.4).
Fig 4: Components of remote sensing
Types of Remote Sensing
1. Based on Source of energy: This is based on source of
energy used in remote sensing technique. There are 2 types.
A. Passive remote sensing: In this type solar energy is used
as a source of energy. This operates only in day condition
whenever sunlight is available.
B. Active remote sensing: As name indicates this requires
artificial source of energy. It can be operate in both day and
night condition (Fig.5).
Fig 5: Passive and Active remote sensing
4.
~ 2482 ~
Journal of Pharmacognosy and Phytochemistry
2. Based on Range of Electromagnetic Spectrum: This is
based on type of electromagnetic radiation used in remote
sensing. There are 3 types.
A. Optical Remote Sensing: This measure at a wavelength
of 300 nm to 3000 nm. Which includes Visible, near
infrared, middle infrared and short wave infrared portion
B. Thermal Remote Sensing: This measure at a wavelength
of 3000 to 14000 nm. It records the energy emitted from
the earth.
C. Microwave Remote Sensing: This measure at an
wavelength of 1 mm to 1 m. Active sensors are used in
this type of remote sensing, hence this can operates in all
weather and environmental conditions.
Some known satellites which operates at different
wavelength
1. NOAA-AVHRR (1100 m)
2. GOES (700 m)
3. MODIS (250, 500, 1000 m)
4. Landsat TM (1972) and ETM (30 – 60 m)
5. SPOT (1986)(10 – 20 m)
6. IKONOS (1999) (4, 1 m)
7. Quickbird (2001) (0.6 m)
8. CARTOSAT (2005)
9. IRS- series (1988)
10. AVHRR-Advanced Very High Resolution Radiometer
11. FORMOSAT (2004)
12. ALOS (2006)
Major image processing software’s: There is a need to
analyze information after receiving from reflected radiation
by sensors. Many software’s were used to analyze this data.
Some of software’s were listed her below.
1. ENVI/IDL: http://www.rsinc.com/
2. ERDAS Imagine: http://www.gis.leica-
geosystems.com/Products/Imagine/
3. PCI Geomatics: http://www.pci.on.ca/
4. ER Mapper: http://www.ermapper.com/
5. INTEGRAPH: http://imgs.intergraph.com/gimage/
6. IDRIS
7. Ecognition: http://www.definiens-
imaging.com/ecognition/pro/40.htm
8. ILWIS
9. ArcGIS
Applications: This remote sensing technique has a many
applications especially in orchard pants (grown in large scale).
This technique differentiates between healthy and stressed
plants by radiations reflected by them. This helps to detect
water stress, involved in assessment of pre harvest fruit
quality, early detection of pest and disease, yield estimation,
recommendation of fertilizer dose and also cultivable land
area estimation.
Advantages: As frequent monitoring is difficult especially in
case of orchard plant (large area cultivation), but this
techniques provides regular synoptic view over large area. It
is possible to get accurate results of fertilizer dose
recommendation, land mapping, irrigation intervals etc. Most
important one is, it saves energy and time. One person can
handle thousand hectare lands.
Disadvantages: Since satellites are very expensive to build
and launch, it is expensive technology. Only large farmers can
afford this technology and it can be employed at community
level. It needs expert system and software’s to extract data.
Analysis should be done with care to get proper results.
Remote sensing organisations: These are some remote
sensing organizations at national and international level
1. ISPRS- International Society for Photogrammetry and
Remote Sensing
2. IGARSS- International Geoscience Remote Sensing
symposium
3. NASA- National Aeronautic and Space Administration
(USA)
4. ESA- European Space Agency (Europe)
5. NASDA- National Space Development Agency (Japan)
6. CNES- Centre National d’stedesSpatiales (France)
7. DARA- German Space Agency (Germany)
8. CSA- Canadian Space Agency (Canada)
9. ISRO- Indian Space Research Organisation (Banglore,
Karnataka)
10. NRSA- National Remote Sensing Agency on India
(Balanagar, Hyderabad)
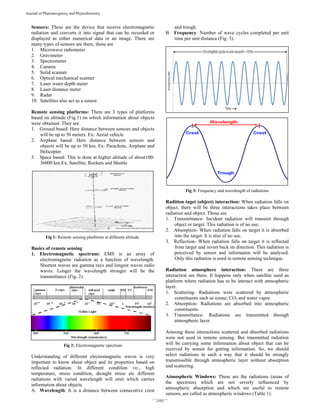
Vegetation indices: These were used as remote sensing
indicators. Reflectance values at different wavelength were
incorporated in equation for getting particular parameter.
Different vegetation indices are indicators for different
parameters such as NDVI for vegetation cover, SIPI for stress
etc. (Table 2).
Table 2: Vegetation indices: (Remote sensing indicator)
Parameter Expansion Equation
1. NDVI Normalised Difference Vegetation Indices R800-R670 / R800+R670
2.TCARI Transformed Chlorophyll Absorption in Reflection Index 3*[(R700-R670)-O.2*(R700-R550)*R700/R670)]
3.OSAVI Optimised Soil Adjusted Vegetation Index (1+0.16)*(R800-R670)/R800+R670+0.16)
4.SR Simple Ratio R800/R670
5.PRI Photochemical Reflectance Index R570-R531/R570+R531
6.SIPI Structure Insensitive Pigment Index R800-R445/R800-R680
7.CTVI Corrected Transformed Vegetation Index NDVI+0.5/abs*(NDVI+0.5). [√abs(NDVI+0.5)]
8. RVSI Red Edge Vegetation Stress Index (R714+R752/2)-R733
9. MSR Modified Red Edge Simple Ratio (R800/R670)-1 /(√R800/R670)+1
10.WBI Water Band Index R900/R970
11.WMI Water Moisture Index R1600/R820
12.PI Photosynthesis Index R531-R570/R531+R570
13.RN Nitrogen Index R550-R600/R800-R900
15.CI Chlorophyll based Difference Index R850-R710/R850-R680
5.
~ 2483 ~
Journal of Pharmacognosy and Phytochemistry
Applications
1. Estimation of cultivable land area and mapping of
orchards
Remote sensing systems have the capability of providing
regular, synoptic, multi-spectral and multi-temporal coverage
of an area. Mustaq and Asima (2014) [3]
have estimated Apple
orchard using remote sensing and agro-metrology land based
observation in Pulwama district of Kashmir valley. They have
taken different parameters viz., terrain parameters like
elevation slope and aspect facilitates better characterization of
apple orchards. These parameters can be further utilized for
apple orchard area expansion. Landsat and AWIFS digital
data were used to monitor and estimate acreage under apple
orchards. The Survey of India (SOl) topographical maps at
1:50,000 scales and image-to image registration were used to
geo- reference the images and crop statistics from State
department of horticulture were used as ancillary data. With
this they found that majority of apple orchards (89.82%) are
concentrated between elevation range 1500-2000 mts. Apple
area above (2000m) is about 10% while under lower
elevations <1500m) is about 0%. The terrain parameters
indicated that the dense orchards lie in the elevation range
1500-2000 meters. Thus these sites can be used as reference
sites to standardize site suitability and management plan of
apple orchards. Since the density matched well with the age of
plantation, sites belonging to dense category may be ones that
need planning for rejuvenation.
2. Recommended dose of fertilizer application
Site-specific grove management by variable rate delivery of
inputs such as fertilizers on a tree size basis could improve
horticultural profitability and environmental protection.
Zaman et al., (2005) [6]
have studied variable rate nitrogen
application in Florida citrus based on ultrasonically-sensed
tree size. Tree canopy sizes were measured real-time in a
typical 17-ha Valencia grove with an automated ultrasonic
sensor system equipped with Differential Global Positioning
System (DGPS). Prescription maps for variable application of
nitrogen fertilizer were generated from ultrasonically scanned
tree sizes on a single tree basis using ArcView GIS and
Midtech Fieldware. Leaf samples from trees with different
canopy sizes, which had been fertilized at a conventional
uniform rate of 270 kg N/ha/y, were analyzed for nitrogen
concentration. Analysis of 2980 tree spaces in the grove
showed a skewed size distribution, with 62% in the 0- to 100-
m3/tree volume classes and a median volume of 79 m3
/tree.
The tree volumes ranged from 0 to 240 m3
/tree. Regression
analysis showed that trees with excess leaf nitrogen (>3%)
had canopies less than 100 m3. These trees receiving excess
nitrogen are likely to have lower fruit yields and quality, and
wasted fertilizer nitrates may leach beyond the root zone to
groundwater. In order to rectify the excess fertilization of
smaller trees, a granular fertilizer spreader with hydraulically
powered split−chain outputs controlled with a MidTech
Legacy 6000 controller was used for variable rate application
of nitrogen in one−half of the grove. A 38% to 40% saving in
granular fertilizer cost was achieved for this grove when
variable N rates were implemented on a per-tree basis ranging
from 135 to 270 kg N/ha/y.
3. Detection of water stress
Remote sensing technology can also helps in identification of
water stress by change in leaf colour. Many techniques such
as high spatial resolution multispectral and thermal airborne
imagery were used to monitor crown temperature and the
Photochemical Reflectance Index (PRI) in peach orchards.
Different irrigation regimes included sustained and regulated
deficit irrigation strategies, were employed to induce stress.
Results revealed that there was a difference in reflectance
pattern between well irrigated and stressed plants (Saurez et
al., 2010) [5]
.
4. Assessment of quality
Quality is one of the important parameter which is ultimate
aim of any producer. In grape wine quality was assessed by
vigour of vine which is directly correlated (Johnson et al.,
2001) [2]
. Remotely sensed vegetation index imagery was used
to establish sub–block management zones in a 3–ha
commercial vineyard of Chardonnay wine–grapes.
Subsequent ground–based measurements revealed a clear
differentiation between low– and high–vigor zones with
respect to biomass (primarily shoot vigor), vine water status,
and most importantly, fruit and wine character. Harvesting by
vigor zones allowed for the extraction of unique wine lots
from a block that was historically treated as a single
management unit. This aspect alone has value in that the
winemaker was provided with greater flexibility in the final
blending process.
5. Early detection of pest infestation
Remote sensing techniques can decrease pest monitoring
costs in orchards. Ludeling et al. (2009) evaluated the
feasibility of detecting spider mite damage in orchards by
measuring visible and near infrared reflectance of 1153 leaves
and 392 canopies in 11 peach orchards in California. Pairs of
significant wavelengths, identified by Partial Least Squares
regression, were combined into normalized difference indices.
These indices were evaluated for correlation with mite
damage. Eight spectral regions for leaves and two regions for
canopies (at blue and red wavelengths) were significantly
correlated with mite damage. Index values were linearly
correlated with mite damage (R2 = 0.47), allowing
identification of mite hotspots in orchards. However, better
standardization of aerial imagery and accounting for
perturbing environmental factors will be necessary for making
this technique applicable for early mite detection.
6. Detection of disease incidence
Remote sensing is emerging as an important component of
precision agriculture for its ability to identify and define crop
health. Changes in spectral reflectance can indicate
physiological stress in trees that result from the changes in
photosynthetic pigments such as chlorophyll, carotenoids and
other factors. With improvements in spatial, spectral and
temporal resolution of remote sensing, multispectral imagery
remains advantageous due to its real-time or near real-time
imagery for visual assessment. With this imagery technique it
is possible to detect infected trees and healthy trees. Sindhuja
et al., (2013) [4]
reported that there was a difference in average
reflectance. Values of the healthy trees in the visible region
were lower than those in the near infrared region, while the
opposite was the case for HLB-infected trees. This could
helps in taking up of immediate control measures, so that
spread of disease could be minimised.
Conclusion
Remote sensing is a valuable tool for frequent monitoring
orchards at high spatial resolution which allow site specific
economically favourable management strategies. Helps in
reducing monitoring costs, enhances resource use efficiency,
lowering total production cost and Increases profit.
6.
~ 2484 ~
Journal of Pharmacognosy and Phytochemistry
References
1. Eike L, Adam H, Minghua Z, Walter JB, Cecil D. Remote
sensing of spider mite damage in California peach
orchards. Int. J. App. Earth Observation and
Geoinformation. 2009; 11(3):244-255.
2. Johnson LF, Bosch DF, Wiiliums DC, Lobitz BM.
Remote sensing of vineyard management zones:
Implications for wine quality.Applied Eng. In Agri.
2001; 17(4):557-560.
3. Mushtaq G, Asima N. Estimation of apple orchard using
remote sensing and agro-meteorology land based
observation in Pulwama district of Kashmir valley. Int. J.
Remote sensing and Geo. Sci. 2014; 3(6):2319-3484.
4. Sindhuja S, Joe M, Sherrie B, Reza E. Huanglongbing
(Citrus Greening) detection using visible, near infrared
and thermal imaging techniques. Sensors. 2013;
13(6):2117-2130.
5. Suarez L, Zarco TPJ, Gonzalez V, Berni JA, Sagardoy R,
Morales B, Fereres E. Detecting water stress effects on
fruit quality in orchards with time-series PRI airborne
imagery. Remote Sensing Env. 2010; 114(4):286-298.
6. Zaman QU, Schumann AW, Miller WM. Variable rate
nitrogen application in florida citrus based on
ultrasonically-sensed tree size. Am. Soc. Agril.
Engineers. 2005; 21(3):331-335.