Download as PDF, PPTX


![Page 171/10/2013 |
Author
Department
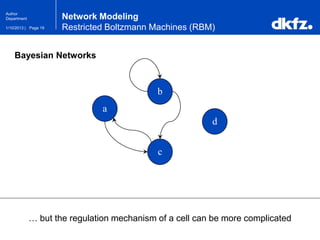
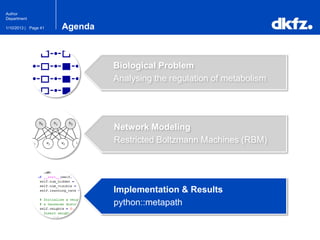
Bayesian Networks
Bayesian Networks use joint probabilities …
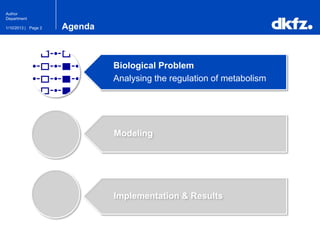
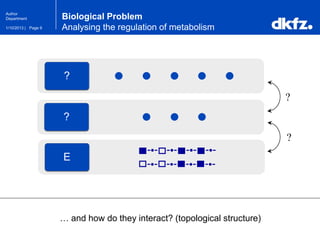
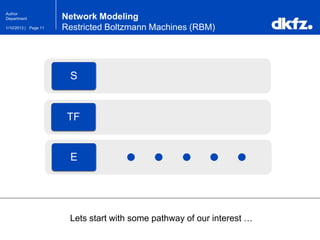
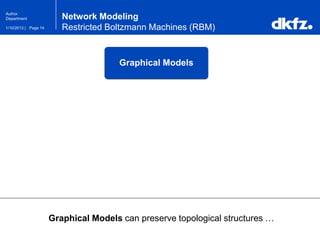
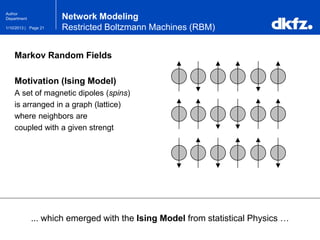
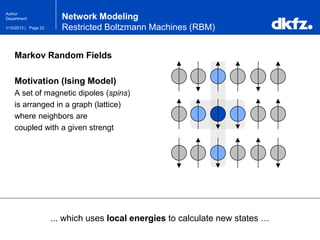
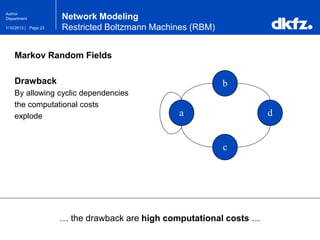
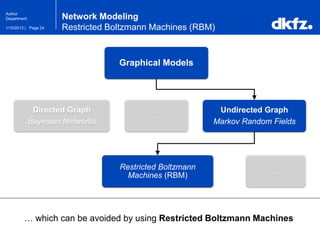
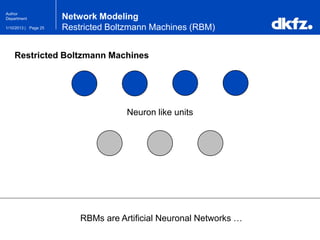
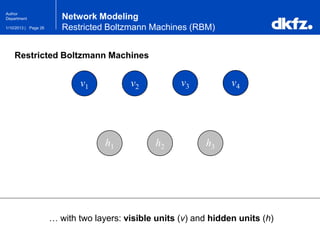
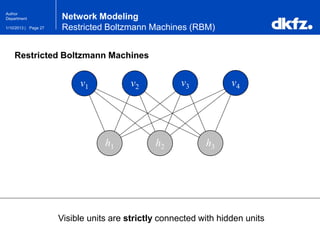
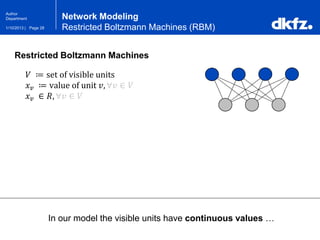
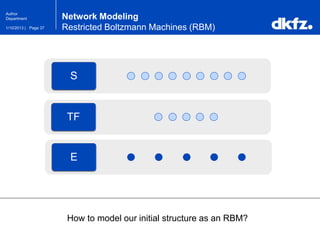
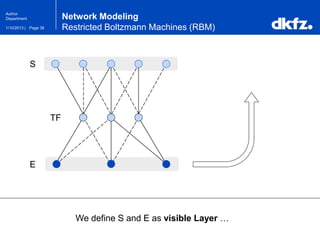
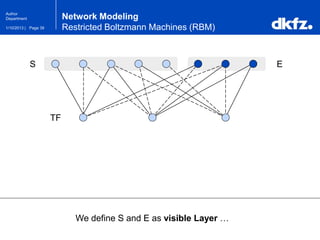
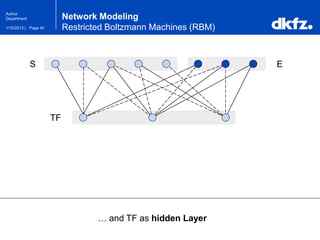
Network Modeling
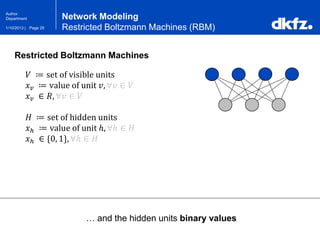
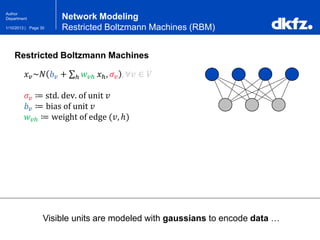
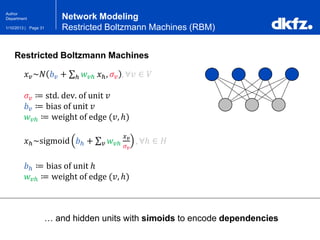
Restricted Boltzmann Machines (RBM)
a b
a b c P[a,b,c]
0 0 0 0.1
0 0 1 0.9
0 1 0 0.5
0 1 1 0.5
1 0 0 …
… … … …
c
?](https://image.slidesharecdn.com/regulationanalysisusingrestrictedboltzmannmachines2013-200111080804/85/Regulation-Analysis-using-Restricted-Boltzmann-Machines-17-320.jpg)
![Page 181/10/2013 |
Author
Department
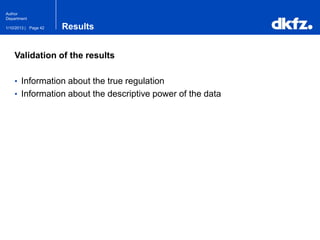
Bayesian Networks
… to represents conditional dependencies in an acyclic graph …
Network Modeling
Restricted Boltzmann Machines (RBM)
a b
a b c P[a,b,c]
0 0 0 0.1
0 0 1 0.9
0 1 0 0.5
0 1 1 0.5
1 0 0 …
… … … …
c](https://image.slidesharecdn.com/regulationanalysisusingrestrictedboltzmannmachines2013-200111080804/85/Regulation-Analysis-using-Restricted-Boltzmann-Machines-18-320.jpg)
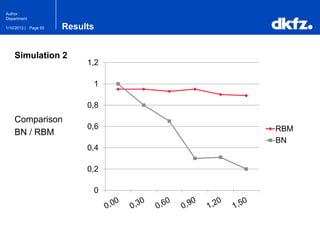
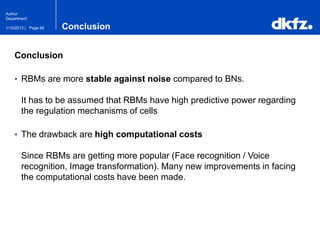


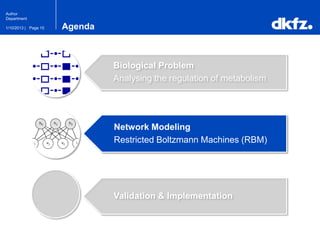
This document summarizes a presentation on using restricted Boltzmann machines to model the regulation of metabolism. It discusses using RBMs as a graphical model to represent topological network structures and preserve dependencies between transcription factors, signals, and enzymes in metabolic pathways. The document outlines how an RBM represents the network as visible and hidden units, learns the dependencies through an energy-based model and stochastic gradient descent, and validates the results on simulated data representing simple regulatory relationships.


![谷歌留痕技术 [ 𝙩𝙤𝙥 𝟮𝟯𝟯. 𝙘 𝙤𝙢 ]](https://cdn.slidesharecdn.com/ss_thumbnails/top233-260130174328-3833018c-thumbnail.jpg?width=640&height=640&fit=bounds)

