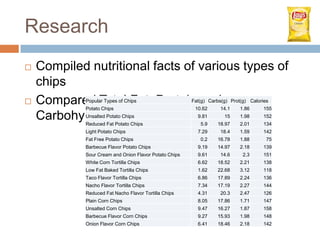
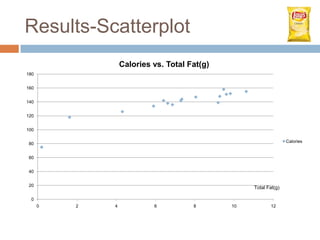
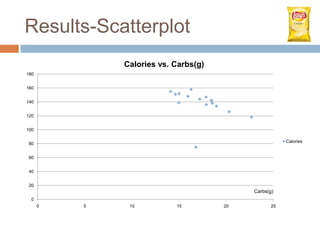
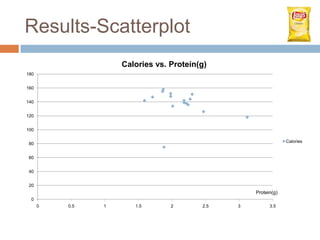
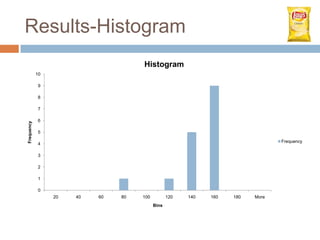
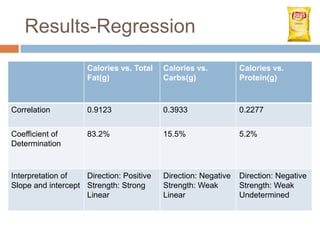
REGRESSION ANALYSIS
PROJECT


    Ross Weitzer, Billy Wagner, Tara
    Devlin, Mengyun Jia, Ruey-Min Chu
Research Question
Do the nutritional factors in chips, such as
   total fat, carbohydrates and protein
determine the amount of calories in chips?
Hypothesis
   We believe that the main nutritional
    factors, such as total fat, carbohydrates and
    protein will be directly proportional to the
    caloric content of the chips.
Research
   Compiled nutritional facts of various types of
    chips
   Compared Total Fat, Protein and
             Popular Types of Chips
             Potato Chips
                                                        Fat(g) Carbs(g) Prot(g) Calories
                                                         10.62      14.1    1.86      155
    Carbohydrates to Calories.
             Unsalted Potato Chips
             Reduced Fat Potato Chips
                                                          9.81
                                                           5.9
                                                                     15
                                                                  18.97
                                                                            1.98
                                                                            2.01
                                                                                      152
                                                                                      134
             Light Potato Chips                           7.29      18.4    1.59      142
             Fat Free Potato Chips                         0.2    16.78     1.88       75
             Barbecue Flavor Potato Chips                 9.19    14.97     2.18      139
             Sour Cream and Onion Flavor Potato Chips     9.61      14.6     2.3      151
             White Corn Tortilla Chips                    6.62    18.52     2.21      138
             Low Fat Baked Tortilla Chips                 1.62    22.68     3.12      118
             Taco Flavor Tortilla Chips                   6.86    17.89     2.24      136
             Nacho Flavor Tortilla Chips                  7.34    17.19     2.27      144
             Reduced Fat Nacho Flavor Tortilla Chips      4.31      20.3    2.47      126
             Plain Corn Chips                             8.05    17.86     1.71      147
             Unsalted Corn Chips                          9.47    16.27     1.87      158
             Barbecue Flavor Corn Chips                   9.27    15.93     1.98      148
             Onion Flavor Corn Chips                      6.41    18.46     2.18      142
Results-Scatterplot
                  Calories vs. Total Fat(g)
180


160


140


120


100

                                                                  Calories
 80


 60


 40


 20                                                Total Fat(g)

  0
      0   2   4            6          8       10          12
Results-Scatterplot
              Calories vs. Carbs(g)
180


160


140


120


100

                                                       Calories
 80


 60


 40


 20
                                           Carbs(g)
  0
      0   5    10          15         20          25
Results-Scatterplot
                    Calories vs. Protein(g)
180


160


140


120


100

                                                                Calories
 80


 60


 40


 20
                                                   Protein(g)
  0
      0   0.5   1      1.5       2       2.5   3         3.5
Results-Histogram
                                     Histogram
            10

             9

             8

             7

             6
Frequency


             5

                                                                                 Frequency
             4

             3

             2

             1

             0
                 20   40   60   80   100          120   140   160   180   More
                                           Bins
Results-Regression
                     Calories vs. Total   Calories vs.          Calories vs.
                     Fat(g)               Carbs(g)              Protein(g)


Correlation          0.9123               0.3933                0.2277


Coefficient of       83.2%                15.5%                 5.2%
Determination


Interpretation of   Direction: Positive   Direction: Negative   Direction: Negative
Slope and intercept Strength: Strong      Strength: Weak        Strength: Weak
                    Linear                Linear                Undetermined
Conclusion
   From our results we conclude that total fat and
    calories have a direct relationship while carbs
    and protein have a weak relation to the
    calories.
Questions
Work Cited
   http://fatsecret.com/calories-
    nutrition/food/chips

Regression analysis project

  • 1.
    REGRESSION ANALYSIS PROJECT Ross Weitzer, Billy Wagner, Tara Devlin, Mengyun Jia, Ruey-Min Chu
  • 2.
    Research Question Do thenutritional factors in chips, such as total fat, carbohydrates and protein determine the amount of calories in chips?
  • 3.
    Hypothesis  We believe that the main nutritional factors, such as total fat, carbohydrates and protein will be directly proportional to the caloric content of the chips.
  • 4.
    Research  Compiled nutritional facts of various types of chips  Compared Total Fat, Protein and Popular Types of Chips Potato Chips Fat(g) Carbs(g) Prot(g) Calories 10.62 14.1 1.86 155 Carbohydrates to Calories. Unsalted Potato Chips Reduced Fat Potato Chips 9.81 5.9 15 18.97 1.98 2.01 152 134 Light Potato Chips 7.29 18.4 1.59 142 Fat Free Potato Chips 0.2 16.78 1.88 75 Barbecue Flavor Potato Chips 9.19 14.97 2.18 139 Sour Cream and Onion Flavor Potato Chips 9.61 14.6 2.3 151 White Corn Tortilla Chips 6.62 18.52 2.21 138 Low Fat Baked Tortilla Chips 1.62 22.68 3.12 118 Taco Flavor Tortilla Chips 6.86 17.89 2.24 136 Nacho Flavor Tortilla Chips 7.34 17.19 2.27 144 Reduced Fat Nacho Flavor Tortilla Chips 4.31 20.3 2.47 126 Plain Corn Chips 8.05 17.86 1.71 147 Unsalted Corn Chips 9.47 16.27 1.87 158 Barbecue Flavor Corn Chips 9.27 15.93 1.98 148 Onion Flavor Corn Chips 6.41 18.46 2.18 142
  • 5.
    Results-Scatterplot Calories vs. Total Fat(g) 180 160 140 120 100 Calories 80 60 40 20 Total Fat(g) 0 0 2 4 6 8 10 12
  • 6.
    Results-Scatterplot Calories vs. Carbs(g) 180 160 140 120 100 Calories 80 60 40 20 Carbs(g) 0 0 5 10 15 20 25
  • 7.
    Results-Scatterplot Calories vs. Protein(g) 180 160 140 120 100 Calories 80 60 40 20 Protein(g) 0 0 0.5 1 1.5 2 2.5 3 3.5
  • 8.
    Results-Histogram Histogram 10 9 8 7 6 Frequency 5 Frequency 4 3 2 1 0 20 40 60 80 100 120 140 160 180 More Bins
  • 9.
    Results-Regression Calories vs. Total Calories vs. Calories vs. Fat(g) Carbs(g) Protein(g) Correlation 0.9123 0.3933 0.2277 Coefficient of 83.2% 15.5% 5.2% Determination Interpretation of Direction: Positive Direction: Negative Direction: Negative Slope and intercept Strength: Strong Strength: Weak Strength: Weak Linear Linear Undetermined
  • 10.
    Conclusion  From our results we conclude that total fat and calories have a direct relationship while carbs and protein have a weak relation to the calories.
  • 11.
  • 12.
    Work Cited  http://fatsecret.com/calories- nutrition/food/chips