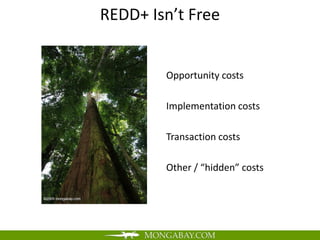
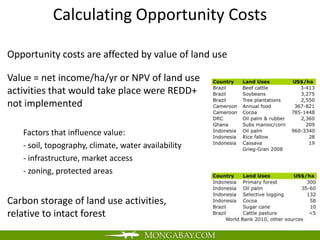
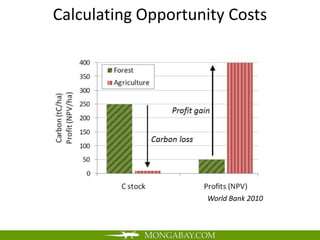
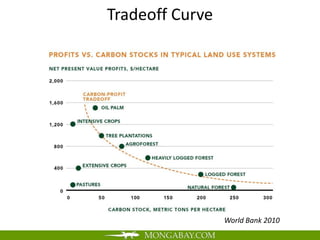
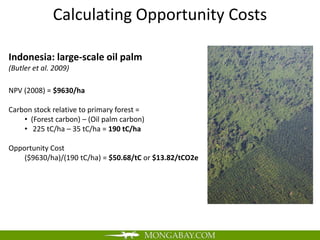
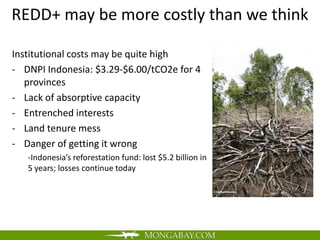
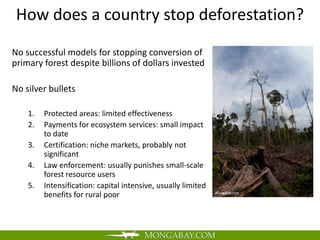
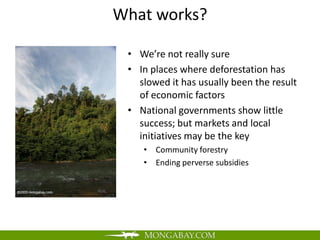
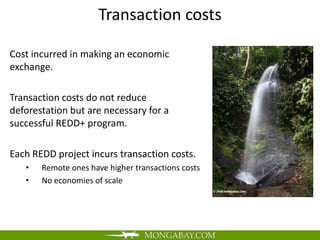
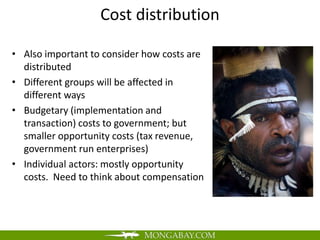
Costing REDD+
The costs of Reducing Emissions from Deforestation
                 and Degradation

             Rhett Butler, mongabay.com
REDD+: History & Ambition

Evolution:
RED => REDD+

But goal remains the same:
Curb carbon emissions from deforestation
and forest degradation by compensating
forest owners
Co-Benefits
REDD+ Isn’t Free


        Opportunity costs

        Implementation costs

        Transaction costs

        Other / “hidden” costs
Why the Cost of REDD+ Is Important

Policy makers
- How much would it cost our country
  to avoid deforestation?
- How would these costs be
  distributed?
- What are the best opportunities for
  reducing deforestation?

Landowners/users
- How much should I get paid?
Opportunity Costs

         Opportunity costs = benefits
         forgone

         Protecting forests entails a
         tradeoff

         Opportunity cost analysis seeks
         to quantify what is given up by
         protecting forests.
Why Opportunity Costs Are Important

• Large component of REDD+ costs
• Insight into drivers
• Identify likely impacts of REDD+
  across different groups
• Establish fair compensation
• Determine downstream costs
Calculating Opportunity Costs

Opportunity costs are affected by value of land use

Value = net income/ha/yr or NPV of land use
activities that would take place were REDD+
not implemented

   Factors that influence value:
   - soil, topography, climate, water availability
   - infrastructure, market access
   - zoning, protected areas


Carbon storage of land use activities,
relative to intact forest
Calculating Opportunity Costs


                    World Bank 2010
Tradeoff Curve


                 World Bank 2010
Calculating Opportunity Costs

Indonesia: large-scale oil palm
(Butler et al. 2009)

NPV (2008) = $9630/ha

Carbon stock relative to primary forest =
    • (Forest carbon) – (Oil palm carbon)
    • 225 tC/ha – 35 tC/ha = 190 tC/ha

Opportunity Cost
    ($9630/ha)/(190 tC/ha) = $50.68/tC or $13.82/tCO2e
Abatement Cost Curve
McKinsey Cost Curve
Calculating Opportunity Costs: Scale
                (Boucher 2008)

           1. Global economic
           2. Regional empirical
           3. Area-based
           Cost of reducing deforestation ~50%


                                                 $11.66


                              $5.52

           $2.51
Opportunity Cost Models/Tools

National level analysis: use bottom-up
approach
   • Specific to each country
   • Works sub-nationally


Other tools
   • ORISIS (collaborative effort)
   • World Bank’s Estimating the Opportunity
   Costs of REDD+: A training manual
Where REDD+ Opportunity Costs Fail

Opportunity costs are not enough to
forecast the cost of REDD+
Chief criticisms:
   •Non-market activities
   •Favors industrial users => BAU
   •Implementation and transaction costs can be
   substantial
   •Does focus on compensating opportunity
   costs miss cheaper approaches?
Criticism: McKinsey Cost Curve
•Undervalues non-market activities, especially subsistence farming
•Encourages BAU for palm oil, soy, pulp and paper, rubber
Opportunity Costs: Criticism

-REDD+ supports intensification
   -Intensification often capital intensive
   -What about smallholders?
   -What about wildlife-friendly farming?
   -Will REDD+ subsidize industrial capacity
   expansion (e.g. Indonesia)
-Moral hazard
   -Lack of governance scenario
   -Subsidies now worth penalties in future
Cattle Ranching in Brazil
                                        Example opportunity costs
•Low intensity cattle ranching has
negative NPV
•But most deforested land in
Brazilian Amazon becomes pasture
•Opportunity cost modeling may not
capture full value; thus
                                                  World Bank 2010
compensating for opportunity cost
would fail
•Conversion for land speculation, not
beef production.
Cheaper Options than Compensating OCs?

 Good governance
    -Law enforcement a lot cheaper (e.g. Brazil,
    Indonesia)
 Modifying economic policies
    -Ending damaging subsidies
    -Collecting taxes instead of bribes
Implementation and Transaction Costs

  Implementation and transactions cost can be substantial
Implementation costs

Cost of carrying out actions to reduce
deforestation and degradation
   •Land use planning
   •Institution-building
   •Forest protection
   •Improved forest and agricultural
   management
   •Administration
Implementation costs

Usually assumed to be substantially lower than opportunity costs
   -Boucher 2008: <$1/tCO2e
       - Implementation $0.51 (Nepstad et al 2007) + Transaction $0.38 (Antinori and Sathaye
       2007) + Administration $0.04 (Greig-Gran 2006)
   -Sohngen 2008: $1/tCO2e based on USDA Conservation Reserve Program
But not a safe assumption:
   - Juma’s implementation + transactions costs = 45%
REDD+ may be more costly than we think

Institutional costs may be quite high
- DNPI Indonesia: $3.29-$6.00/tCO2e for 4
   provinces
- Lack of absorptive capacity
- Entrenched interests
- Land tenure mess
- Danger of getting it wrong
   -Indonesia’s reforestation fund: lost $5.2 billion in
   5 years; losses continue today
How does a country stop deforestation?
No successful models for stopping conversion of
primary forest despite billions of dollars invested

No silver bullets

    1.   Protected areas: limited effectiveness
    2.   Payments for ecosystem services: small impact
         to date
    3.   Certification: niche markets, probably not
         significant
    4.   Law enforcement: usually punishes small-scale
         forest resource users
    5.   Intensification: capital intensive, usually limited
         benefits for rural poor
What works?

 • We’re not really sure
 • In places where deforestation has
   slowed it has usually been the result
   of economic factors
 • National governments show little
   success; but markets and local
   initiatives may be the key
    • Community forestry
    • Ending perverse subsidies
Transaction costs

Cost incurred in making an economic
exchange.

Transaction costs do not reduce
deforestation but are necessary for a
successful REDD+ program.

Each REDD project incurs transaction costs.
   •   Remote ones have higher transactions costs
   •   No economies of scale
Transaction Costs: Examples


                •Site search and selection
                •Agreement negotiation
                •MRV
                •Enforcement
Transaction Costs: Agreement negotiation

Agreement negotiation
- Establishing land ownership is a complex
  process in many countries
- Multiple owners and users who claim
  property rights
- State ownership (75%), but local use.
  Who gets paid?
- All claimants need to be part of the
  process
- Brazil’s Terra Legal Program (2009)
   -   grant formal legal title to squatters on state
       land in the Amazon
Transaction Costs: MRV

- Technology improving, but may require
  more than just a technical solution
- Additionality remains a problem. How
  can it be shown that reductions wouldn’t
  have happened without REDD
   -   e.g. Asia Pulp & Paper project in Kampar
       project, Guyana.
- Stabilization in HFLD countries
   -   $1.8B/yr for 11 most important HFLD
       countries (Da Fonseca 2007)


                                                  CAO/Asner Lab
Transaction Costs: Benefits distribution

- Large number of stakeholders
  potentially makes benefit distribution
  is a challenge
- Central government bodies in some
  countries do not have a good track
  record (e.g. Indonesia)
- Lessons from Bolsa Floresta?
Transaction costs

Difficult to forecast: $0.38 (Antinori and Sathaye 2007), Juma ~10%;
but may be substantially higher in some cases

Alston and Andersson (2010) propose 2 approaches to reduce
1. Sort out property rights
   •   NBER authors suggest field-based forest inventories could include
       delineation of property rights as part of the process
   •   E.g. Rapid Land Tenure Assessment (World Agroforestry Centre)
2. Multi-level governance efforts
   •   Monitoring by local association of forest users and independent research
       institutes rather than central govt
“Hidden” costs: economic

- Downstream industries and services
   -   Processing, manufacturing, transport, retail
- Local and regional investment
   -   Public and private sector; infrastructure
- Job creation
   -   Sustainable livelihoods?
- Tax revenue
   -   How much tax revenue does forest carbon
       generate? Do smallholder farmers pay taxes?
- Food, fuel, fiber prices
   -   How are they affected by REDD+?
“Hidden” costs: economic
- Policymakers are increasingly aware of these
  costs
- Examples:
   -   Coalition for Rainforest Nations: $ outside
       forest sector
   -   Guyana: $ for infrastructure, roads, health,
       entrepreneurship
   -   Indonesia: $ for industrial development;
       healthcare model (?)
- Danger: overloading the REDD+ Donkey
  (Nepstad 2010)
   -   Focus on transition to LCD has expanded scope
       considerably
   -   REDD+ becomes everything to everyone and
       disappoints
Other costs: social/political/cultural
REDD+ reduces these relative to strict AD/RED model

Social disruption
• Subsistence farmers abandoning traditional practices; loss of knowledge?
• More urban migration? Livelihood shifts?
• Conservation refugees?
Ecosystem disservices
• Human-wildlife conflict (e.g. elephants, tigers)
Option value
• Rising food prices, REDD limits land use options for 30 years
Market risk
• Fate of species to be linked with carbon price swings?
• Magic bullet (CCS, CO2 ejection system)
Politics
• International relations: Trade relationships (e.g. Japan and Philippines)
• Local politics (Indonesia)
Cost distribution

• Also important to consider how costs are
  distributed
• Different groups will be affected in
  different ways
• Budgetary (implementation and
  transaction) costs to government; but
  smaller opportunity costs (tax revenue,
  government run enterprises)
• Individual actors: mostly opportunity
  costs. Need to think about compensation
Take home points

•REDD+ may be more expensive than we
think, but that doesn’t mean it can’t work
•For REDD+ to be effective, must be realistic
and account for all costs
•Decision-makers should have these costs in
mind
•Comprehensive tradeoff analysis
incorporating an assessment of the less
tangible costs and benefits
Rhett A Butler
               rhett@mongabay.com


mongabay.com
Global economic models

Top-down approach based on dynamic economic models using
aggregate variables (e.g. interest rates, population growth,
consumption of energy or timber)
Examples: Ohio State (US), Lawrence Berkeley Lab (US), IIASA (Austria)
Good: incorporates global supply and demand trends
Bad: imprecise, simplistic, not useful for national projections
Global estimate: $1.70-38.00 for 50% reduction between 2005-2030,
depending on assumptions and region
Regional empirical models

Bottom-up approach using specific carbon density and per area
opportunity cost based on actual NPV of land use
Examples: Alternatives to Slash-and-Burn Program
Good: Precise
Bad: Misses global feedback (supply and demand trends)
Global estimate: $2.51 mean (Boucher 2008, n=29)
Opportunity Costs: Area-based

Per area approach using synthesis of sub-national and global
analysis to generate global estimates
Example: Greig-Gran 2006/2008: 8 major countries
Good: Can be applied where forest carbon data is lacking
Bad: Lower resolution than empirical, but based on sub-national
opportunity costs; carbon data more generalized over forest areas
Estimate: $2.76-8.58, $5.52 midpoint

REDD Panama 2011 - Rhett Butler / Costos netos REDD+

  • 1.
    Costing REDD+ The costsof Reducing Emissions from Deforestation and Degradation Rhett Butler, mongabay.com
  • 2.
    REDD+: History &Ambition Evolution: RED => REDD+ But goal remains the same: Curb carbon emissions from deforestation and forest degradation by compensating forest owners
  • 3.
  • 4.
    REDD+ Isn’t Free Opportunity costs Implementation costs Transaction costs Other / “hidden” costs
  • 5.
    Why the Costof REDD+ Is Important Policy makers - How much would it cost our country to avoid deforestation? - How would these costs be distributed? - What are the best opportunities for reducing deforestation? Landowners/users - How much should I get paid?
  • 6.
    Opportunity Costs Opportunity costs = benefits forgone Protecting forests entails a tradeoff Opportunity cost analysis seeks to quantify what is given up by protecting forests.
  • 7.
    Why Opportunity CostsAre Important • Large component of REDD+ costs • Insight into drivers • Identify likely impacts of REDD+ across different groups • Establish fair compensation • Determine downstream costs
  • 8.
    Calculating Opportunity Costs Opportunitycosts are affected by value of land use Value = net income/ha/yr or NPV of land use activities that would take place were REDD+ not implemented Factors that influence value: - soil, topography, climate, water availability - infrastructure, market access - zoning, protected areas Carbon storage of land use activities, relative to intact forest
  • 9.
  • 10.
    Tradeoff Curve World Bank 2010
  • 11.
    Calculating Opportunity Costs Indonesia:large-scale oil palm (Butler et al. 2009) NPV (2008) = $9630/ha Carbon stock relative to primary forest = • (Forest carbon) – (Oil palm carbon) • 225 tC/ha – 35 tC/ha = 190 tC/ha Opportunity Cost ($9630/ha)/(190 tC/ha) = $50.68/tC or $13.82/tCO2e
  • 12.
  • 13.
  • 14.
    Calculating Opportunity Costs:Scale (Boucher 2008) 1. Global economic 2. Regional empirical 3. Area-based Cost of reducing deforestation ~50% $11.66 $5.52 $2.51
  • 15.
    Opportunity Cost Models/Tools Nationallevel analysis: use bottom-up approach • Specific to each country • Works sub-nationally Other tools • ORISIS (collaborative effort) • World Bank’s Estimating the Opportunity Costs of REDD+: A training manual
  • 16.
    Where REDD+ OpportunityCosts Fail Opportunity costs are not enough to forecast the cost of REDD+ Chief criticisms: •Non-market activities •Favors industrial users => BAU •Implementation and transaction costs can be substantial •Does focus on compensating opportunity costs miss cheaper approaches?
  • 17.
    Criticism: McKinsey CostCurve •Undervalues non-market activities, especially subsistence farming •Encourages BAU for palm oil, soy, pulp and paper, rubber
  • 18.
    Opportunity Costs: Criticism -REDD+supports intensification -Intensification often capital intensive -What about smallholders? -What about wildlife-friendly farming? -Will REDD+ subsidize industrial capacity expansion (e.g. Indonesia) -Moral hazard -Lack of governance scenario -Subsidies now worth penalties in future
  • 19.
    Cattle Ranching inBrazil Example opportunity costs •Low intensity cattle ranching has negative NPV •But most deforested land in Brazilian Amazon becomes pasture •Opportunity cost modeling may not capture full value; thus World Bank 2010 compensating for opportunity cost would fail •Conversion for land speculation, not beef production.
  • 20.
    Cheaper Options thanCompensating OCs? Good governance -Law enforcement a lot cheaper (e.g. Brazil, Indonesia) Modifying economic policies -Ending damaging subsidies -Collecting taxes instead of bribes
  • 21.
    Implementation and TransactionCosts Implementation and transactions cost can be substantial
  • 22.
    Implementation costs Cost ofcarrying out actions to reduce deforestation and degradation •Land use planning •Institution-building •Forest protection •Improved forest and agricultural management •Administration
  • 23.
    Implementation costs Usually assumedto be substantially lower than opportunity costs -Boucher 2008: <$1/tCO2e - Implementation $0.51 (Nepstad et al 2007) + Transaction $0.38 (Antinori and Sathaye 2007) + Administration $0.04 (Greig-Gran 2006) -Sohngen 2008: $1/tCO2e based on USDA Conservation Reserve Program But not a safe assumption: - Juma’s implementation + transactions costs = 45%
  • 24.
    REDD+ may bemore costly than we think Institutional costs may be quite high - DNPI Indonesia: $3.29-$6.00/tCO2e for 4 provinces - Lack of absorptive capacity - Entrenched interests - Land tenure mess - Danger of getting it wrong -Indonesia’s reforestation fund: lost $5.2 billion in 5 years; losses continue today
  • 25.
    How does acountry stop deforestation? No successful models for stopping conversion of primary forest despite billions of dollars invested No silver bullets 1. Protected areas: limited effectiveness 2. Payments for ecosystem services: small impact to date 3. Certification: niche markets, probably not significant 4. Law enforcement: usually punishes small-scale forest resource users 5. Intensification: capital intensive, usually limited benefits for rural poor
  • 26.
    What works? •We’re not really sure • In places where deforestation has slowed it has usually been the result of economic factors • National governments show little success; but markets and local initiatives may be the key • Community forestry • Ending perverse subsidies
  • 27.
    Transaction costs Cost incurredin making an economic exchange. Transaction costs do not reduce deforestation but are necessary for a successful REDD+ program. Each REDD project incurs transaction costs. • Remote ones have higher transactions costs • No economies of scale
  • 28.
    Transaction Costs: Examples •Site search and selection •Agreement negotiation •MRV •Enforcement
  • 29.
    Transaction Costs: Agreementnegotiation Agreement negotiation - Establishing land ownership is a complex process in many countries - Multiple owners and users who claim property rights - State ownership (75%), but local use. Who gets paid? - All claimants need to be part of the process - Brazil’s Terra Legal Program (2009) - grant formal legal title to squatters on state land in the Amazon
  • 30.
    Transaction Costs: MRV -Technology improving, but may require more than just a technical solution - Additionality remains a problem. How can it be shown that reductions wouldn’t have happened without REDD - e.g. Asia Pulp & Paper project in Kampar project, Guyana. - Stabilization in HFLD countries - $1.8B/yr for 11 most important HFLD countries (Da Fonseca 2007) CAO/Asner Lab
  • 31.
    Transaction Costs: Benefitsdistribution - Large number of stakeholders potentially makes benefit distribution is a challenge - Central government bodies in some countries do not have a good track record (e.g. Indonesia) - Lessons from Bolsa Floresta?
  • 32.
    Transaction costs Difficult toforecast: $0.38 (Antinori and Sathaye 2007), Juma ~10%; but may be substantially higher in some cases Alston and Andersson (2010) propose 2 approaches to reduce 1. Sort out property rights • NBER authors suggest field-based forest inventories could include delineation of property rights as part of the process • E.g. Rapid Land Tenure Assessment (World Agroforestry Centre) 2. Multi-level governance efforts • Monitoring by local association of forest users and independent research institutes rather than central govt
  • 33.
    “Hidden” costs: economic -Downstream industries and services - Processing, manufacturing, transport, retail - Local and regional investment - Public and private sector; infrastructure - Job creation - Sustainable livelihoods? - Tax revenue - How much tax revenue does forest carbon generate? Do smallholder farmers pay taxes? - Food, fuel, fiber prices - How are they affected by REDD+?
  • 34.
    “Hidden” costs: economic -Policymakers are increasingly aware of these costs - Examples: - Coalition for Rainforest Nations: $ outside forest sector - Guyana: $ for infrastructure, roads, health, entrepreneurship - Indonesia: $ for industrial development; healthcare model (?) - Danger: overloading the REDD+ Donkey (Nepstad 2010) - Focus on transition to LCD has expanded scope considerably - REDD+ becomes everything to everyone and disappoints
  • 35.
    Other costs: social/political/cultural REDD+reduces these relative to strict AD/RED model Social disruption • Subsistence farmers abandoning traditional practices; loss of knowledge? • More urban migration? Livelihood shifts? • Conservation refugees? Ecosystem disservices • Human-wildlife conflict (e.g. elephants, tigers) Option value • Rising food prices, REDD limits land use options for 30 years Market risk • Fate of species to be linked with carbon price swings? • Magic bullet (CCS, CO2 ejection system) Politics • International relations: Trade relationships (e.g. Japan and Philippines) • Local politics (Indonesia)
  • 36.
    Cost distribution • Alsoimportant to consider how costs are distributed • Different groups will be affected in different ways • Budgetary (implementation and transaction) costs to government; but smaller opportunity costs (tax revenue, government run enterprises) • Individual actors: mostly opportunity costs. Need to think about compensation
  • 37.
    Take home points •REDD+may be more expensive than we think, but that doesn’t mean it can’t work •For REDD+ to be effective, must be realistic and account for all costs •Decision-makers should have these costs in mind •Comprehensive tradeoff analysis incorporating an assessment of the less tangible costs and benefits
  • 38.
    Rhett A Butler rhett@mongabay.com mongabay.com
  • 39.
    Global economic models Top-downapproach based on dynamic economic models using aggregate variables (e.g. interest rates, population growth, consumption of energy or timber) Examples: Ohio State (US), Lawrence Berkeley Lab (US), IIASA (Austria) Good: incorporates global supply and demand trends Bad: imprecise, simplistic, not useful for national projections Global estimate: $1.70-38.00 for 50% reduction between 2005-2030, depending on assumptions and region
  • 40.
    Regional empirical models Bottom-upapproach using specific carbon density and per area opportunity cost based on actual NPV of land use Examples: Alternatives to Slash-and-Burn Program Good: Precise Bad: Misses global feedback (supply and demand trends) Global estimate: $2.51 mean (Boucher 2008, n=29)
  • 41.
    Opportunity Costs: Area-based Perarea approach using synthesis of sub-national and global analysis to generate global estimates Example: Greig-Gran 2006/2008: 8 major countries Good: Can be applied where forest carbon data is lacking Bad: Lower resolution than empirical, but based on sub-national opportunity costs; carbon data more generalized over forest areas Estimate: $2.76-8.58, $5.52 midpoint