Download to read offline


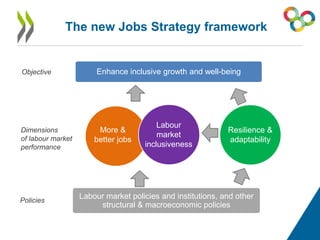
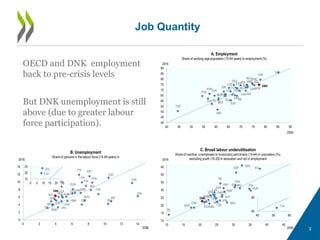
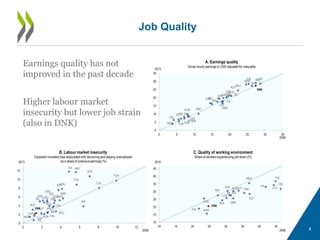
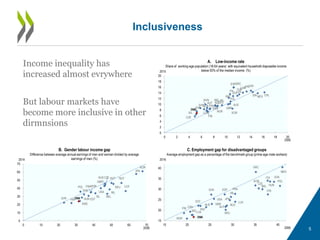
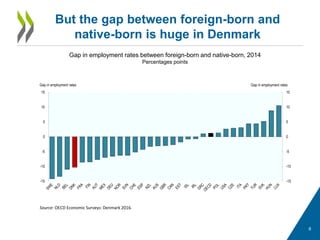
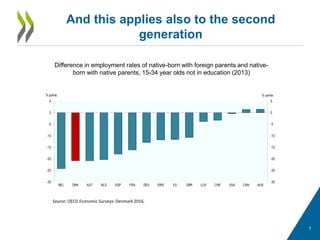
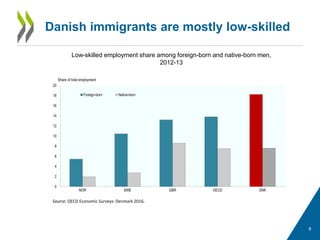
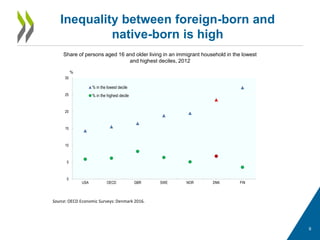
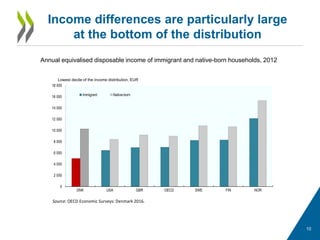
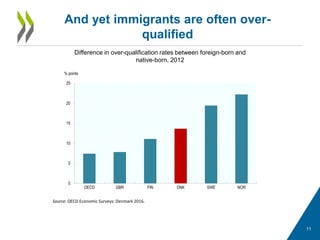
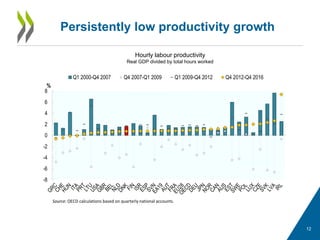

The document discusses recent labor market developments and reforms in OECD countries, specifically focusing on job quantity, quality, and inclusiveness. While employment levels in Denmark have returned to pre-crisis levels, unemployment remains high due to increased labor participation, and disparities exist between native-born and foreign-born workers. The document emphasizes the need for effective labor market policies to promote inclusivity and job quality amidst ongoing challenges like income inequality and labor market insecurity.


