Download to read offline


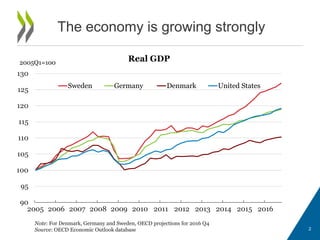
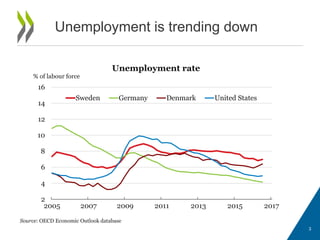
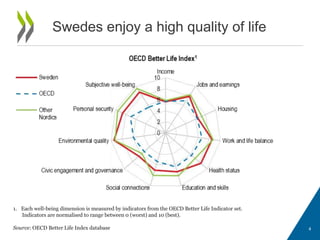
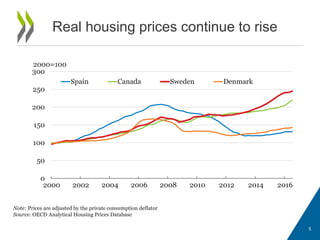
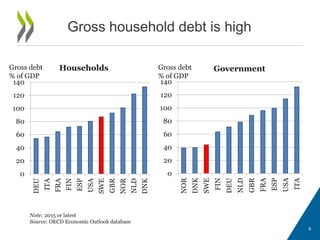
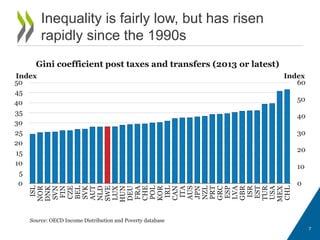
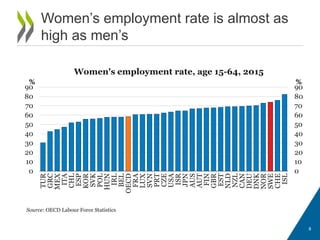
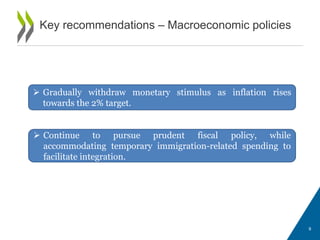


The 2017 OECD Economic Survey of Sweden highlights a strong economic growth, declining unemployment, and a generally high quality of life, though it notes rising real housing prices and high household debt. Key recommendations include gradual monetary policy adjustments, reforming housing taxation, and implementing measures to improve income inequality and gender equality. The report stresses the need for better integration policies for migrants and emphasizes enhancing support for vulnerable workers.


