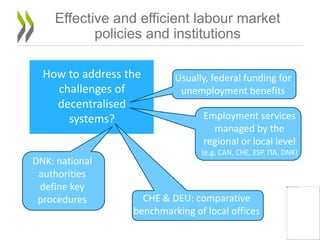
WHAT ROLE FOR PRIVATE
EMPLOYMENT SERVICES
ON THE LABOUR MARKET?
Stefano Scarpetta
Director of Employment, Labour and Social Affairs
OECD
CIETT World Employment Conference
28th May 2015, Rome
KEY CHALLENGES
2
The jobs recovery remains incomplete
Note: Countries shown by ascending order of the maximum gap (country-specific trough).
a) Aggregate of 15 OECD countries of the euro area.
Source: OECD calculations based on OECD Economic Outlook (database), http://dx.doi.org/10.1787/data-00688-en.
Employment gap
Percentage-points change in the employment rate since the onset of the crisis (Q4 2007)
-15
-10
-5
0
5
10
%
Maximum gap
(country-specific trough)
Current gap
(Q4 2014)
Projected gap
(Q4 2016)
Unemployment is declining but further
progress is required
Note: Countries shown by ascending order of the current unemployment rate (Q4 2014).
a) Aggregate of 15 OECD countries of the euro area.
Source: OECD calculations based on OECD Economic Outlook (database), http://dx.doi.org/10.1787/data-00688-en.
Unemployment rate
Percentage of the labour force
0
5
10
15
20
25
30
%
Current value
(Q4 2014)
Start of the crisis
(Q4 2007)
Projected value
(Q4 2016)
Long-term unemployment remains
persistently high
Note: Countries are shown in ascending order of the incidence of long-term unemployment in Q4 2014.
a) Data are not seasonally adjusted but smoothed using three-quarter moving averages. OECD is the weighted average of 33 OECD countries
excluding Chile.
b) 2014 for Israel.
Source: OECD calculations based on quarterly national labour force surveys.
Long-term unemployed (more than one year) as a percentage of total unemployed,a
Q4 2007-Q4 2014b
0
10
20
30
40
50
60
70
80
%
Q4 2007 Q4 2014
The NEET rate among youth has increased
Percentage of youth (aged 15-29)
a) OECD is the unweighted average of 32 countries (excluding Chile and Israel).
b) 2008 for Korea.
c) 2013 for Korea and the United States.
Source : OECD estimates based on national labour force surveys.
A. NEET rate in 2014c, selected OECD countries B. Percentage-points change in NEET rate,
2007b – 14c, selected OECD countries
0
5
10
15
20
25
30
35
40
45
%
Share of youth population inactive and not in education or training in
2014
Share of youth population unemployed and not in education or training
in 2014
NEET rate in 2007
-15
-10
-5
0
5
10
15
%
Share of youth population inactive and not in education or training
Share of youth population unemployed and not in education or training
NEET rate
Mismatch is prevalent whether by skills,
qualifications or field
7
Prevalence of skills, qualification and field-of-study mismatch
As a percentage of employed workers, 2012a,b
*The OECD Survey of Adult Skills only covered Flanders (BEL) and England/N. Ireland (GBR).
a) Workers are classified as mismatched by qualification if they have higher or lower qualifications than required by their job; workers are classified as
mismatched in terms of literacy skills if they have literacy proficiency exceeding or below that required in their job; workers are classified as mismatched by field
of study if they are working in an occupation that is not related to their field ofstudy.
b) Occupation is only available at the 2-digit level in the ISCO-08 classification for Australia. It is not possible to assess the extent of field of study mismatch
using the same definition used for other countries.
Source: OECD calculations based on the Survey of Adult Skills (PIAAC) 2012.
Many of the jobs destroyed as a result of the
crisis will not come back in the recovery
Annual percentage change, employees in the non-agricultural
business sector,a Q4 2007-Q4 2014
a) Manufacturing refers to mining, manufacturing and utilities and business services to trade, transport and communication, accommodation
and food services, financial services, real estate and business services.
Source: OECD calculations based on the European quarterly national accounts, on the Current Employment Statistics survey for the United
States and on the labour force survey for Japan.
Manufacturing Construction Business services Non-agricultural business sector
Euro area Japan United States
-5
-4
-3
-2
-1
0
1
2
3
%
-3
-2
-1
0
1
2
%
-10
-8
-6
-4
-2
0
2
4
%
Changes in the composition of employment
by type of contract
Annual percentage change in total employment by work status
in the euro area, Q4 2007-Q4 2014
Source: OECD calculations based on the European Labour Force Survey (EU-LFS).
-3
-2
-1
0
1
2
3
%
Permanent Temporary Self-employed Employed
KEY BUILDING BLOCKS FOR
FOSTERING MORE
INCLUSIVE AND RESILIENT
LABOUR MARKETS
10
The central role of the
Employment Service
11
Inclusive
and resilient
labour
markets
Opportunities
EmployabilityMotivation
Ensuring that
jobseekers have the
motivation to seek
work
Intensive case
management,
placement services and
participation in
measures to increase
employability
Addressing demand-side barriers and expanding
employment opportunities for jobseekers
Effective and efficient labour market
policies and institutions
12
How can the
employment services
achieve more with
less?
Which role can PPPs
and contracted out
services play?
How to address the
challenges of
decentralised
systems?
How to manage
performance and
ensure continuous
improvement and
learning?
Effective and efficient labour market
policies and institutions
13
How can the
employment
services achieve
more with less?
Transition to e-services
as one solution
(e.g. in EU, BRA, MEX, IND, DEU)
Saving costs, while also
increasing service
availability and accessibility?
E.g. though online benefit applications
(e.g. in AUS, GBR, TUR, ESP, and ITA)
Far-reaching
changes in NLD:
2/3 of local PES
offices closed
Effective and efficient labour market
policies and institutions
14
Which role can PPPs
and contracted out
services play?
Experience in AUS and
GBR shows …
Providers need to be
paid on the basis of
outcomes they
achieve
Accurate measurement
of performance is key
Most-effective
providers should
be able to expand
• Restrictions on private employment agencies relate to fees,
types of employment, licensing by the authorities, etc. have
been eased.
• Temporary work agency (TWA) assignments in OECD
countries represent a fraction of total employment, but
they account for large share of job starts in some countries.
 Significance of TWA work for the overall employment
services:
- Major source of job vacancies for the unemployed
- TWA assignments may convert to a permanent post, or provide
work experience that allows other placements e.g. “reverse
marketing” of the hard-to-place unemployed
- There is a risk of cycling between short-term contracts and
benefits
15
Private agencies in the labour market
• PES often outsource a high percentage of their budget for individual jobseeker
services, e.g. job clubs, training.
• Where PES outsource the individual case management function, PrEAs tend to
be one of the successful bidder.
• Outsourcing of case management is structured variably, e.g.
– Targeted on all registered unemployed vs. specific groups;
– Voluntary jobseeker participation and freedom to switch provider at any
time vs. assignment or multi-year commitment to the provider
– Purchaser defines provider processes vs. provider autonomy (“black box”)
– Fixed fees vs. payment for results; e.g. payment for 6-month job outcomes
• Since the mid-2000s, the recourse to outsourced case management has
increased in some countriers, UK (Work Programme, 2011) and Ireland
(JobPath, 2015). There is also some non-OECD business (Saudi Arabia).
16
Experiences with outsourcing
Effective and efficient labour market
policies and institutions
17
How to address the
challenges of
decentralised
systems?
Usually, federal funding for
unemployment benefits
Employment services
managed by the
regional or local level
(e.g. CAN, CHE, ESP, ITA, DNK)
CHE & DEU: comparative
benchmarking of local offices
DNK: national
authorities
define key
procedures
Effective and efficient labour market
policies and institutions
18
How to manage
performance and
ensure continuous
improvement and
learning?
Performance indicators
should show relation
between inputs and
final outcomes
In OECD, expenditure
on PES and ALMPs
ranges from 0.01% to
2.1% of GDP
Evaluation is crucial to ensure
effective and efficient spending
Test locally and
evaluate before
national rollout
19
Thank you
Read more about our work
Email: stefano.scarpetta@oecd.org
Website: www.oecd.org/employment/outlook
Follow us on Twitter : @OECD_Social

What role for private employment services on the labour market? By Stefano Scarpetta

  • 1.
    WHAT ROLE FORPRIVATE EMPLOYMENT SERVICES ON THE LABOUR MARKET? Stefano Scarpetta Director of Employment, Labour and Social Affairs OECD CIETT World Employment Conference 28th May 2015, Rome
  • 2.
  • 3.
    The jobs recoveryremains incomplete Note: Countries shown by ascending order of the maximum gap (country-specific trough). a) Aggregate of 15 OECD countries of the euro area. Source: OECD calculations based on OECD Economic Outlook (database), http://dx.doi.org/10.1787/data-00688-en. Employment gap Percentage-points change in the employment rate since the onset of the crisis (Q4 2007) -15 -10 -5 0 5 10 % Maximum gap (country-specific trough) Current gap (Q4 2014) Projected gap (Q4 2016)
  • 4.
    Unemployment is decliningbut further progress is required Note: Countries shown by ascending order of the current unemployment rate (Q4 2014). a) Aggregate of 15 OECD countries of the euro area. Source: OECD calculations based on OECD Economic Outlook (database), http://dx.doi.org/10.1787/data-00688-en. Unemployment rate Percentage of the labour force 0 5 10 15 20 25 30 % Current value (Q4 2014) Start of the crisis (Q4 2007) Projected value (Q4 2016)
  • 5.
    Long-term unemployment remains persistentlyhigh Note: Countries are shown in ascending order of the incidence of long-term unemployment in Q4 2014. a) Data are not seasonally adjusted but smoothed using three-quarter moving averages. OECD is the weighted average of 33 OECD countries excluding Chile. b) 2014 for Israel. Source: OECD calculations based on quarterly national labour force surveys. Long-term unemployed (more than one year) as a percentage of total unemployed,a Q4 2007-Q4 2014b 0 10 20 30 40 50 60 70 80 % Q4 2007 Q4 2014
  • 6.
    The NEET rateamong youth has increased Percentage of youth (aged 15-29) a) OECD is the unweighted average of 32 countries (excluding Chile and Israel). b) 2008 for Korea. c) 2013 for Korea and the United States. Source : OECD estimates based on national labour force surveys. A. NEET rate in 2014c, selected OECD countries B. Percentage-points change in NEET rate, 2007b – 14c, selected OECD countries 0 5 10 15 20 25 30 35 40 45 % Share of youth population inactive and not in education or training in 2014 Share of youth population unemployed and not in education or training in 2014 NEET rate in 2007 -15 -10 -5 0 5 10 15 % Share of youth population inactive and not in education or training Share of youth population unemployed and not in education or training NEET rate
  • 7.
    Mismatch is prevalentwhether by skills, qualifications or field 7 Prevalence of skills, qualification and field-of-study mismatch As a percentage of employed workers, 2012a,b *The OECD Survey of Adult Skills only covered Flanders (BEL) and England/N. Ireland (GBR). a) Workers are classified as mismatched by qualification if they have higher or lower qualifications than required by their job; workers are classified as mismatched in terms of literacy skills if they have literacy proficiency exceeding or below that required in their job; workers are classified as mismatched by field of study if they are working in an occupation that is not related to their field ofstudy. b) Occupation is only available at the 2-digit level in the ISCO-08 classification for Australia. It is not possible to assess the extent of field of study mismatch using the same definition used for other countries. Source: OECD calculations based on the Survey of Adult Skills (PIAAC) 2012.
  • 8.
    Many of thejobs destroyed as a result of the crisis will not come back in the recovery Annual percentage change, employees in the non-agricultural business sector,a Q4 2007-Q4 2014 a) Manufacturing refers to mining, manufacturing and utilities and business services to trade, transport and communication, accommodation and food services, financial services, real estate and business services. Source: OECD calculations based on the European quarterly national accounts, on the Current Employment Statistics survey for the United States and on the labour force survey for Japan. Manufacturing Construction Business services Non-agricultural business sector Euro area Japan United States -5 -4 -3 -2 -1 0 1 2 3 % -3 -2 -1 0 1 2 % -10 -8 -6 -4 -2 0 2 4 %
  • 9.
    Changes in thecomposition of employment by type of contract Annual percentage change in total employment by work status in the euro area, Q4 2007-Q4 2014 Source: OECD calculations based on the European Labour Force Survey (EU-LFS). -3 -2 -1 0 1 2 3 % Permanent Temporary Self-employed Employed
  • 10.
    KEY BUILDING BLOCKSFOR FOSTERING MORE INCLUSIVE AND RESILIENT LABOUR MARKETS 10
  • 11.
    The central roleof the Employment Service 11 Inclusive and resilient labour markets Opportunities EmployabilityMotivation Ensuring that jobseekers have the motivation to seek work Intensive case management, placement services and participation in measures to increase employability Addressing demand-side barriers and expanding employment opportunities for jobseekers
  • 12.
    Effective and efficientlabour market policies and institutions 12 How can the employment services achieve more with less? Which role can PPPs and contracted out services play? How to address the challenges of decentralised systems? How to manage performance and ensure continuous improvement and learning?
  • 13.
    Effective and efficientlabour market policies and institutions 13 How can the employment services achieve more with less? Transition to e-services as one solution (e.g. in EU, BRA, MEX, IND, DEU) Saving costs, while also increasing service availability and accessibility? E.g. though online benefit applications (e.g. in AUS, GBR, TUR, ESP, and ITA) Far-reaching changes in NLD: 2/3 of local PES offices closed
  • 14.
    Effective and efficientlabour market policies and institutions 14 Which role can PPPs and contracted out services play? Experience in AUS and GBR shows … Providers need to be paid on the basis of outcomes they achieve Accurate measurement of performance is key Most-effective providers should be able to expand
  • 15.
    • Restrictions onprivate employment agencies relate to fees, types of employment, licensing by the authorities, etc. have been eased. • Temporary work agency (TWA) assignments in OECD countries represent a fraction of total employment, but they account for large share of job starts in some countries.  Significance of TWA work for the overall employment services: - Major source of job vacancies for the unemployed - TWA assignments may convert to a permanent post, or provide work experience that allows other placements e.g. “reverse marketing” of the hard-to-place unemployed - There is a risk of cycling between short-term contracts and benefits 15 Private agencies in the labour market
  • 16.
    • PES oftenoutsource a high percentage of their budget for individual jobseeker services, e.g. job clubs, training. • Where PES outsource the individual case management function, PrEAs tend to be one of the successful bidder. • Outsourcing of case management is structured variably, e.g. – Targeted on all registered unemployed vs. specific groups; – Voluntary jobseeker participation and freedom to switch provider at any time vs. assignment or multi-year commitment to the provider – Purchaser defines provider processes vs. provider autonomy (“black box”) – Fixed fees vs. payment for results; e.g. payment for 6-month job outcomes • Since the mid-2000s, the recourse to outsourced case management has increased in some countriers, UK (Work Programme, 2011) and Ireland (JobPath, 2015). There is also some non-OECD business (Saudi Arabia). 16 Experiences with outsourcing
  • 17.
    Effective and efficientlabour market policies and institutions 17 How to address the challenges of decentralised systems? Usually, federal funding for unemployment benefits Employment services managed by the regional or local level (e.g. CAN, CHE, ESP, ITA, DNK) CHE & DEU: comparative benchmarking of local offices DNK: national authorities define key procedures
  • 18.
    Effective and efficientlabour market policies and institutions 18 How to manage performance and ensure continuous improvement and learning? Performance indicators should show relation between inputs and final outcomes In OECD, expenditure on PES and ALMPs ranges from 0.01% to 2.1% of GDP Evaluation is crucial to ensure effective and efficient spending Test locally and evaluate before national rollout
  • 19.
    19 Thank you Read moreabout our work Email: stefano.scarpetta@oecd.org Website: www.oecd.org/employment/outlook Follow us on Twitter : @OECD_Social

Editor's Notes

  • #16 ILO Private Employment Agencies Convention of 1997 was in force from 2000. Temporary work agency (TWA) assignments may represent close to half of all job starts when each assignment counts as a separate job start (in some countries, multiple assignments may take place under a single contract between the worker and the TWA).
  • #17 Australian model is successful due to: Accurate measurement of jobseeker characteristics and provider performance, with multiple providers operating on a “level playing field”. Ineffective providers are eliminated in the re-contracting process (not heavy leveraging of outcome fees on results). The purchaser supervises and audits basic processes, but leaving providers control over the remaining services. provider autonomy. Evaluations, provider feedback, contribute to development of the model. For other countries, some “contestability” of public services seems justified: Avoiding the pitfalls of privatisation (incorrectly-set incentives, absence of real competition) - outsourced provision may benchmark public services, allow learning from the private sector Avoiding the pitfalls of government bureaucracy (rigidity/inertia, strategic infighting): “insourcing” may reduce transaction costs and the risk of “gaming” behaviour