Download to read offline
![11
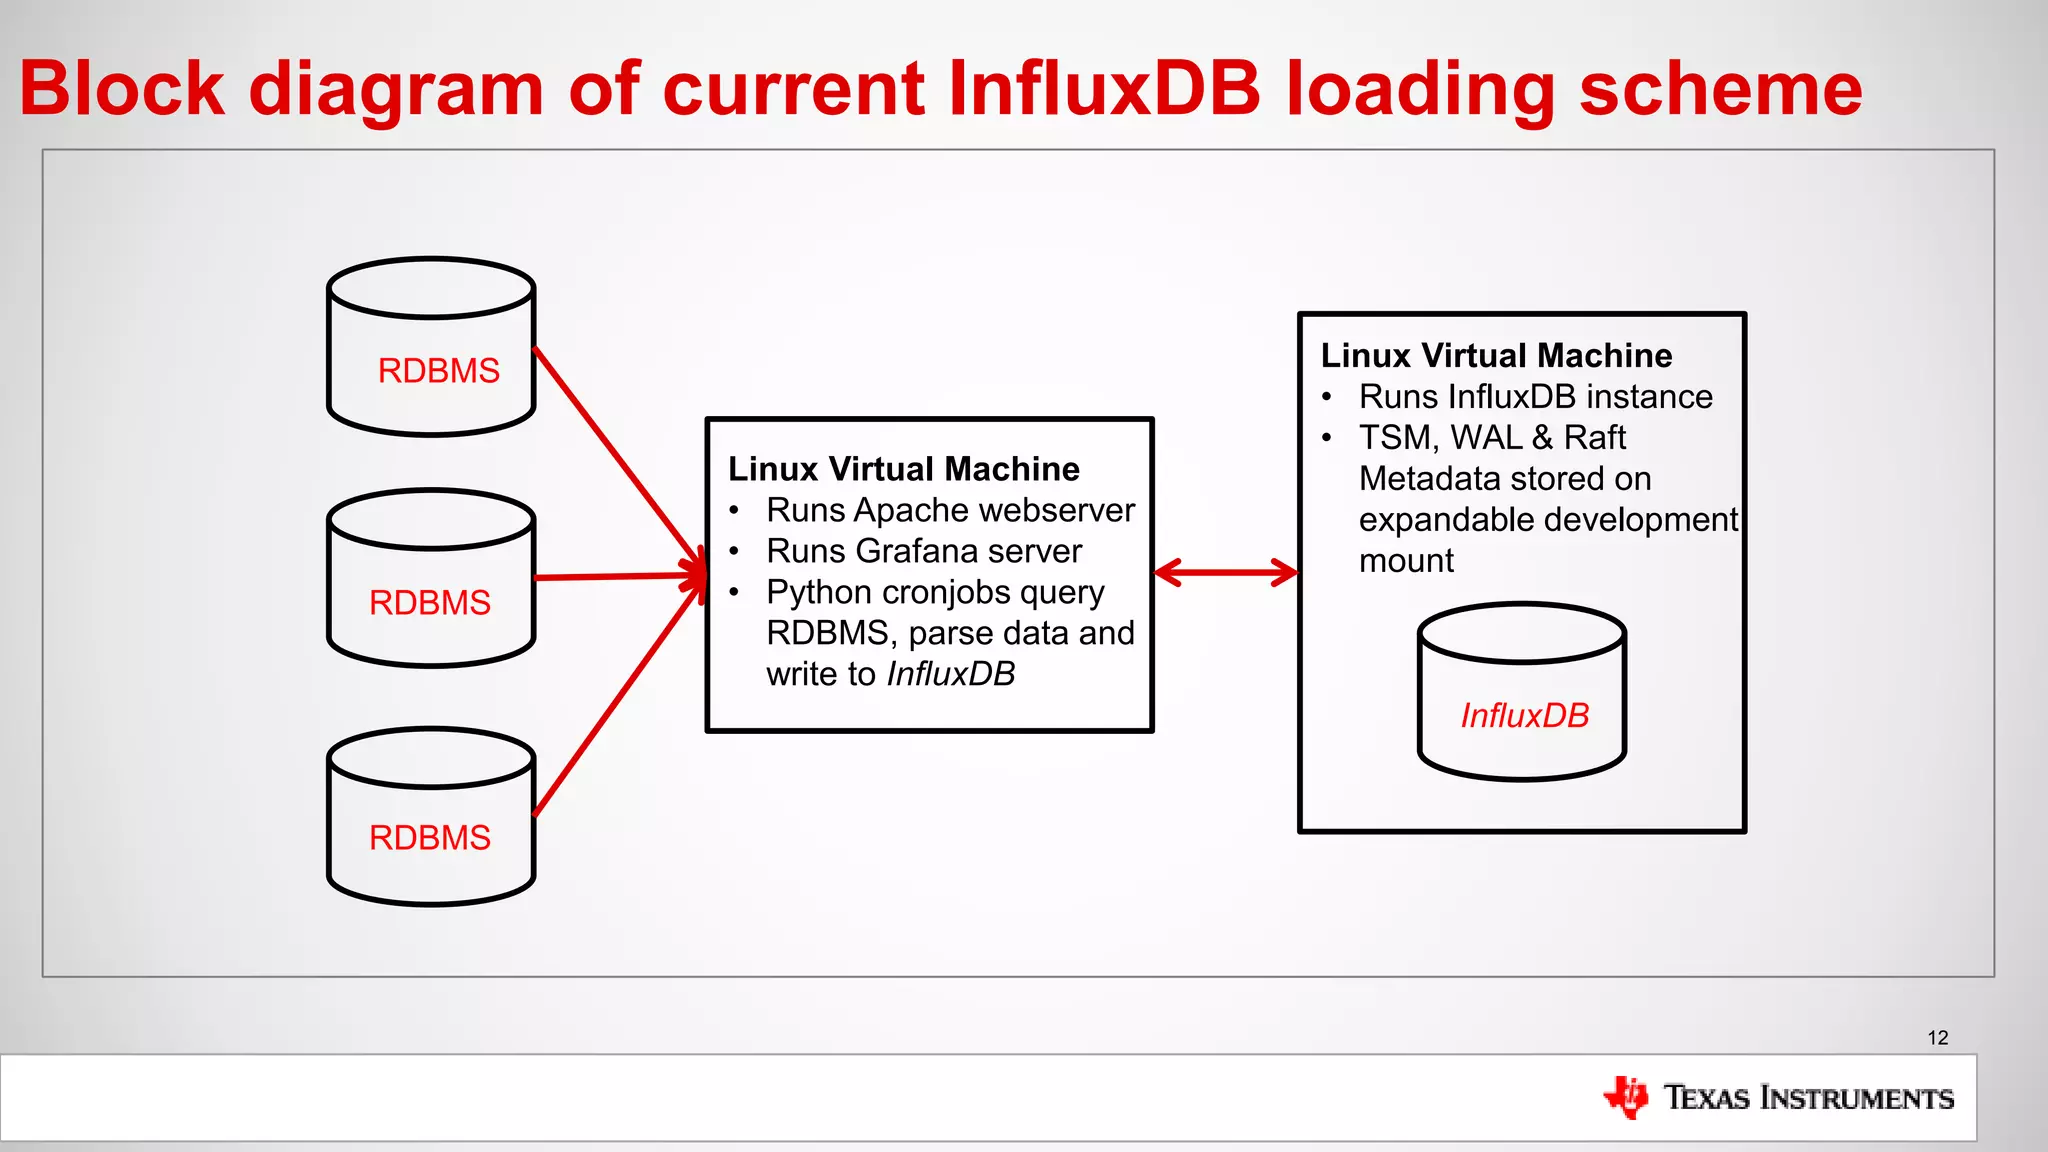
Current installation setup
Setup:
• Single InfluxDB instance (OSS) installed on Linux VM
• TSM, WAL & Raft data all stored on expandable development mount
• Loader scripts executed via cronjob, query RDBMS and load InfluxDB
• Data is filtered, sanitized & calculated if possible during initial query
• Grafana server running on separate Linux VM instance
• Apache web server is reverse proxied to point to Grafana server on port 3000
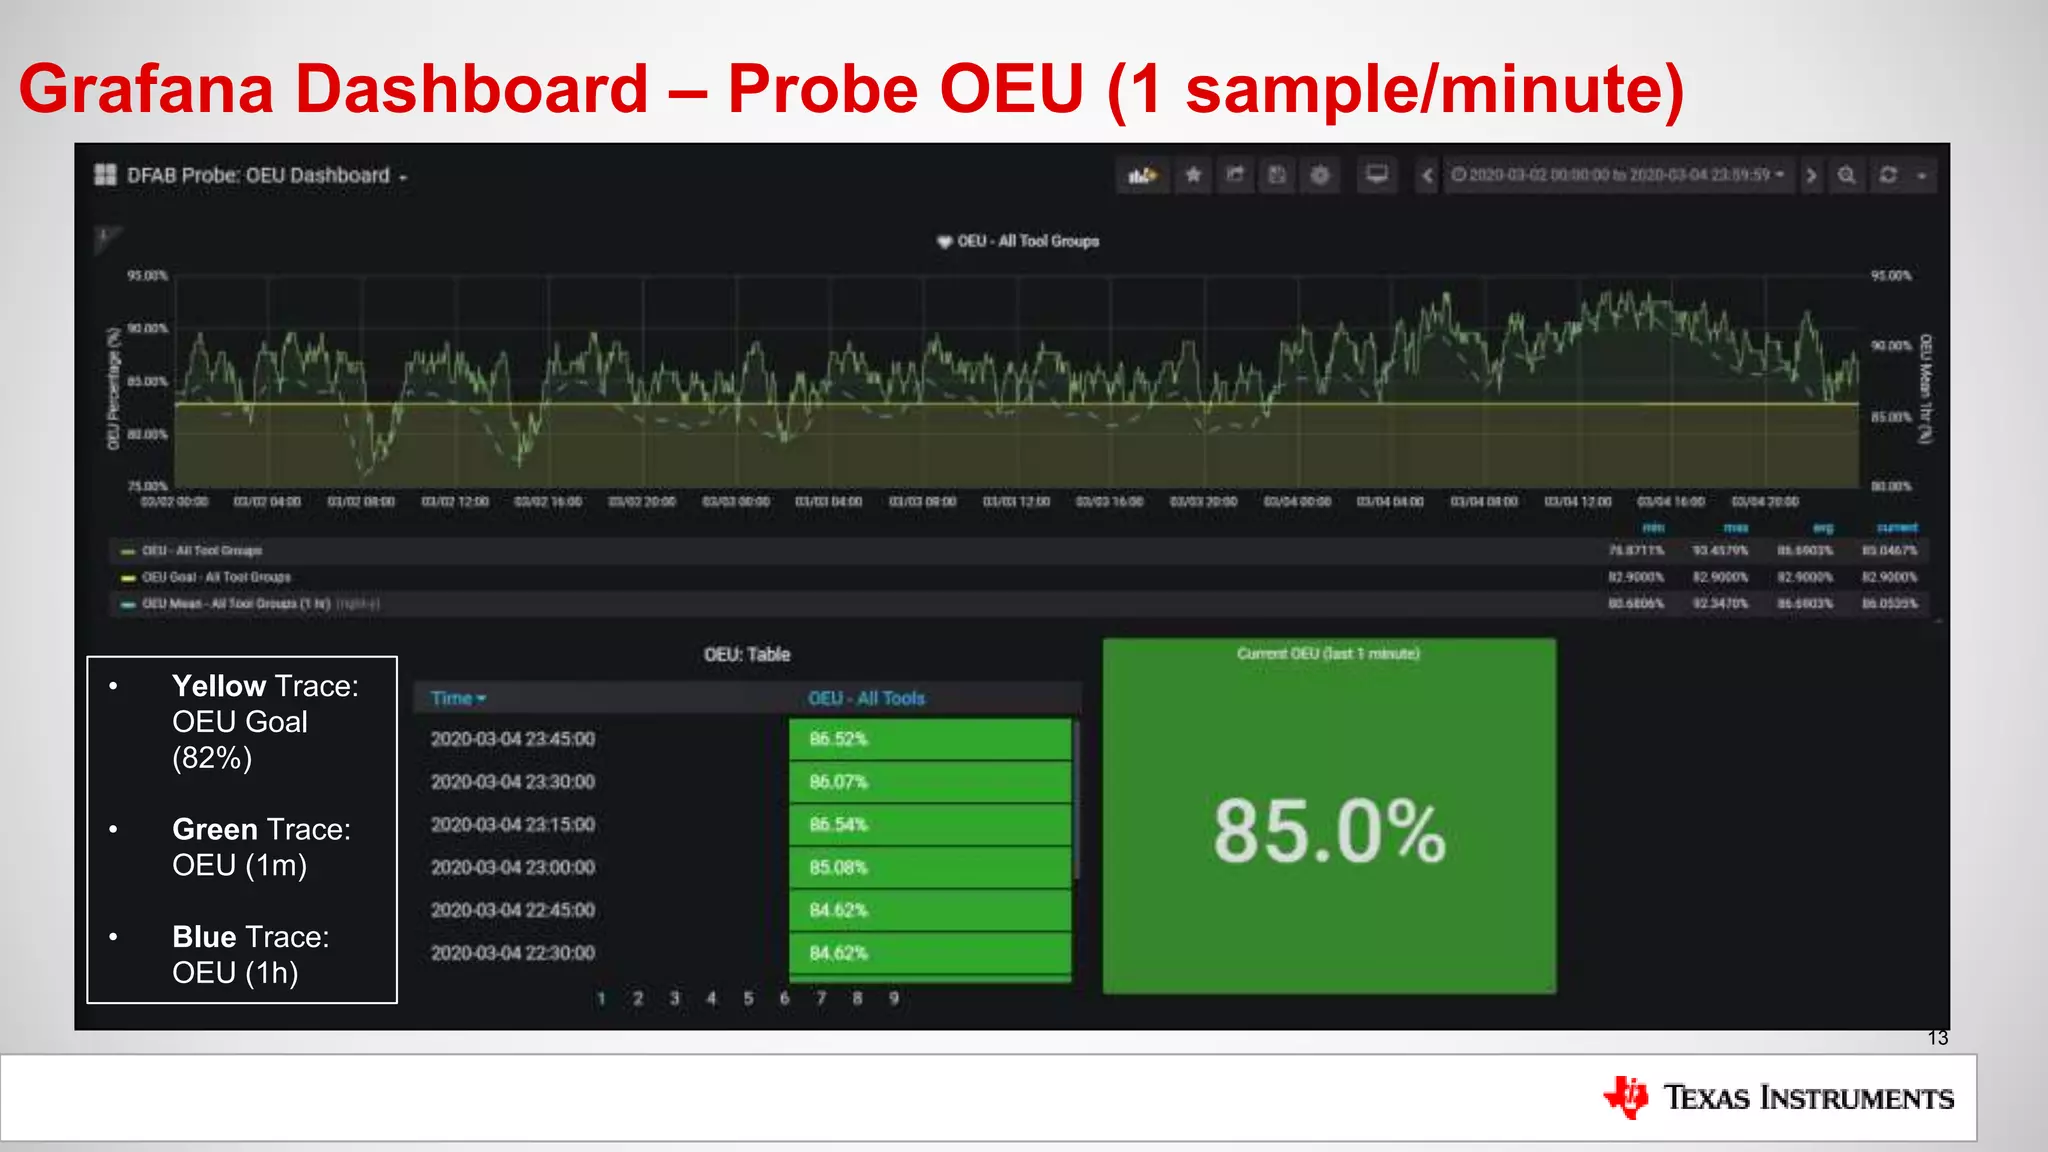
Metrics being collected:
• OEU (Overall Equipment Utilization: [Time Testing Good Wafers / Total Time])
• Ao (Tool Availability: [Uptime / Total Time])
• Occurrences of States (States define the state of our tools, PM’s, PROD, etc..)
• Cycle Time (how long it takes for a wafer to be tested [device tag])](https://image.slidesharecdn.com/tiinfluxpresentation2020-05-26mhinkle-200605234935/75/How-Texas-Instruments-Uses-InfluxDB-to-Uphold-Product-Standards-and-to-Improve-Efficiencies-11-2048.jpg)


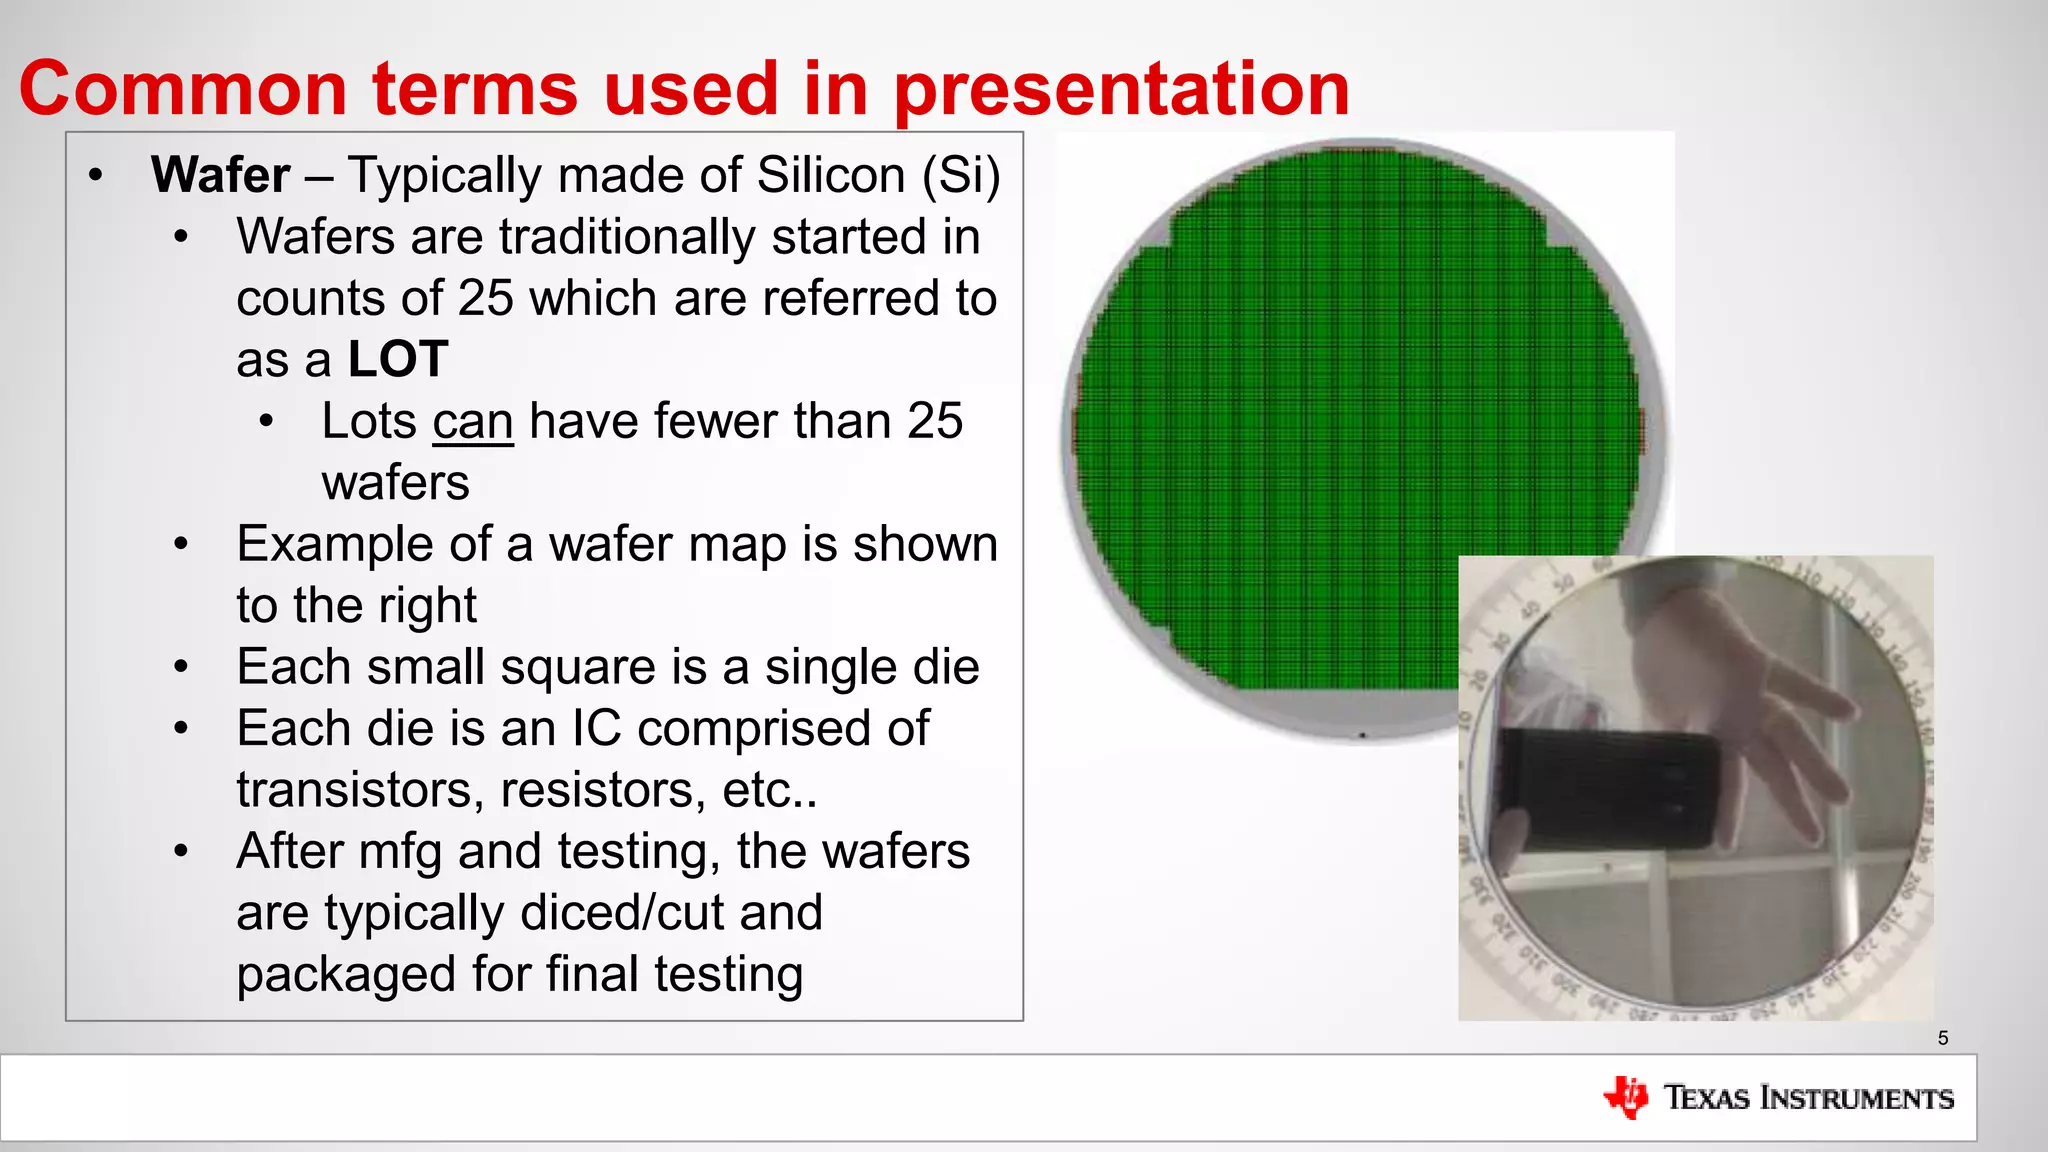
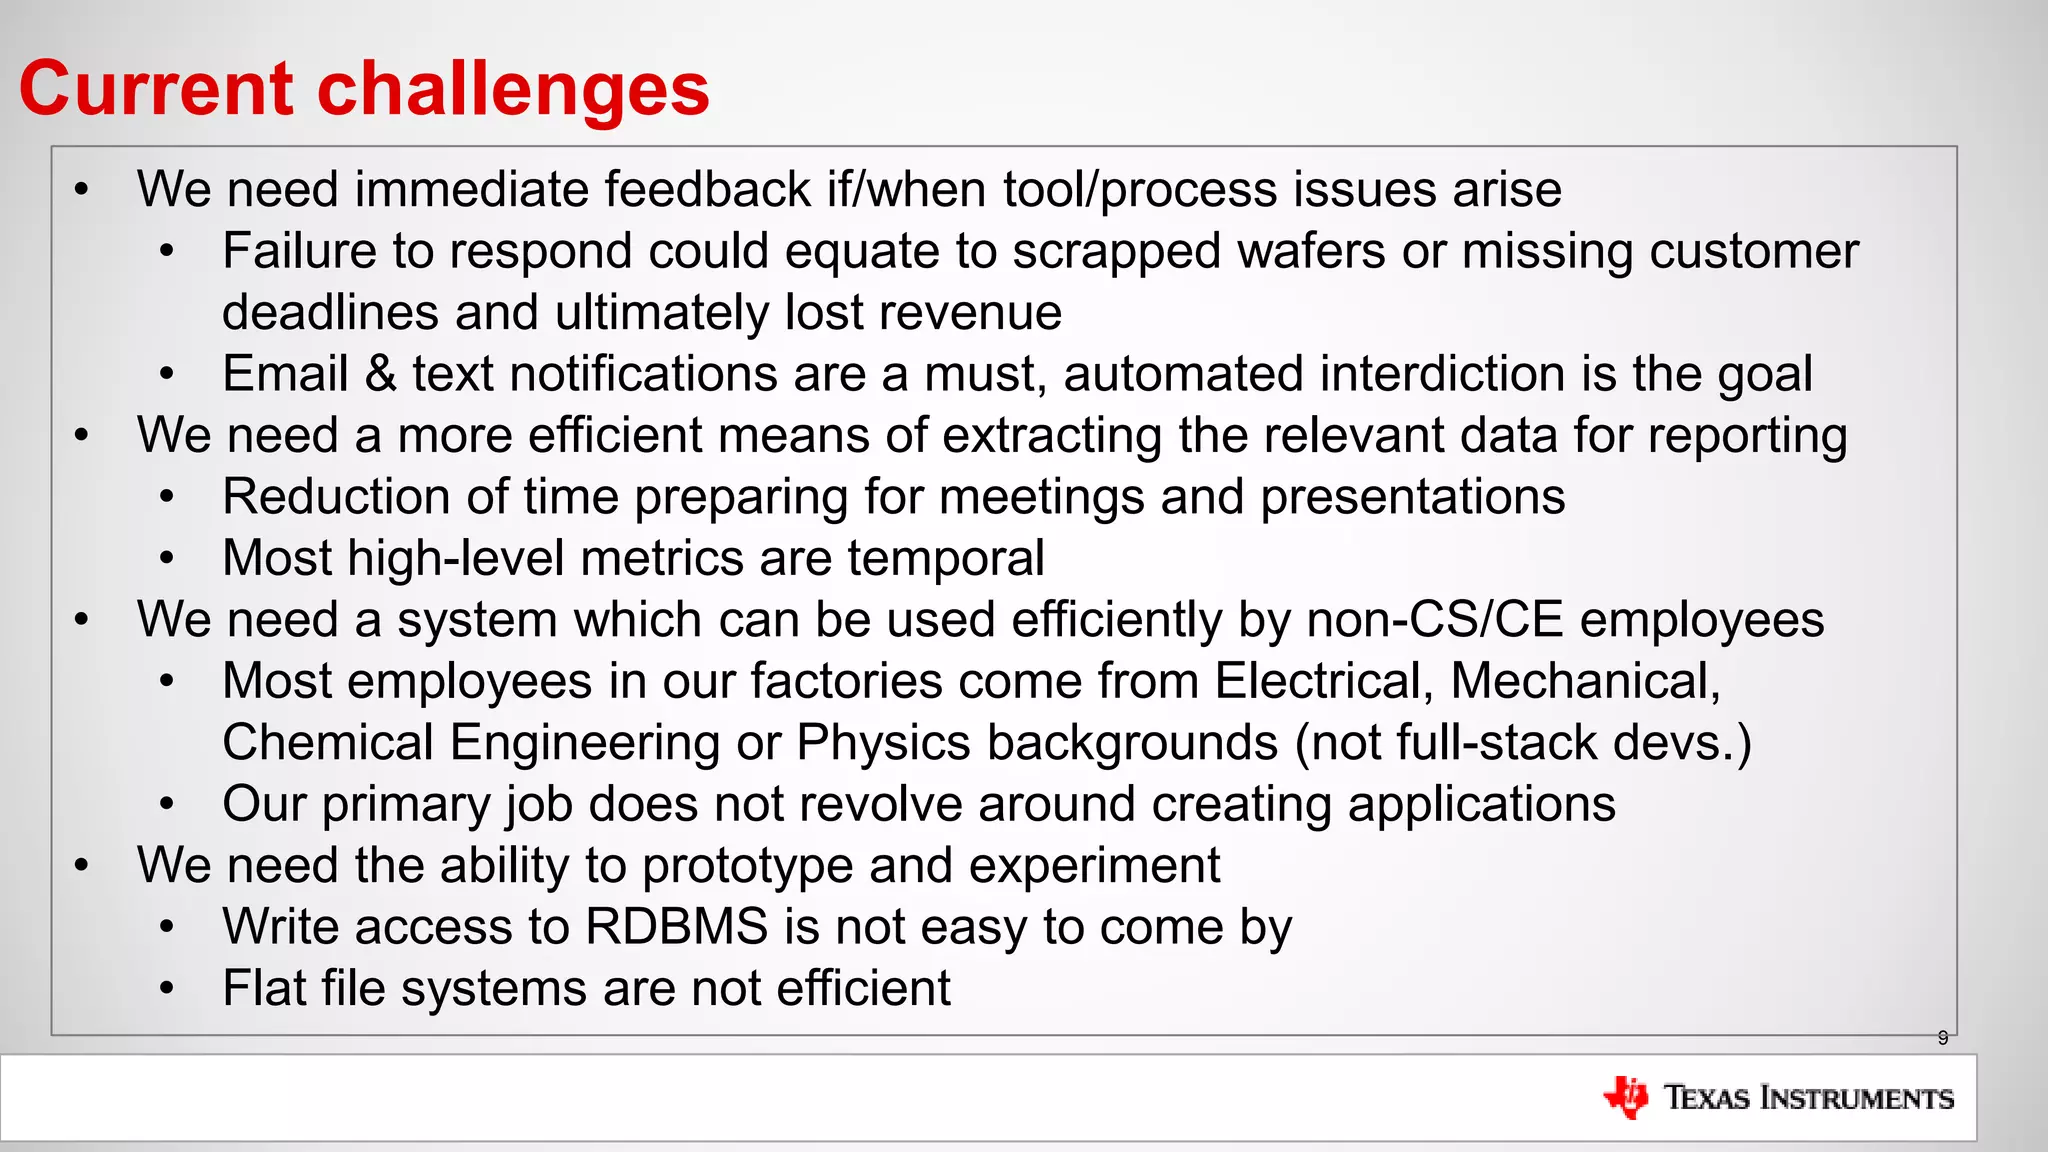
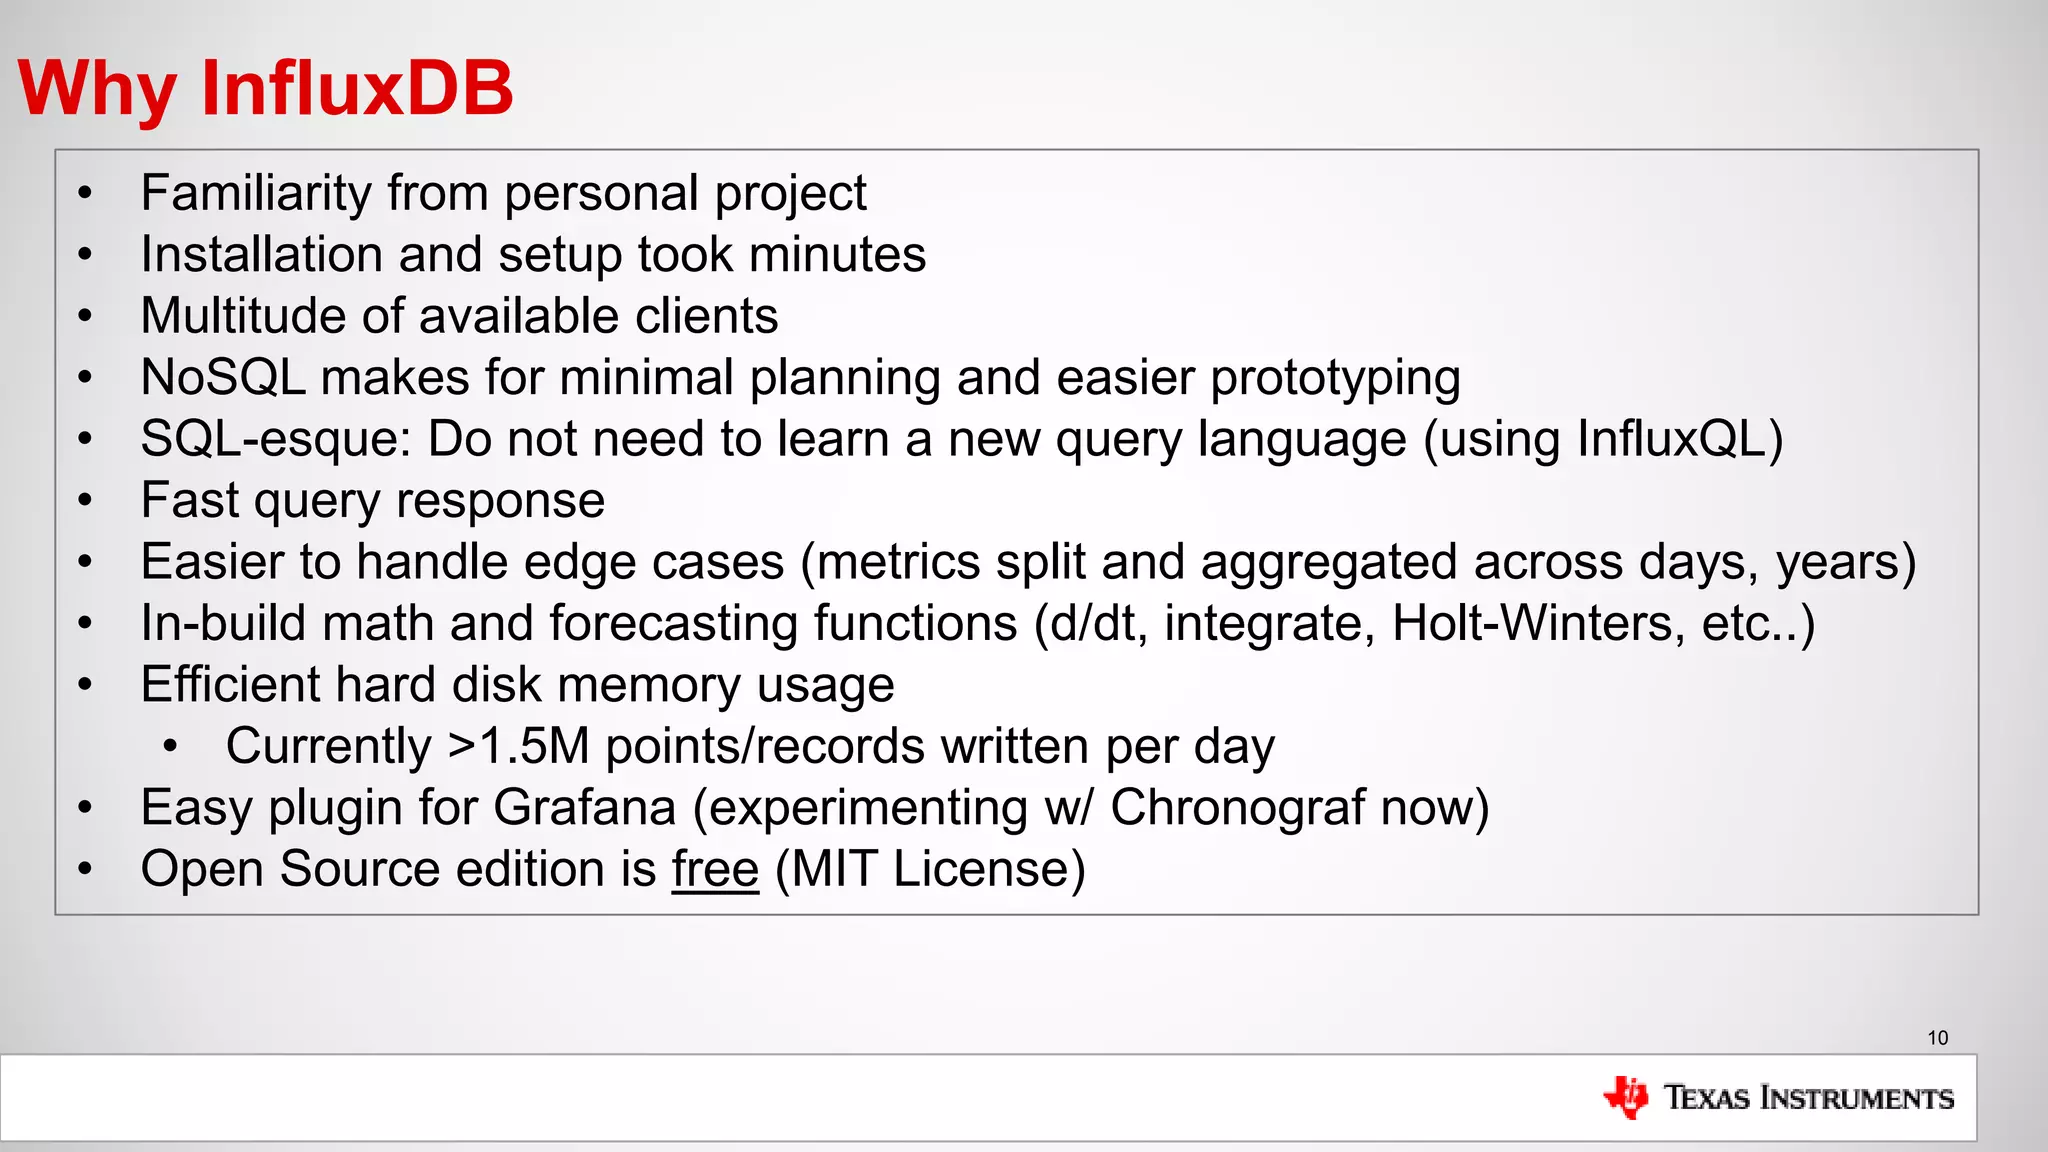
The document is a presentation by Mike Hinkle from Texas Instruments, detailing their use of InfluxDB for managing semiconductor manufacturing data. It covers the importance of accurate data for decision-making, the current challenges faced, and the reasons for choosing InfluxDB including ease of setup and performance. The presentation also discusses examples of data utilization, implemented dashboards, and future plans for data modeling and forecasting.

![Tanny Ng, Nadeem Syed [WP Engine] | How WP Engine Transformed Monitoring Into...](https://cdn.slidesharecdn.com/ss_thumbnails/influxday-wpefinal-211025192844-thumbnail.jpg?width=640&height=640&fit=bounds)


![Paul Dix [InfluxData] | InfluxDays Keynote: Future of InfluxDB | InfluxDays N...](https://cdn.slidesharecdn.com/ss_thumbnails/2021-10-26whytimeseries-influxdaysna-211026005527-thumbnail.jpg?width=640&height=640&fit=bounds)


![Paul Dix [InfluxData] The Journey of InfluxDB | InfluxDays 2022](https://cdn.slidesharecdn.com/ss_thumbnails/2022-11-02influxdays-journeyofinfluxdb-221020214252-ff7c76c5-thumbnail.jpg?width=640&height=640&fit=bounds)


![Ward Bowman [PTC] | ThingWorx Long-Term Data Storage with InfluxDB | InfluxDa...](https://cdn.slidesharecdn.com/ss_thumbnails/influxdays-221027185325-5d2f430b-thumbnail.jpg?width=640&height=640&fit=bounds)


![Steinkamp, Clifford [InfluxData] | Welcome to InfluxDays 2022 - Day 2 | Influ...](https://cdn.slidesharecdn.com/ss_thumbnails/influxdays2022welcometoday2-221020215815-c8463942-thumbnail.jpg?width=640&height=640&fit=bounds)
![Steinkamp, Clifford [InfluxData] | Closing Thoughts Day 1 | InfluxDays 2022](https://cdn.slidesharecdn.com/ss_thumbnails/influxdays2022closingthoughtsday1-221020215301-f8040e1f-thumbnail.jpg?width=640&height=640&fit=bounds)

![Steinkamp, Clifford [InfluxData] | Closing Thoughts | InfluxDays 2022](https://cdn.slidesharecdn.com/ss_thumbnails/influxdays2022closingthoughtsday2-221020220104-abde55ea-thumbnail.jpg?width=640&height=640&fit=bounds)
![Scott Anderson [InfluxData] | New & Upcoming Flux Features | InfluxDays 2022](https://cdn.slidesharecdn.com/ss_thumbnails/influxdays2022-fluxupdates-scott-221021210238-9d323cba-thumbnail.jpg?width=640&height=640&fit=bounds)


