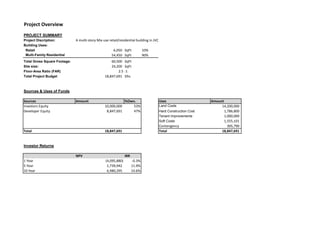
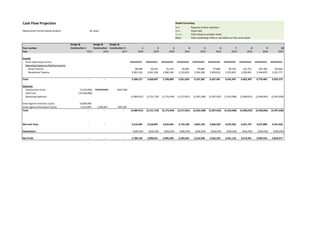
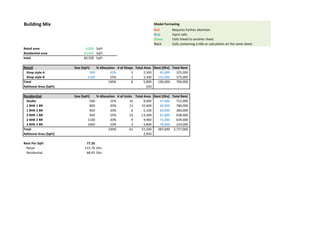
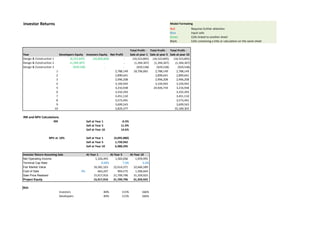
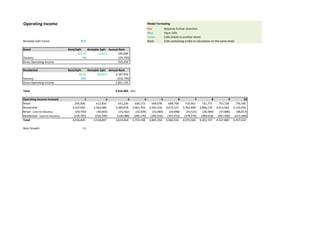
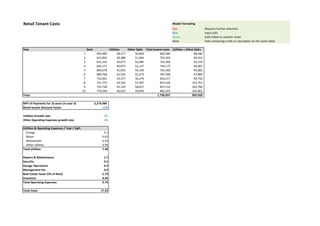
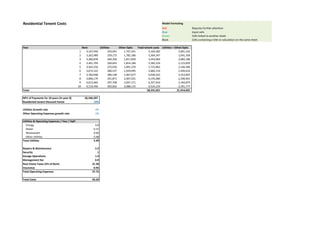
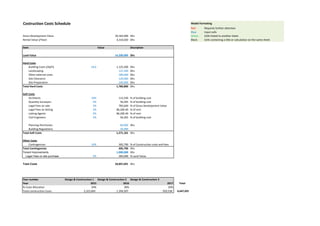
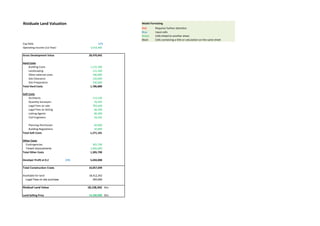
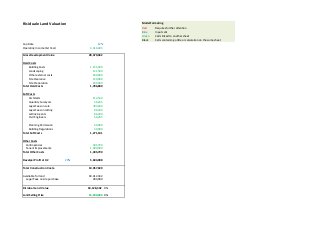
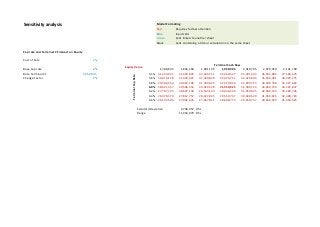
This document provides an overview and financial model for a proposed real estate development project in Dubai. The project involves constructing a mixed-use retail/residential building. Key assumptions in the analysis include net operating income projections and capitalization rates. Special attention should be given to these assumptions as they are important factors in determining the financial feasibility of the project over a 10-year holding period. The model outlines sources and uses of funds, cash flow projections, returns for investors, and other development costs and metrics.
Real Estate Development Case PresentationDaniel Mandel
In one week, my group (Nurulauni Saniman, Maike Zhang, Yuhua Zhou) and I analyzed a development case with an existing office building and adjacent vacant land for development. Group created a 20-minute investor presentation analyzing the macro economy, purchase price of entire site and adjacent vacant land, and optimization of the capital structure to reduce the weighted average cost of capital for the project.
This document provides a detailed overview of the financial analysis and underwriting process for a typical real estate development project, and highlights important features such as Performance Metrics, Capitalization, Sources & Uses, Development Budget, Annual & Quarterly Cash Flows / Proforma, Monte Carlo Simulation, Waterfall Structure, and more.
This document provides an overview on real estate development and financial feasibility.
Topics Covered:
Development - Process, Ecosystem, Model, Flowchart, Risk vs Value, Development Risk, Development Cycle, Key Categories of Tasks
Economic Feasibility - Financial, Development Budget, Static Analysis, Loan-to-Cost, Debt Cover & Default Ratio Approaches, Detailed Proforma & Analysis
As the markets for real estate usually remain stable in many areas of in the world, opportunities continue to exist for the development of real estate projects. This lecture is designed to analyze the real estate development process primarily from the perspective of the developer. The lecture concentrates on the development of a real estate project from its conceptual ideas until the operational start-up, and from the initiation of the concept designs until the project is defined.
The lecture examines most of the phases of the development process, from idea inception through studying the various available options for the use of the lands and estimating the projects' costs and income to determine the best and optimum commercial use of the lands. This includes an overview about the development of the project's financial feasibility of real estate development, which involves the identification and evaluation of critical assumptions related to the creation, construction, and operation of economically viable commercial real estate projects.
The lecture is introductory in scope and assumes attendants have little or no experience with the development process.
An understanding of the real estate development process benefits not only potential developers, but investors, lenders, builders, public sector participants, and end-users of the products as well.
This real estate financial consulting book lists / exhibits some of the advisory work we typically do.
• Evaluation of Lease, Sublease, Purchase, or Sale-Leaseback
• Occupancy Cost Analysis
• Lease Comparison Analysis
• Space Consolidation Scenarios
• Cash and GAAP Perspectives
• Impact of Purchase or Lease Transactions on Financial Statements
• Comparison of Portfolio Value vs. Outstanding Obligation
• Portfolio Analysis vs. Business Strategy
• Own vs. Lease Decision
• Operating vs. Capital Lease
• Evaluation and Assessment of Investment Opportunities
• Valuation of Individual Assets or Real Estate Portfolios
• Development Analysis and Project Financial Feasibility
• Optimal Holding Period Analysis
• Benchmarking Based on Key Measurement Metrics
• Detailed Sensitivity or What If Analysis
• Review and Preparation of Lease Abstracts
• Preparation of Detailed Cash Flows
• Market Research
Before you start writing your real estate business plan, spend as much time as you can to reading through some samples of real estate business plans. Not only will that give you a good idea of what it is you’re aiming for, but it will also show you the different sections that different entrepreneurs include and the language they use to write about themselves and their future plans.
We have created a sample real estate business plan example for you to get a good idea about how a perfect real estate business plan should look like and what details you should include in your business plan.
Source: https://upmetrics.co/template/real-estate-business-plan-example
Real Estate PowerPoint Templates Bundle PowerPoint Presentation Slides SlideTeam
Are you a property agent? Do not have a plan from where to begin? Here SlideTeam has come up with content ready real estate PowerPoint templates bundle presentation slides that will provide necessary information to land developers. Our predesigned property development PowerPoint templates are fully editable and can be customized according to your needs. This professionally created land expansion PPT presentation comprises variety of slides like market snapshot, executive summary, major investments, average price, property demands & opportunities, market summary, market analysis infographic, sales growth, home sales, price index, land mortgage rates, REO & short sales, investments, leaseholder, land tenure etc. You can use this property market analysis PowerPoint presentation for topics like real property, residential premises, residential trends, land development, premises investing, real estate economics, land appraisal, estate industry overview etc. Clinch your business deal with our real estate PowerPoint templates bundle presentation templates. Hurry up! Download now. Hearts burst with joy due to our Real Estate PowerPoint Templates Bundle PowerPoint Presentation Slides. Folks experience immense bliss.
Real Estate Acquisition Case PresentationDaniel Mandel
In one week, my group (Nurulauni Saniman, Maike Zhang, Yuhua Zhou) and I analyzed an acquisition case and created a 15-minute investor presentation with a complicated Excel distribution waterfall. Presentation highlighted an analysis of linkages, market, sources and uses, financial returns, sensitivity analysis, and risk mitigation.
What You Really Need to Know about Commercial Real Estate UnderwritingColleen Beck-Domanico
Prudent real estate underwriting uses quantitative analysis. However, real estate math isn't just a black‐and‐white exercise, nor is it simple formula lending. Many qualitative judgments feed into your estimates of property cash flow, coverage, and value that come from quantitative analysis. Your analysis should be completed in the context of the qualitative credit risk assessment. Doing so will avoid over‐advancing on potentially weak property cash flow streams that will jeopardize repayment prospects and bank portfolio quality. This presentation looks at quantitative analysis and integrating qualitative factors; underwriting guidelines; regulatory guidance; and value and cash flow analyses.
Fixed Capital Analysis PowerPoint Presentation SlidesSlideTeam
Presenting this set of slides with name - Fixed Capital Analysis Powerpoint Presentation Slides. This deck consists of total of fourty slides. It has PPT slides highlighting important topics of Fixed Capital Analysis Powerpoint Presentation Slides. This deck comprises of amazing visuals with thoroughly researched content. Each template is well crafted and designed by our PowerPoint experts. Our designers have included all the necessary PowerPoint layouts in this deck. From icons to graphs, this PPT deck has it all. The best part is that these templates are easily customizable. Just click the DOWNLOAD button shown below. Edit the colour, text, font size, add or delete the content as per the requirement. Download this deck now and engage your audience with this ready made presentation.
A very basic business plan that includes my version of a profit and loss statement. The California High Speed Rail Authority Dec. 9 Business Plan failed to include a P&L statement.
In this report, we go through the financial data of fiscal year 2019 and the latest news and developments for the company to determine if it is currently fairly valued in the market.
Intel - stock valuation and analysis model - imran almalehImran Almaleh
A stock valuation and analysis financial model for selecting stocks based on a value investment strategy.
Diving into many criteria such as profitability, leverage, free cash flow and DCF analysis.
a collection of the latest scientific answers to the Origins of Life and the Universe.
* Critical thinking and Skepticism
* The cosmic Calendar
* The Big Bang
* Star Formation
* Star Death
* Earth Formation
* Life Formation
* Life Evolution
* Human Evolution
* Human History
NO1 Uk Rohani Baba In Karachi Bangali Baba Karachi Online Amil Baba WorldWide...Amil baba
Contact with Dawood Bhai Just call on +92322-6382012 and we'll help you. We'll solve all your problems within 12 to 24 hours and with 101% guarantee and with astrology systematic. If you want to take any personal or professional advice then also you can call us on +92322-6382012 , ONLINE LOVE PROBLEM & Other all types of Daily Life Problem's.Then CALL or WHATSAPP us on +92322-6382012 and Get all these problems solutions here by Amil Baba DAWOOD BANGALI
#vashikaranspecialist #astrologer #palmistry #amliyaat #taweez #manpasandshadi #horoscope #spiritual #lovelife #lovespell #marriagespell#aamilbabainpakistan #amilbabainkarachi #powerfullblackmagicspell #kalajadumantarspecialist #realamilbaba #AmilbabainPakistan #astrologerincanada #astrologerindubai #lovespellsmaster #kalajaduspecialist #lovespellsthatwork #aamilbabainlahore#blackmagicformarriage #aamilbaba #kalajadu #kalailam #taweez #wazifaexpert #jadumantar #vashikaranspecialist #astrologer #palmistry #amliyaat #taweez #manpasandshadi #horoscope #spiritual #lovelife #lovespell #marriagespell#aamilbabainpakistan #amilbabainkarachi #powerfullblackmagicspell #kalajadumantarspecialist #realamilbaba #AmilbabainPakistan #astrologerincanada #astrologerindubai #lovespellsmaster #kalajaduspecialist #lovespellsthatwork #aamilbabainlahore #blackmagicforlove #blackmagicformarriage #aamilbaba #kalajadu #kalailam #taweez #wazifaexpert #jadumantar #vashikaranspecialist #astrologer #palmistry #amliyaat #taweez #manpasandshadi #horoscope #spiritual #lovelife #lovespell #marriagespell#aamilbabainpakistan #amilbabainkarachi #powerfullblackmagicspell #kalajadumantarspecialist #realamilbaba #AmilbabainPakistan #astrologerincanada #astrologerindubai #lovespellsmaster #kalajaduspecialist #lovespellsthatwork #aamilbabainlahore #Amilbabainuk #amilbabainspain #amilbabaindubai #Amilbabainnorway #amilbabainkrachi #amilbabainlahore #amilbabaingujranwalan #amilbabainislamabad
how to sell pi coins in South Korea profitably.DOT TECH
Yes. You can sell your pi network coins in South Korea or any other country, by finding a verified pi merchant
What is a verified pi merchant?
Since pi network is not launched yet on any exchange, the only way you can sell pi coins is by selling to a verified pi merchant, and this is because pi network is not launched yet on any exchange and no pre-sale or ico offerings Is done on pi.
Since there is no pre-sale, the only way exchanges can get pi is by buying from miners. So a pi merchant facilitates these transactions by acting as a bridge for both transactions.
How can i find a pi vendor/merchant?
Well for those who haven't traded with a pi merchant or who don't already have one. I will leave the telegram id of my personal pi merchant who i trade pi with.
Tele gram: @Pi_vendor_247
#pi #sell #nigeria #pinetwork #picoins #sellpi #Nigerian #tradepi #pinetworkcoins #sellmypi
Resume
• Real GDP growth slowed down due to problems with access to electricity caused by the destruction of manoeuvrable electricity generation by Russian drones and missiles.
• Exports and imports continued growing due to better logistics through the Ukrainian sea corridor and road. Polish farmers and drivers stopped blocking borders at the end of April.
• In April, both the Tax and Customs Services over-executed the revenue plan. Moreover, the NBU transferred twice the planned profit to the budget.
• The European side approved the Ukraine Plan, which the government adopted to determine indicators for the Ukraine Facility. That approval will allow Ukraine to receive a EUR 1.9 bn loan from the EU in May. At the same time, the EU provided Ukraine with a EUR 1.5 bn loan in April, as the government fulfilled five indicators under the Ukraine Plan.
• The USA has finally approved an aid package for Ukraine, which includes USD 7.8 bn of budget support; however, the conditions and timing of the assistance are still unknown.
• As in March, annual consumer inflation amounted to 3.2% yoy in April.
• At the April monetary policy meeting, the NBU again reduced the key policy rate from 14.5% to 13.5% per annum.
• Over the past four weeks, the hryvnia exchange rate has stabilized in the UAH 39-40 per USD range.
Turin Startup Ecosystem 2024 - Ricerca sulle Startup e il Sistema dell'Innov...Quotidiano Piemontese
Turin Startup Ecosystem 2024
Una ricerca de il Club degli Investitori, in collaborazione con ToTeM Torino Tech Map e con il supporto della ESCP Business School e di Growth Capital
Introduction to Indian Financial System ()Avanish Goel
The financial system of a country is an important tool for economic development of the country, as it helps in creation of wealth by linking savings with investments.
It facilitates the flow of funds form the households (savers) to business firms (investors) to aid in wealth creation and development of both the parties
Latino Buying Power - May 2024 Presentation for Latino CaucusDanay Escanaverino
Unlock the potential of Latino Buying Power with this in-depth SlideShare presentation. Explore how the Latino consumer market is transforming the American economy, driven by their significant buying power, entrepreneurial contributions, and growing influence across various sectors.
**Key Sections Covered:**
1. **Economic Impact:** Understand the profound economic impact of Latino consumers on the U.S. economy. Discover how their increasing purchasing power is fueling growth in key industries and contributing to national economic prosperity.
2. **Buying Power:** Dive into detailed analyses of Latino buying power, including its growth trends, key drivers, and projections for the future. Learn how this influential group’s spending habits are shaping market dynamics and creating opportunities for businesses.
3. **Entrepreneurial Contributions:** Explore the entrepreneurial spirit within the Latino community. Examine how Latino-owned businesses are thriving and contributing to job creation, innovation, and economic diversification.
4. **Workforce Statistics:** Gain insights into the role of Latino workers in the American labor market. Review statistics on employment rates, occupational distribution, and the economic contributions of Latino professionals across various industries.
5. **Media Consumption:** Understand the media consumption habits of Latino audiences. Discover their preferences for digital platforms, television, radio, and social media. Learn how these consumption patterns are influencing advertising strategies and media content.
6. **Education:** Examine the educational achievements and challenges within the Latino community. Review statistics on enrollment, graduation rates, and fields of study. Understand the implications of education on economic mobility and workforce readiness.
7. **Home Ownership:** Explore trends in Latino home ownership. Understand the factors driving home buying decisions, the challenges faced by Latino homeowners, and the impact of home ownership on community stability and economic growth.
This SlideShare provides valuable insights for marketers, business owners, policymakers, and anyone interested in the economic influence of the Latino community. By understanding the various facets of Latino buying power, you can effectively engage with this dynamic and growing market segment.
Equip yourself with the knowledge to leverage Latino buying power, tap into their entrepreneurial spirit, and connect with their unique cultural and consumer preferences. Drive your business success by embracing the economic potential of Latino consumers.
**Keywords:** Latino buying power, economic impact, entrepreneurial contributions, workforce statistics, media consumption, education, home ownership, Latino market, Hispanic buying power, Latino purchasing power.
how can I sell pi coins after successfully completing KYCDOT TECH
Pi coins is not launched yet in any exchange 💱 this means it's not swappable, the current pi displaying on coin market cap is the iou version of pi. And you can learn all about that on my previous post.
RIGHT NOW THE ONLY WAY you can sell pi coins is through verified pi merchants. A pi merchant is someone who buys pi coins and resell them to exchanges and crypto whales. Looking forward to hold massive quantities of pi coins before the mainnet launch.
This is because pi network is not doing any pre-sale or ico offerings, the only way to get my coins is from buying from miners. So a merchant facilitates the transactions between the miners and these exchanges holding pi.
I and my friends has sold more than 6000 pi coins successfully with this method. I will be happy to share the contact of my personal pi merchant. The one i trade with, if you have your own merchant you can trade with them. For those who are new.
Message: @Pi_vendor_247 on telegram.
I wouldn't advise you selling all percentage of the pi coins. Leave at least a before so its a win win during open mainnet. Have a nice day pioneers ♥️
#kyc #mainnet #picoins #pi #sellpi #piwallet
#pinetwork
NO1 Uk Divorce problem uk all amil baba in karachi,lahore,pakistan talaq ka m...Amil Baba Dawood bangali
Contact with Dawood Bhai Just call on +92322-6382012 and we'll help you. We'll solve all your problems within 12 to 24 hours and with 101% guarantee and with astrology systematic. If you want to take any personal or professional advice then also you can call us on +92322-6382012 , ONLINE LOVE PROBLEM & Other all types of Daily Life Problem's.Then CALL or WHATSAPP us on +92322-6382012 and Get all these problems solutions here by Amil Baba DAWOOD BANGALI
#vashikaranspecialist #astrologer #palmistry #amliyaat #taweez #manpasandshadi #horoscope #spiritual #lovelife #lovespell #marriagespell#aamilbabainpakistan #amilbabainkarachi #powerfullblackmagicspell #kalajadumantarspecialist #realamilbaba #AmilbabainPakistan #astrologerincanada #astrologerindubai #lovespellsmaster #kalajaduspecialist #lovespellsthatwork #aamilbabainlahore#blackmagicformarriage #aamilbaba #kalajadu #kalailam #taweez #wazifaexpert #jadumantar #vashikaranspecialist #astrologer #palmistry #amliyaat #taweez #manpasandshadi #horoscope #spiritual #lovelife #lovespell #marriagespell#aamilbabainpakistan #amilbabainkarachi #powerfullblackmagicspell #kalajadumantarspecialist #realamilbaba #AmilbabainPakistan #astrologerincanada #astrologerindubai #lovespellsmaster #kalajaduspecialist #lovespellsthatwork #aamilbabainlahore #blackmagicforlove #blackmagicformarriage #aamilbaba #kalajadu #kalailam #taweez #wazifaexpert #jadumantar #vashikaranspecialist #astrologer #palmistry #amliyaat #taweez #manpasandshadi #horoscope #spiritual #lovelife #lovespell #marriagespell#aamilbabainpakistan #amilbabainkarachi #powerfullblackmagicspell #kalajadumantarspecialist #realamilbaba #AmilbabainPakistan #astrologerincanada #astrologerindubai #lovespellsmaster #kalajaduspecialist #lovespellsthatwork #aamilbabainlahore #Amilbabainuk #amilbabainspain #amilbabaindubai #Amilbabainnorway #amilbabainkrachi #amilbabainlahore #amilbabaingujranwalan #amilbabainislamabad
The secret way to sell pi coins effortlessly.DOT TECH
Well as we all know pi isn't launched yet. But you can still sell your pi coins effortlessly because some whales in China are interested in holding massive pi coins. And they are willing to pay good money for it. If you are interested in selling I will leave a contact for you. Just telegram this number below. I sold about 3000 pi coins to him and he paid me immediately.
Telegram: @Pi_vendor_247
when will pi network coin be available on crypto exchange.DOT TECH
There is no set date for when Pi coins will enter the market.
However, the developers are working hard to get them released as soon as possible.
Once they are available, users will be able to exchange other cryptocurrencies for Pi coins on designated exchanges.
But for now the only way to sell your pi coins is through verified pi vendor.
Here is the telegram contact of my personal pi vendor
@Pi_vendor_247
Even tho Pi network is not listed on any exchange yet.
Buying/Selling or investing in pi network coins is highly possible through the help of vendors. You can buy from vendors[ buy directly from the pi network miners and resell it]. I will leave the telegram contact of my personal vendor.
@Pi_vendor_247
how to sell pi coins in all Africa Countries.DOT TECH
Yes. You can sell your pi network for other cryptocurrencies like Bitcoin, usdt , Ethereum and other currencies And this is done easily with the help from a pi merchant.
What is a pi merchant ?
Since pi is not launched yet in any exchange. The only way you can sell right now is through merchants.
A verified Pi merchant is someone who buys pi network coins from miners and resell them to investors looking forward to hold massive quantities of pi coins before mainnet launch in 2026.
I will leave the telegram contact of my personal pi merchant to trade with.
@Pi_vendor_247
Empowering the Unbanked: The Vital Role of NBFCs in Promoting Financial Inclu...Vighnesh Shashtri
In India, financial inclusion remains a critical challenge, with a significant portion of the population still unbanked. Non-Banking Financial Companies (NBFCs) have emerged as key players in bridging this gap by providing financial services to those often overlooked by traditional banking institutions. This article delves into how NBFCs are fostering financial inclusion and empowering the unbanked.
The European Unemployment Puzzle: implications from population agingGRAPE
We study the link between the evolving age structure of the working population and unemployment. We build a large new Keynesian OLG model with a realistic age structure, labor market frictions, sticky prices, and aggregate shocks. Once calibrated to the European economy, we quantify the extent to which demographic changes over the last three decades have contributed to the decline of the unemployment rate. Our findings yield important implications for the future evolution of unemployment given the anticipated further aging of the working population in Europe. We also quantify the implications for optimal monetary policy: lowering inflation volatility becomes less costly in terms of GDP and unemployment volatility, which hints that optimal monetary policy may be more hawkish in an aging society. Finally, our results also propose a partial reversal of the European-US unemployment puzzle due to the fact that the share of young workers is expected to remain robust in the US.
Falcon stands out as a top-tier P2P Invoice Discounting platform in India, bridging esteemed blue-chip companies and eager investors. Our goal is to transform the investment landscape in India by establishing a comprehensive destination for borrowers and investors with diverse profiles and needs, all while minimizing risk. What sets Falcon apart is the elimination of intermediaries such as commercial banks and depository institutions, allowing investors to enjoy higher yields.
1. Real Estate Development Financial Model
Author: Imran Almaleh
Date: August 23, 2014
Jumeirah Village Circle, Dubai
Phone: (971) 52 940 6601
Email: imranalmaleh@gmail.com
Summary
The purpose of this spreadsheet model is to determine the financial feasibility of a development project of
the subject property for a 10 year holding period. The uncertainty in this model lies in the many construction
& economic factors. The most important assumptions in this analysis are the Net Operating Income
assumptions (Annual Gross Rent, Vacany, and Operating Expenses) and the Cap Rates. Special attention
should be given to these assumptions.
Keywords: Real Estate, Property Valuation, Dubai
2. Project Overview
PROJECT SUMMARY
Project Discription: A multi-story Mix use retail/residential building in JVC
Building Uses:
Retail 6,050 SqFt 10%
Multi-Family Residential 54,450 SqFt 90%
Total Gross Square Footage: 60,500 SqFt
Site size: 24,200 SqFt
Floor-Area Ratio (FAR) 2.5 :1
Total Project Budget 18,847,691 Dhs
Sources & Uses of Funds
Sources Amount %Own. Uses Amount
Investors Equity 10,000,000 53% Land Costs 14,200,000
Developer Equity 8,847,691 47% Hard Construction Cost 1,786,800
Tenant Improvements 1,000,000
Soft Costs 1,555,101
Contengency 305,790
Total 18,847,691 Total 18,847,691
Investor Returns
NPV IRR
1 Year (4,095,880) -0.3%
5 Year 1,739,942 11.9%
10 Year 6,980,295 14.6%
3. Cash Flow Projection Model Formating
Red Requires further attention
Depreciation Period (whole project) 30 years Blue Input cells
Green Cells linked to another sheet
Black Cells containing a title or calculation on the same sheet
Year number
Design &
Construction 1
Design &
Construction 2
Design &
Construction 3 1 2 3 4 5 6 7 8 9 10
Year 2015 2016 2017 2018 2019 2020 2021 2022 2023 2024 2025 2026 2027
Income
Gross Operating Income 3,416,405 3,518,897 3,624,464 3,733,198 3,845,194 3,960,550 4,079,366 4,201,747 4,327,800 4,457,634
Operating Expences (Paid by tenents)
Retail Tenents 88,580 90,352 92,159 94,002 95,882 97,800 99,756 101,751 103,786 105,862
Residential Tenents 2,001,332 2,041,358 2,082,186 2,123,829 2,166,306 2,209,632 2,253,825 2,298,901 2,344,879 2,391,777
Total - - - 5,506,317 5,650,607 5,798,809 5,951,029 6,107,382 6,267,981 6,432,947 6,602,399 6,776,465 6,955,272
Expenses
Construction Costs (2,323,845) (1,394,307) (929,538)
Land Cost (14,200,000)
Operating Expenses (2,089,912) (2,131,710) (2,174,344) (2,217,831) (2,262,188) (2,307,432) (2,353,580) (2,400,652) (2,448,665) (2,497,638)
Draw Against Investors Equity 10,000,000
Draw Against Developers Equity 6,523,845 1,394,307 929,538
Total - - - (2,089,912) (2,131,710) (2,174,344) (2,217,831) (2,262,188) (2,307,432) (2,353,580) (2,400,652) (2,448,665) (2,497,638)
Net Cash Flow - - - 3,416,405 3,518,897 3,624,464 3,733,198 3,845,194 3,960,550 4,079,366 4,201,747 4,327,800 4,457,634
Depritiation (628,256) (628,256) (628,256) (628,256) (628,256) (628,256) (628,256) (628,256) (628,256) (628,256)
Net Profit - - - 2,788,149 2,890,641 2,996,208 3,104,942 3,216,938 3,332,293 3,451,110 3,573,491 3,699,543 3,829,377
4. Building Mix Model Formating
Red Requires further attention
Blue Input cells
Green Cells linked to another sheet
Black Cells containing a title or calculation on the same sheet
Retail area 6,050 SqFt
Residential area 54,450 SqFt
total 60,500 SqFt
Retail Size (SqFt) % Allocation # of Shops Total Area Rent (Dhs) Total Rent
Shop style A 500 45% 5 2,500 65,000 325,000
Shop style B 1100 55% 3 3,300 125,000 375,000
Total 100% 8 5,800 190,000 700,000
Aditional Area (SqFt) 250
Residential Size (SqFt) % Allocation # of Units Total Area Rent (Dhs) Total Rent
Studio 500 15% 16 8,000 47,000 752,000
1 BHK 1 BR 800 20% 13 10,400 60,000 780,000
1 BHK 2 BR 850 10% 6 5,100 64,000 384,000
2 BHK 1 BR 950 25% 14 13,300 67,000 938,000
2 BHK 2 BR 1100 20% 9 9,900 71,000 639,000
3 BHK 2 BR 1600 10% 3 4,800 78,000 234,000
Total 100% 61 51,500 387,000 3,727,000
Aditional Area (SqFt) 2,950
Rent Per SqFt 77.26
Retail 115.70 Dhs
Residential 68.45 Dhs
5. Investor Returns Model Formating
Red Requires further attention
Blue Input cells
Green Cells linked to another sheet
Black Cells containing a title or calculation on the same sheet
Year Developers Equity Investors Equity Net Profit
Total Profit -
Sale at year 1
Total Profit -
Sale at year 5
Total Profit -
Sale at year 10
Design & Construction 1 (6,523,845) (10,000,000) - (16,523,845) (16,523,845) (16,523,845)
Design & Construction 2 (1,394,307) - - (1,394,307) (1,394,307) (1,394,307)
Design & Construction 3 (929,538) - - (929,538) (929,538) (929,538)
1 2,788,149 18,706,065 2,788,149 2,788,149
2 2,890,641 2,890,641 2,890,641
3 2,996,208 2,996,208 2,996,208
4 3,104,942 3,104,942 3,104,942
5 3,216,938 24,926,734 3,216,938
6 3,332,293 3,332,293
7 3,451,110 3,451,110
8 3,573,491 3,573,491
9 3,699,543 3,699,543
10 3,829,377 35,189,303
IRR and NPV Calculations
IRR Sell at Year 1 -0.3%
Sell at Year 5 11.9%
Sell at Year 10 14.6%
NPV at 10% Sell at Year 1 (4,095,880)
Sell at Year 5 1,739,942
Sell at Year 10 6,980,295
Invester Return Assuming Sale At Year 1 At Year 5 At Year 10
Net Operating Income 1,326,493 1,583,006 1,959,995
Terminal Cap Rate 8.00% 7.0% 6.0%
Fair Market Value 16,581,163 22,614,371 32,666,589
Cost of Sale 4% 663,247 904,575 1,306,664
Sale Price Realized 15,917,916 21,709,796 31,359,925
Project Equity 15,917,916 21,709,796 31,359,925
ROI
Investors 84% 115% 166%
Developers 84% 115% 166%
6. Operating Income Model Formating
Red Requires further attention
Blue Input cells
Green Cells linked to another sheet
Rentable SqFt Factor 85% Black Cells containing a title or calculation on the same sheet
Retail Rent/SqFt Rentable SqFt Annual Rent
115.70 5142.5 595,000
Vacancy 5% (29,750)
Gross Operating income 565,250
Residential Rent/SqFt Rentable SqFt Annual Rent
68.45 46282.5 3,167,950
Vacancy 10% (316,795)
Gross Operating income 2,851,155
Total 3,416,405 Dhs
Operating Income Forecast 1 2 3 4 5 6 7 8 9 10
Retail 595,000 612,850 631,236 650,173 669,678 689,768 710,461 731,775 753,728 776,340
Residential 3,167,950 3,262,989 3,360,878 3,461,704 3,565,556 3,672,522 3,782,698 3,896,179 4,013,064 4,133,456
Retail - Loss to Vacancy (29,750) (30,643) (31,562) (32,509) (33,484) (34,488) (35,523) (36,589) (37,686) (38,817)
Residential - Loss to Vacancy (316,795) (326,299) (336,088) (346,170) (356,556) (367,252) (378,270) (389,618) (401,306) (413,346)
Total 3,416,405 3,518,897 3,624,464 3,733,198 3,845,194 3,960,550 4,079,366 4,201,747 4,327,800 4,457,634
Rent Growth 3%
7. Retail Tenant Costs Model Formating
Red Requires further attention
Blue Input cells
Green Cells linked to another sheet
Black Cells containing a title or calculation on the same sheet
Year Rent Utilities Other OpEx Total tenent costs Utilities + Othet OpEx
1 595,000 38,517 50,063 683,580 88,580
2 612,850 39,288 51,064 703,202 90,352
3 631,236 40,073 52,085 723,394 92,159
4 650,173 40,875 53,127 744,175 94,002
5 669,678 41,692 54,190 765,560 95,882
6 689,768 42,526 55,273 787,568 97,800
7 710,461 43,377 56,379 810,217 99,756
8 731,775 44,244 57,507 833,526 101,751
9 753,728 45,129 58,657 857,514 103,786
10 776,340 46,032 59,830 882,202 105,862
Total 7,790,937 969,928
NPV of Payments for 10 years (in year 0) 3,274,984
Retail tenent Discount Factor 11%
Utilities Growth rate 2%
Other Operating Expenses growth rate 2%
Utilities & Operating Expences / Year / SqFt
Energy 5.3
Water 0.65
Wastewater 0.56
Other Utilities 0.98
Total Utilities 7.49
Repairs & Maintenance 1.7
Security 0.5
Garage Operations 0.9
Management fee 0.4
Real Estate Taxes (5% of Rent) 5.79
Insurance 0.45
Total Operating Expenses 9.74
Total Costs 17.23
8. Residential Tenent Costs Model Formating
Red Requires further attention
Blue Input cells
Green Cells linked to another sheet
Black Cells containing a title or calculation on the same sheet
Year Rent Utilities Other OpEx Total tenent costs Utilities + Othet OpEx
1 3,167,950 254,091 1,747,241 5,169,282 2,001,332
2 3,262,989 259,173 1,782,186 5,304,347 2,041,358
3 3,360,878 264,356 1,817,829 5,443,064 2,082,186
4 3,461,704 269,643 1,854,186 5,585,534 2,123,829
5 3,565,556 275,036 1,891,270 5,731,862 2,166,306
6 3,672,522 280,537 1,929,095 5,882,154 2,209,632
7 3,782,698 286,148 1,967,677 6,036,523 2,253,825
8 3,896,179 291,871 2,007,031 6,195,080 2,298,901
9 4,013,064 297,708 2,047,171 6,357,943 2,344,879
10 4,133,456 303,662 2,088,115 6,525,233 2,391,777
Total 58,231,021 21,914,025
NPV of Payments for 10 years (in year 0) 26,346,207
Residential tenent Discount Factor 10%
Utilities Growth rate 2%
Other Operating Expenses growth rate 2%
Utilities & Operating Expences / Year / SqFt
Energy 4.8
Water 0.15
Wastewater 0.06
Other Utilities 0.48
Total Utilities 5.49
Repairs & Maintenance 2.2
Security 1
Garage Operations 1.4
Management fee 0.9
Real Estate Taxes (5% of Rent) 31.30
Insurance 0.95
Total Operating Expenses 37.75
Total Costs 43.24
9. Costruction Costs Schedule Model Formating
Red Requires further attention
Blue Input cells
Gross Development Value 39,182,000 Dhs Green Cells linked to another sheet
Rental Value (/Year) 4,310,020 Dhs Black Cells containing a title or calculation on the same sheet
Item Value Discription
Land Value 14,200,000 Dhs
Hard Costs
Building Costs (/SqFt) 18.6 1,125,300 Dhs
Landscaping 121,500 Dhs
Other external costs 180,000 Dhs
Site Clearance 120,000 Dhs
Site Preparation 240,000 Dhs
Total Hard Costs 1,786,800 Dhs
Soft Costs
Architects 10% 112,530 % of building cost
Quantity Surveyors 5% 56,265 % of building cost
Legal Fees on sale 2% 783,640 % of Gross Development Value
Legal Fees on letting 2% 86,200.40 % of rent
Letting Agents 2% 86,200.40 % of rent
Civil Engineers 5% 56,265 % of building cost
Planning Permission 60,000 Dhs
Building Regulations 30,000
Total Soft Costs 1,271,101 Dhs
Other Costs
Contingencies 10% 305,790 % of Construction costs and fees
Total Contingencies 305,790 Dhs
Tenent Improvements 1,000,000 Dhs
Legal Fees on site purchase 2% 284,000 % Land Value
Total Costs 18,847,691 Dhs
Year number Design & Construction 1 Design & Construction 2 Design & Construction 3
Year 2015 2016 2017
% Costs Allocation 50% 30% 20%
Total construction Costs 2,323,845 1,394,307 929,538 4,647,691
Total
10. Risiduale Land Valuation Model Formating
Red Requires further attention
Blue Input cells
Green Cells linked to another sheet
Black Cells containing a title or calculation on the same sheet
Cap Rate 12%
Operating Income (1st Year) 3,416,405
Gross Development Value 28,470,042
Hard Costs
Building Costs 1,125,300
Landscaping 121,500
Other external costs 180,000
Site Clearance 120,000
Site Preparation 240,000
Total Hard Costs 1,786,800
Soft Costs
Architects 112,530
Quantity Surveyors 56,265
Legal Fees on sale 783,640
Legal Fees on letting 86,200
Letting Agents 86,200
Civil Engineers 56,265
Planning Permission 60,000
Building Regulations 30,000
Total Soft Costs 1,271,101
Other Costs
Contingencies 305,790
Tenent Improvements 1,000,000
Total Other Costs 1,305,790
Develper Profit at 0.2 20% 5,694,008
Total Construction Costs 10,057,699
Availiable for land 18,412,342
Legal Fees on site purchase 284,000
Risidual Land Value 18,128,342 Dhs
Land Selling Price 14,200,000 Dhs
11. Sensitivity analysis Model Formating
Red Requires further attention
Blue Input cells
Green Cells linked to another sheet
Black Cells containing a title or calculation on the same sheet
Cap rate and Terminal CF impact on Equity
Cost of Sale 4%
Base Cap rate 6% 1,788,835 1,844,160 1,901,195 1,959,995 2,018,795 2,079,359 2,141,740
Base Terminal CF 1,959,995 5.5% 31,359,925 32,329,820 33,329,711 34,360,527 35,391,343 36,453,083 37,546,676
Change Factor 3% 5.6% 30,419,128 31,359,925 32,329,820 33,329,711 34,329,603 35,359,491 36,420,275
5.8% 29,506,554 30,419,128 31,359,925 32,329,820 33,299,714 34,298,706 35,327,667
6.0% 28,621,357 29,506,554 30,419,128 31,359,925 32,300,723 33,269,745 34,267,837
6.2% 27,787,725 28,647,139 29,533,133 30,446,529 31,359,925 32,300,723 33,269,745
6.4% 26,978,374 27,812,757 28,672,945 29,559,737 30,446,529 31,359,925 32,300,723
6.6% 26,192,596 27,002,676 27,837,811 28,698,774 29,559,737 30,446,529 31,359,925
Standard Deviation 2,700,457 Dhs
Range 11,354,079 Dhs
Equity Value
Terminal Cash flow
TerminalCapRate