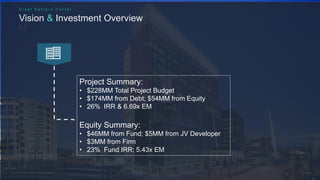
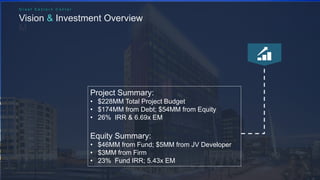
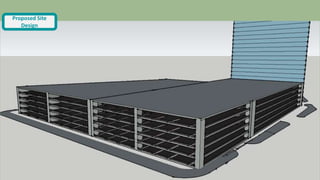
Great Eastern
Center
Daniel Mandel, Nurulauni Saniman,
Maike Zhang, Yuhua Zhou
G r e a t E a s t e r n C e n t e r
Vision & Investment Overview
M
Project Summary:
• $228MM Total Project Budget
• $174MM from Debt; $54MM from Equity
• 26% IRR & 6.69x EM
Equity Summary:
• $46MM from Fund; $5MM from JV Developer
• $3MM from Firm
• 23% Fund IRR; 5.43x EM
Value Creation:
• Land scarcity in CBD
• Increase demand for class A office
• Parking deficit will lead to development opportunity
• City will provide 0% interest loan
• New tenants will pay higher rent and increase NOI
G r e a t E a s t e r n C e n t e r
Vision & Investment Overview
M
G r e a t E a s t e r n C e n t e r
Vision & Investment Overview
M
Project Summary:
• $228MM Total Project Budget
• $174MM from Debt; $54MM from Equity
• 26% IRR & 6.69x EM
Equity Summary:
• $46MM from Fund; $5MM from JV Developer
• $3MM from Firm
• 23% Fund IRR; 5.43x EM
Location
Sensitivity Analysis
Site Proposal
Partner Proposal
Deal Structure
Conclusion
G r e a t E a s t e r n C e n t e r
Location & Market Analysis
• CBD in the capital of Atlantis, good access to
airport
• Fast population growth (20 million as of now)
• Politically stable country
• High GDP growth of 10.5% for the next 5 years
• Currency predicted to be weaker in the near future
• High demand for office buildings
Risk & Opportunities
• Political Risk
• Currently stable
• Assurance of local embassy
• Currency Risk
• Predicted to be weaker
• Unproductive and Corrupt
Working Environment
• Local expertise
Risks
G r e a t E a s t e r n C e n t e r
Opportunities
• Dire need for more
parking in the CBD area
• Rapid economic growth
• Influx of international
companies
• Rent growth
• Increasing demand for
office in CBD areas
Sensitivity Analysis
Partner Proposal
Deal Structure
Conclusion
G r e a t E a s t e r n C e n t e r
Site Proposal
Location
DEVELOPER’S PROPOSAL
• Acquisition price of $186MM
• $166MM for existing buildings
• $20MM for additional land
• A) Buy and divide the property and liquidate the development site
• Land has a negative value at acquisition according to feasibility
analysis
• Land will appreciate quickly due to scarcity
• B) Buy and hold without additional capital improvements
• More value creation through development
• C) Buy and develop the property with a second building
A B
NO NO
C
YES
Buy and develop the property with a second building
Parking
Government’s
financial support of
0% interest loan
High demand for
parking due to
government support
23% IRR
Office
High cost of
development
Negative land value
Negative IRR
Both
18% IRR
DEVELOPER’S PROPOSAL
Current Year 10Current Year 1 Year 10
New Parking Structure Opens
Current
Existing Office Leases all at Market Rent
Year 8
Buy Site and start building parking
Current
Sell Site
10 Year
Year 2 Year 3 Year 4 Year 5 Year 6 Year 7 Year 8 Year 9
Project Timeline
G r e a t E a s t e r n C e n t e r
• 6-story above-grade parking
• 504,000 sqft
• 1,440 parking spots
• 18,000 sqft green space
SITE PROPOSAL
Proposed Site
Design
Proposed Site
Design
Existing Office Existing Parking
New Parking
New Greenspace
Proposed Site
Design
Sensitivity Analysis
Partner Proposal
Deal Structure
Conclusion
G r e a t E a s t e r n C e n t e r
Site Proposal
Location
PARTNER PROPOSAL
• Local developer with expertise in local construction and development
• Connections with local brokers and local politicians
• High local reputation
• Past collaboration yielded high returns for the fund
• Experienced project/construction manager
• Will hire local firms for property management in the future
Oceanic Global
Real Estate
Opportunity Fund
Alex Richmond
Co., Local
Developer
JV Partnership
Debt Financing
8.5%
30-year amort, 15-year
term; 15% recourse
80% of purchase price
$145.5MM
Acquisition Loan
0.0% interest
25-year amortization
Hard cost for parking
$28.8MM
City Loan
G r e a t E a s t e r n C e n t e r
76%
ProjectF U N D I N G
Equity
Fund & JV & Firm
24%
Sources of Capital & Total Project Returns
F U N D I N G
$145.5MM acquisition loan from APRB and
$28.8MM city loan
G r e a t E a s t e r n C e n t e r
Firm
85.5%
9.5%
76%
F U N D I N G
Sources of Capital & Total Project Returns
Equity
F U N D I N G
Fund Equity
G r e a t E a s t e r n C e n t e r
Firm
JV Developer
Sources
&
Uses
Sources ($US) % Sources % Ownership Total
Acqusition Loan from APRB 63.8% $145,556,321
City Loan 12.6% $28,800,000
JV & Fund 22.4% 95.0% $51,111,354
Fund 20.2% 85.5% $46,000,219
JV 2.0% 9.5% $4,600,022
Firm 1.2% 5.0% $2,690,071
Total Sources ($US) 100.00% 100.0% $228,157,746
Uses ($US) Total
Acqusition Price $185,658,573
Land Acquistion $19,658,097
Existing Structure Acquistion $166,000,475
New Parking Building Construction Costs $35,136,000
Hard Costs $28,800,000
Soft Costs $5,760,000
Contingencies $576,000
Developer fee $1,054,080
Leasing Commissions $6,309,094
Total Uses ($US) $228,157,746
Sensitivity Analysis
Partner Proposal
Deal Structure
Conclusion
G r e a t E a s t e r n C e n t e r
Site Proposal
Location
Equity Cash Flow Distributions
LP receives 0% until Fund’s hurdle is
met
15% IRR
100%
Oceanic Fund
Tier 1
Oceanic Fund
LP receives 30% thereafter
Remaining
70%
Tier 2
G r e a t E a s t e r n C e n t e r
85.5%
9.5%
Equity Returns Breakdown by Parties
Equity
Fund Equity
23% IRR and 5.43x EM
48% IRR and 30.67x EM
G r e a t E a s t e r n C e n t e r
5.0% Firm
23% IRR and 5.43x EM
JV Developer
G r e a t E a s t e r n C e n t e r
Sensitivity Analysis
Partner Proposal
Deal Structure
Conclusion
G r e a t E a s t e r n C e n t e r
Site Proposal
Location
G r e a t E a s t e r n C e n t e r
Sensitivity Analysis
Partner Proposal
Deal Structure
Conclusion
G r e a t E a s t e r n C e n t e r
Site Proposal
Location
Risk Mitigation
• Local developer has ties
with politicians
• Project supported by local
government
Political Risk
+
• JV partnership with local
experienced developer
• Aligned incentives
Distant Investment
+
G r e a t E a s t e r n C e n t e r
Corrupt and Unproductive
Working Environment
+
• Compliance with
international business
standards
• Experienced developer
who knows how to work
with uncertainties
Vision
Market Analysis
Site Proposal
Timeline
Sources of
Capital
Equity Cash Flow
Distribution
Equity Returns
Sensitivity
Analysis
Risk Mitigation
Questions?
G r e a t E a s t e r n C e n t e r
INVEST
WITH US
NewStructure Dimensions F
Length 700
Width 120
Total Area F 84000
New Parking
Total Stories 6
Total Gross New Parking Sqft 504000
Total Spots 1440
New Office
Length 254
Width 120
Total F 30480
Total Stories 20
Total Gross Office 609600
Land Utilization (Constraint) Existing Structures Value
Max Gross Office with FAR Constraint 1423884
Max New Gross Office 610489
Parking to Satisfy New Office 1221
Sqft of New Parking 427350
Total Gross New Parking Sqft 504000
Excess New Parking 76650
Spots 219
Existing Structures Value
Existing Office Value
NOI $10,593,136
Cap 11.5%
Value $92,114,225
Existing Parking
Monthly Rate $250
Expense Ratio 15%
Spots 1830
Vacancy 95%
NOI $4,433,175
Cap 6.0%
Value $73,886,250
TOTAL VALUE $166,000,475
Rate 8.5% 10%
Amortization 30 I-O
WACC Calcualtion New Office Acqusition loan equity construction loan WACC Calculation for Parking City Loan Acqusition loan equity construction loan
80% 20% % Used
9.23% 15% 9.50% Rate % of total 4% 10.41% 15% 9.50% Rate
%Total Cost Parking Construction Hard Cost $28,800,000 80%
Land 10% Parking Construction all else $7,390,080 20%
Building 90% Total Parking Construction Cost $36,190,080
WACC 10.6% WACC 6.25%
8.00% 9.23%
2.00% 15%
72.00% 9.50%
18.00% 15%
100.00%
0.105781569
Build Open Stabilized
New Office Land Price Calcualtion Current 1 2 3 4 5 6 7 8 9 10
New Rent 2.6 2.73 2.8665 3.009825 3.16031625 3.318332063 3.484248666 3.658461099 3.841384154 4.033453362 4.23512603
New Vacancy 95% 95% 95% 95% 95% 95% 95% 95% 95% 95% 95%
New Expense Ratio 15% 15% 15% 15% 15% 15% 15% 15% 15% 15% 15%
NOI $12,286,610 $12,900,940 $13,545,987 $14,223,287 $14,934,451 $15,681,174 $16,465,232 $17,288,494 $18,152,919 $19,060,565 $20,013,593
WACC 10.6% 10.6% 10.6% 10.6% 10.6% 10.6% 10.6% 10.6% 10.6% 10.6% 10.6%
Budget $116,150,762.22 $121,958,300.34 $128,056,215.35 $134,459,026.12 $141,181,977.43 $148,241,076.30 $155,653,130.11 $163,435,786.62 $171,607,575.95 $180,187,954.75 $189,197,352.48
New Parking
Monthly Rate $250 $263 $276 $289 $304 $319 $335 $352 $369 $388 $407
Expense Ratio 8% 8% 8% 8% 8% 8% 8% 8% 8% 8% 8%
Spots 1440 1440 1440 1440 1440 1440 1440 1440 1440 1440 1440
Vacancy 95% 95% 95% 95% 95% 95% 95% 95% 95% 95% 95%
NOI $3,796,200 $3,986,010 $4,185,311 $4,394,576 $4,614,305 $4,845,020 $5,087,271 $5,341,635 $5,608,716 $5,889,152 $6,183,610
WACC 6.2% 6.2% 6.2% 6.2% 6.2% 6.2% 6.2% 6.2% 6.2% 6.2% 6.2%
Budget $60,775,958 $63,814,756 $67,005,493 $70,355,768 $73,873,556 $77,567,234 $81,445,596 $85,517,876 $89,793,770 $94,283,458 $98,997,631
Currency Exchange rate 1 1.05 1.1 1.15 1.17 1.2 1.22 1.24 1.25 1.27 1.29
Total Budget ($US) $176,926,720 $176,926,720 $177,328,826 $178,099,821 $183,808,149 $188,173,592 $194,662,337 $201,374,831 $208,318,791 $215,502,197 $222,933,308
Development Cost ($US) $166,416,701.81 $163,246,860 $155,826,548 $149,051,481 $146,503,592 $142,841,002 $140,730,052 $138,650,297 $136,601,278 $134,582,540 $132,593,635
TI ($US) $28,666,440 $27,301,371 $26,060,400 $24,927,339 $24,501,231 $23,888,700 $23,535,665 $23,187,847 $22,845,170 $22,507,556 $22,174,932
LC ($US) $2,580,188.08 $2,580,188.08 $2,586,052.15 $2,597,295.85 $2,680,542.51 $2,744,205.40 $2,838,833.17 $2,936,723.97 $3,037,990.31 $3,142,748.60 $3,251,119.24
Land ($US) ($20,736,609.97) ($16,201,699.46) ($7,144,174.10) $1,523,705.27 $10,122,783.12 $18,699,684.34 $27,557,786.88 $36,599,962.61 $45,834,352.68 $55,269,352.41 $64,913,620.54
New Parking
Monthly Rate 250
Expense Ratio 0.15
Spots 1440
Vacancy 0.95
NOI $3,488,400.00
WACC 6.25%
Budget $55,848,177.35
Currency Exchange rate 1
Total Budget ($US) $55,848,177.35
Development Cost ($US) $36,190,080.00
TI ($US)
LC ($US)
Land ($US) $19,658,097.35
Build Open Stabilized
Year 1 2 3 4 5 6 7 8 9 10
Annual CBD Market Rent psf $32.76 $34.40 $36.12 $37.92 $39.82 $41.81 $43.90 $46.10 $48.40 $50.82
Existing Building Expense Rate 15% 15% 15% 15% 15% 15% 15% 15% 15% 15%
New Building Expense Rate 15% 15% 15% 15% 15% 15% 15% 15% 15% 15%
Annual CBD Parking Rate $3,000 $3,150 $3,308 $3,473 $3,647 $3,829 $4,020 $4,221 $4,432 $4,654
Expense Rate 8% 8% 8% 8% 8% 8% 8% 8% 8% 8%
Annual CBD In place rent psf $21.17 $22.23 $23.34 $24.50 $25.73 $27.02 $28.37 $29.79 $31.27 $32.84
Proforma
Existing Office
Total Occupied Space Begin Year 618,180 580,453 554,160 538,193 531,671 533,920 544,442 562,899 589,101 618,180
Total Occupied Space less New Vacancy 525,453 493,385 471,036 457,464 451,921 453,832 462,776 478,464 500,736 525,453
Absorption 55,000 60,775 67,156 74,208 82,000 90,610 100,124 110,637 117,444 92,727
Total Occupied Space End Year 580,453 554,160 538,193 531,671 533,920 544,442 562,899 589,101 618,180 618,180
New Office
Total Occupied Space Begin Year 260,604 312,129 366,230 423,036 482,682 521,208 521,208 521,208
Total Occupied Space less New Vacancy
Absorption 51,525 54,101 56,806 59,646 38,526 0 0 0
Total Occupied Space End Year 312,129 366,230 423,036 482,682 521,208 521,208 521,208 521,208
Existing Office
Gross Sqft Paying In Place Rent 525,453 438,385 355,261 274,532 194,782 114,694 33,027 0 0 0
Gross Sqft Paying Market Rent 55,000 115,775 182,931 257,139 339,139 429,748 529,872 589,101 618,180 618,180
In Place Annual Rent $11,122,793 $9,743,725 $8,290,986 $6,727,305 $5,011,698 $3,098,598 $936,888 $0 $0 $0
Annual Market Rent $1,801,800 $3,982,428 $6,607,097 $9,751,693 $13,504,501 $17,968,202 $23,262,190 $27,155,552 $29,920,812 $31,416,853
Existing Office Total Rent $12,924,593 $13,726,153 $14,898,083 $16,478,999 $18,516,199 $21,066,799 $24,199,078 $27,155,552 $29,920,812 $31,416,853
New Office
Gross Sqft Paying Market Rent 0 0 0 312,129 366,230 423,036 482,682 521,208 521,208 521,208
New Office Total Rent 0 0 0 $11,837,108 $14,583,265 $17,687,546 $21,190,491 $24,025,922 $25,227,218 $26,488,579
Total EGI Office $12,924,593 $13,726,153 $14,898,083 $28,316,107 $33,099,464 $38,754,345 $45,389,569 $51,181,474 $55,148,030 $57,905,431
Other Revenue
Existing Parking Revenue $5,215,500 $5,476,275 $5,750,089 $6,037,593 $6,339,473 $6,656,446 $6,989,269 $7,338,732 $7,705,669 $8,090,952
NewParking Revenue $4,104,000 $4,309,200 $4,524,660 $4,750,893 $4,988,438 $5,237,860 $5,499,753 $5,774,740 $6,063,477 $6,366,651
Total Parking Revenue $9,319,500 $9,785,475 $10,274,749 $10,788,486 $11,327,910 $11,894,306 $12,489,021 $13,113,472 $13,769,146 $14,457,603
Total Income Before Expenses $22,244,093 $23,511,628 $25,172,831 $39,104,593 $44,427,375 $50,648,651 $57,878,591 $64,294,946 $68,917,176 $72,363,035
General Operating Expense $1,938,688.91 $2,058,923 $2,234,712.41 $4,247,415.98 $4,964,919.62 $5,813,152 $6,808,435 $7,677,221 $8,272,204 $8,685,814.72
General Parking Expense $698,963 $733,911 $770,606 $809,136 $849,593.29 $892,073 $936,677 $983,510 $1,032,686 $1,084,320
LC Old $387,737.78 $411,784.59 $446,942.48 $494,369.96 $555,485.97 $632,003.97 $725,972.35 $814,666.55 $897,624.36 $942,505.58
LC New $0.00 $0.00 $0.00 $355,113.24 $437,497.96 $530,626.39 $635,714.73 $720,777.65 $756,816.54 $794,657.36
Asset Management Fee included in expenses
Total Expense $2,637,651.41 $2,792,833.60 $3,005,318.56 $5,056,552.45 $5,814,512.90 $6,705,224.76 $7,745,112.00 $8,660,731.46 $9,304,890.45 $9,770,134.97
NOI $19,606,441 $20,718,795 $22,167,513 $34,048,040 $38,612,862 $43,943,427 $50,133,479 $55,634,214 $59,612,286 $62,592,900
Existing Parking New Parking
Year 10 Revenue $8,090,952 $6,366,651
Year 10 Expenses 8% $606,821 $477,499
Year 10 NOI $7,484,131 $5,889,152
cap rate 5.00% 5.00%
Value $149,682,618 $117,783,043 $267,465,661
Original Basis $73,886,250 $42,499,174
Land Basis $2,098,778
Capital Gains $75,796,368 $73,185,092
Value Add Tax 7.50% $5,684,728 $5,488,882 $11,173,610
Currency Exchange rate 1.29
Acqusition Loan from APRB in $US $124,839,753
In $A City Loan $17,280,000
Total Reversion $714,137,199 Construction Loan from APRB $156,066,513
Tax $24,188,876
Debt Service $298,186,267
Value $391,762,056
Value ($US) $303,047,645
Return of Capital ($US) $89,348,608
Return of Capital
Leftovers $213,699,037
Fund Leftover $149,589,326
Firm Leftovers $64,109,711
***In $US
Currency Exchange rate 1 1.05 1.1 1.15 1.17 1.2 1.218 1.23627 1.25481405 1.27363626 1.292740805 EM IRR
Fund $49,154,708 $4,848,430 $5,588,716 $29,183,975 $4,038,776 $5,564,354 $11,470,223 $14,805,639 $17,655,431 $19,580,891 $206,425,631 5.305578 18.76%
Firm $4,749,481 $345,647 $380,497 $1,453,399 $293,755 $2,463,881 $815,859 $2,305,913 $3,586,948 $4,470,957 $58,362,628 15.06958 34.03%
***In $A
Operation
MC Owners CF % CF CUM Ret CF % CF CUM Ret CF % CF CUM Ret CF % CF CUM Ret
Acqusition Loan from APRB 9.23% $140,898,607 $13,000,661 92% 9.2% $0 0% 9.2% $0.00 0% 9.2% $0.00 0%
City Loan 4.00% $28,800,000 $1,152,000 8% 4.0% $0 0% 4.0% $0.00 0% 4.0% $0.00 0%
Construction Loan from APRB 9.50% $156,066,513 $0 0% 0.0% $0.00 0% 0.0% $0.00 0% 0.0% $0.00 0%
Fund $90,240,148 95% $0 0% 0.0% 0 0% 0.0% $13,536,022.22 95% 15.0% $0.00 70%
Firm $4,749,481 5% $0 0% 0.0% $94,989.63 100% 2.0% $712,422.22 5% 17.0% $0.00 30%
$14,152,661 $94,990 $14,248,444
Total $14,152,661 $14,247,650 $28,496,095
2nd rule: Equity Managmeent Fee
2%
1st rule 3rd rule 4th rule
Debt Service 15% 15%+
***In $A
Operation
MC Owners CF % CF CUM Ret CF % CF CUM Ret CF % CF CUM Ret CF % CF CUM Ret
Acqusition Loan from APRB 9.23% $140,898,607 $13,000,661 45% 9.2% $0 0% 9.2% $0.00 0% 9.2% $0.00 0%
City Loan 4.00% $28,800,000 $1,152,000 4% 4.0% $0 0% 4.0% $0.00 0% 4.0% $0.00 0%
Construction Loan from APRB 9.50% $156,066,513 $14,826,319 51% 9.5% $0.00 0% 9.5% $0.00 0% 9.5% $0.00 0%
Fund $90,240,148 95% $0 0% 0.0% $0.00 0% 0.0% $13,536,022.22 95% 15.0% $0.00 70%
Firm $4,749,481 5% $0 0% 0.0% $94,989.63 100% 2.0% $712,422.22 5% 17.0% $0.00 30%
$28,978,979 $94,990 $14,248,444
Total $28,978,979 $29,073,969 $43,322,413
1st rule 2nd rule
Debt Service +Construction Loan 2%
3rd rule 4th rule
15% 15%+
***In $A
0 1 2 3 4 5 6 7 8 9 10 EM IRR
Acqusition Loan from APRB $140,898,607 $13,000,661 $13,000,661 $13,000,661 $13,000,661 $13,000,661 $13,000,661 $13,000,661 $13,000,661 $13,000,661 $137,840,414 8.46%
City Loan $28,800,000 $1,152,000 $1,152,000 $1,152,000 $1,152,000 $1,152,000 $1,152,000 $1,152,000 $1,152,000 $1,152,000 $18,432,000 0.00%
Construction Loan from APRB $0 $0 $0 $156,066,513 $14,826,319 $14,826,319 $14,826,319 $14,826,319 $14,826,319 $14,826,319 $170,892,832 9.50%
Existing Gross Office 813395
Hard Costs 175 $142,344,125.00
Soft Costs (of hard, TI, parking) 20% $43,924,170.00
Contingencies ( of hard and soft) 10% $18,626,829.50
Parking 20000 $32,540,000.00
Developer fee 3% $9,120,563.41
Tenant improvments $55 $44,736,725.00
Tax 7.50% $21,846,930.97
Total $313,139,343.88

Real Estate Development Case Presentation

  • 1.
    Great Eastern Center Daniel Mandel,Nurulauni Saniman, Maike Zhang, Yuhua Zhou
  • 2.
    G r ea t E a s t e r n C e n t e r Vision & Investment Overview M Project Summary: • $228MM Total Project Budget • $174MM from Debt; $54MM from Equity • 26% IRR & 6.69x EM Equity Summary: • $46MM from Fund; $5MM from JV Developer • $3MM from Firm • 23% Fund IRR; 5.43x EM
  • 3.
    Value Creation: • Landscarcity in CBD • Increase demand for class A office • Parking deficit will lead to development opportunity • City will provide 0% interest loan • New tenants will pay higher rent and increase NOI G r e a t E a s t e r n C e n t e r Vision & Investment Overview M
  • 4.
    G r ea t E a s t e r n C e n t e r Vision & Investment Overview M Project Summary: • $228MM Total Project Budget • $174MM from Debt; $54MM from Equity • 26% IRR & 6.69x EM Equity Summary: • $46MM from Fund; $5MM from JV Developer • $3MM from Firm • 23% Fund IRR; 5.43x EM
  • 5.
    Location Sensitivity Analysis Site Proposal PartnerProposal Deal Structure Conclusion G r e a t E a s t e r n C e n t e r
  • 6.
    Location & MarketAnalysis • CBD in the capital of Atlantis, good access to airport • Fast population growth (20 million as of now) • Politically stable country • High GDP growth of 10.5% for the next 5 years • Currency predicted to be weaker in the near future • High demand for office buildings
  • 7.
    Risk & Opportunities •Political Risk • Currently stable • Assurance of local embassy • Currency Risk • Predicted to be weaker • Unproductive and Corrupt Working Environment • Local expertise Risks G r e a t E a s t e r n C e n t e r Opportunities • Dire need for more parking in the CBD area • Rapid economic growth • Influx of international companies • Rent growth • Increasing demand for office in CBD areas
  • 8.
    Sensitivity Analysis Partner Proposal DealStructure Conclusion G r e a t E a s t e r n C e n t e r Site Proposal Location
  • 9.
    DEVELOPER’S PROPOSAL • Acquisitionprice of $186MM • $166MM for existing buildings • $20MM for additional land • A) Buy and divide the property and liquidate the development site • Land has a negative value at acquisition according to feasibility analysis • Land will appreciate quickly due to scarcity • B) Buy and hold without additional capital improvements • More value creation through development • C) Buy and develop the property with a second building A B NO NO C YES
  • 10.
    Buy and developthe property with a second building Parking Government’s financial support of 0% interest loan High demand for parking due to government support 23% IRR Office High cost of development Negative land value Negative IRR Both 18% IRR DEVELOPER’S PROPOSAL
  • 11.
    Current Year 10CurrentYear 1 Year 10 New Parking Structure Opens Current Existing Office Leases all at Market Rent Year 8 Buy Site and start building parking Current Sell Site 10 Year Year 2 Year 3 Year 4 Year 5 Year 6 Year 7 Year 8 Year 9 Project Timeline G r e a t E a s t e r n C e n t e r
  • 12.
    • 6-story above-gradeparking • 504,000 sqft • 1,440 parking spots • 18,000 sqft green space SITE PROPOSAL
  • 13.
  • 14.
    Proposed Site Design Existing OfficeExisting Parking New Parking New Greenspace
  • 15.
  • 16.
    Sensitivity Analysis Partner Proposal DealStructure Conclusion G r e a t E a s t e r n C e n t e r Site Proposal Location
  • 17.
    PARTNER PROPOSAL • Localdeveloper with expertise in local construction and development • Connections with local brokers and local politicians • High local reputation • Past collaboration yielded high returns for the fund • Experienced project/construction manager • Will hire local firms for property management in the future Oceanic Global Real Estate Opportunity Fund Alex Richmond Co., Local Developer JV Partnership
  • 18.
    Debt Financing 8.5% 30-year amort,15-year term; 15% recourse 80% of purchase price $145.5MM Acquisition Loan 0.0% interest 25-year amortization Hard cost for parking $28.8MM City Loan G r e a t E a s t e r n C e n t e r
  • 19.
    76% ProjectF U ND I N G Equity Fund & JV & Firm 24% Sources of Capital & Total Project Returns F U N D I N G $145.5MM acquisition loan from APRB and $28.8MM city loan G r e a t E a s t e r n C e n t e r Firm
  • 20.
    85.5% 9.5% 76% F U ND I N G Sources of Capital & Total Project Returns Equity F U N D I N G Fund Equity G r e a t E a s t e r n C e n t e r Firm JV Developer
  • 21.
    Sources & Uses Sources ($US) %Sources % Ownership Total Acqusition Loan from APRB 63.8% $145,556,321 City Loan 12.6% $28,800,000 JV & Fund 22.4% 95.0% $51,111,354 Fund 20.2% 85.5% $46,000,219 JV 2.0% 9.5% $4,600,022 Firm 1.2% 5.0% $2,690,071 Total Sources ($US) 100.00% 100.0% $228,157,746 Uses ($US) Total Acqusition Price $185,658,573 Land Acquistion $19,658,097 Existing Structure Acquistion $166,000,475 New Parking Building Construction Costs $35,136,000 Hard Costs $28,800,000 Soft Costs $5,760,000 Contingencies $576,000 Developer fee $1,054,080 Leasing Commissions $6,309,094 Total Uses ($US) $228,157,746
  • 22.
    Sensitivity Analysis Partner Proposal DealStructure Conclusion G r e a t E a s t e r n C e n t e r Site Proposal Location
  • 23.
    Equity Cash FlowDistributions LP receives 0% until Fund’s hurdle is met 15% IRR 100% Oceanic Fund Tier 1 Oceanic Fund LP receives 30% thereafter Remaining 70% Tier 2 G r e a t E a s t e r n C e n t e r
  • 24.
    85.5% 9.5% Equity Returns Breakdownby Parties Equity Fund Equity 23% IRR and 5.43x EM 48% IRR and 30.67x EM G r e a t E a s t e r n C e n t e r 5.0% Firm 23% IRR and 5.43x EM JV Developer
  • 25.
    G r ea t E a s t e r n C e n t e r G r e a t E a s t e r n C e n t e r
  • 26.
    Sensitivity Analysis Partner Proposal DealStructure Conclusion G r e a t E a s t e r n C e n t e r Site Proposal Location
  • 27.
    G r ea t E a s t e r n C e n t e r
  • 28.
    G r ea t E a s t e r n C e n t e r
  • 29.
    Sensitivity Analysis Partner Proposal DealStructure Conclusion G r e a t E a s t e r n C e n t e r Site Proposal Location
  • 30.
    Risk Mitigation • Localdeveloper has ties with politicians • Project supported by local government Political Risk + • JV partnership with local experienced developer • Aligned incentives Distant Investment + G r e a t E a s t e r n C e n t e r Corrupt and Unproductive Working Environment + • Compliance with international business standards • Experienced developer who knows how to work with uncertainties
  • 31.
    Vision Market Analysis Site Proposal Timeline Sourcesof Capital Equity Cash Flow Distribution Equity Returns Sensitivity Analysis Risk Mitigation Questions? G r e a t E a s t e r n C e n t e r
  • 32.
  • 33.
    NewStructure Dimensions F Length700 Width 120 Total Area F 84000 New Parking Total Stories 6 Total Gross New Parking Sqft 504000 Total Spots 1440 New Office Length 254 Width 120 Total F 30480 Total Stories 20 Total Gross Office 609600 Land Utilization (Constraint) Existing Structures Value Max Gross Office with FAR Constraint 1423884 Max New Gross Office 610489 Parking to Satisfy New Office 1221 Sqft of New Parking 427350 Total Gross New Parking Sqft 504000 Excess New Parking 76650 Spots 219 Existing Structures Value Existing Office Value NOI $10,593,136 Cap 11.5% Value $92,114,225 Existing Parking Monthly Rate $250 Expense Ratio 15% Spots 1830 Vacancy 95% NOI $4,433,175 Cap 6.0% Value $73,886,250 TOTAL VALUE $166,000,475 Rate 8.5% 10% Amortization 30 I-O WACC Calcualtion New Office Acqusition loan equity construction loan WACC Calculation for Parking City Loan Acqusition loan equity construction loan 80% 20% % Used 9.23% 15% 9.50% Rate % of total 4% 10.41% 15% 9.50% Rate %Total Cost Parking Construction Hard Cost $28,800,000 80% Land 10% Parking Construction all else $7,390,080 20% Building 90% Total Parking Construction Cost $36,190,080 WACC 10.6% WACC 6.25% 8.00% 9.23% 2.00% 15% 72.00% 9.50% 18.00% 15% 100.00% 0.105781569
  • 34.
    Build Open Stabilized NewOffice Land Price Calcualtion Current 1 2 3 4 5 6 7 8 9 10 New Rent 2.6 2.73 2.8665 3.009825 3.16031625 3.318332063 3.484248666 3.658461099 3.841384154 4.033453362 4.23512603 New Vacancy 95% 95% 95% 95% 95% 95% 95% 95% 95% 95% 95% New Expense Ratio 15% 15% 15% 15% 15% 15% 15% 15% 15% 15% 15% NOI $12,286,610 $12,900,940 $13,545,987 $14,223,287 $14,934,451 $15,681,174 $16,465,232 $17,288,494 $18,152,919 $19,060,565 $20,013,593 WACC 10.6% 10.6% 10.6% 10.6% 10.6% 10.6% 10.6% 10.6% 10.6% 10.6% 10.6% Budget $116,150,762.22 $121,958,300.34 $128,056,215.35 $134,459,026.12 $141,181,977.43 $148,241,076.30 $155,653,130.11 $163,435,786.62 $171,607,575.95 $180,187,954.75 $189,197,352.48 New Parking Monthly Rate $250 $263 $276 $289 $304 $319 $335 $352 $369 $388 $407 Expense Ratio 8% 8% 8% 8% 8% 8% 8% 8% 8% 8% 8% Spots 1440 1440 1440 1440 1440 1440 1440 1440 1440 1440 1440 Vacancy 95% 95% 95% 95% 95% 95% 95% 95% 95% 95% 95% NOI $3,796,200 $3,986,010 $4,185,311 $4,394,576 $4,614,305 $4,845,020 $5,087,271 $5,341,635 $5,608,716 $5,889,152 $6,183,610 WACC 6.2% 6.2% 6.2% 6.2% 6.2% 6.2% 6.2% 6.2% 6.2% 6.2% 6.2% Budget $60,775,958 $63,814,756 $67,005,493 $70,355,768 $73,873,556 $77,567,234 $81,445,596 $85,517,876 $89,793,770 $94,283,458 $98,997,631 Currency Exchange rate 1 1.05 1.1 1.15 1.17 1.2 1.22 1.24 1.25 1.27 1.29 Total Budget ($US) $176,926,720 $176,926,720 $177,328,826 $178,099,821 $183,808,149 $188,173,592 $194,662,337 $201,374,831 $208,318,791 $215,502,197 $222,933,308 Development Cost ($US) $166,416,701.81 $163,246,860 $155,826,548 $149,051,481 $146,503,592 $142,841,002 $140,730,052 $138,650,297 $136,601,278 $134,582,540 $132,593,635 TI ($US) $28,666,440 $27,301,371 $26,060,400 $24,927,339 $24,501,231 $23,888,700 $23,535,665 $23,187,847 $22,845,170 $22,507,556 $22,174,932 LC ($US) $2,580,188.08 $2,580,188.08 $2,586,052.15 $2,597,295.85 $2,680,542.51 $2,744,205.40 $2,838,833.17 $2,936,723.97 $3,037,990.31 $3,142,748.60 $3,251,119.24 Land ($US) ($20,736,609.97) ($16,201,699.46) ($7,144,174.10) $1,523,705.27 $10,122,783.12 $18,699,684.34 $27,557,786.88 $36,599,962.61 $45,834,352.68 $55,269,352.41 $64,913,620.54
  • 35.
    New Parking Monthly Rate250 Expense Ratio 0.15 Spots 1440 Vacancy 0.95 NOI $3,488,400.00 WACC 6.25% Budget $55,848,177.35 Currency Exchange rate 1 Total Budget ($US) $55,848,177.35 Development Cost ($US) $36,190,080.00 TI ($US) LC ($US) Land ($US) $19,658,097.35
  • 36.
    Build Open Stabilized Year1 2 3 4 5 6 7 8 9 10 Annual CBD Market Rent psf $32.76 $34.40 $36.12 $37.92 $39.82 $41.81 $43.90 $46.10 $48.40 $50.82 Existing Building Expense Rate 15% 15% 15% 15% 15% 15% 15% 15% 15% 15% New Building Expense Rate 15% 15% 15% 15% 15% 15% 15% 15% 15% 15% Annual CBD Parking Rate $3,000 $3,150 $3,308 $3,473 $3,647 $3,829 $4,020 $4,221 $4,432 $4,654 Expense Rate 8% 8% 8% 8% 8% 8% 8% 8% 8% 8% Annual CBD In place rent psf $21.17 $22.23 $23.34 $24.50 $25.73 $27.02 $28.37 $29.79 $31.27 $32.84 Proforma Existing Office Total Occupied Space Begin Year 618,180 580,453 554,160 538,193 531,671 533,920 544,442 562,899 589,101 618,180 Total Occupied Space less New Vacancy 525,453 493,385 471,036 457,464 451,921 453,832 462,776 478,464 500,736 525,453 Absorption 55,000 60,775 67,156 74,208 82,000 90,610 100,124 110,637 117,444 92,727 Total Occupied Space End Year 580,453 554,160 538,193 531,671 533,920 544,442 562,899 589,101 618,180 618,180 New Office Total Occupied Space Begin Year 260,604 312,129 366,230 423,036 482,682 521,208 521,208 521,208 Total Occupied Space less New Vacancy Absorption 51,525 54,101 56,806 59,646 38,526 0 0 0 Total Occupied Space End Year 312,129 366,230 423,036 482,682 521,208 521,208 521,208 521,208 Existing Office Gross Sqft Paying In Place Rent 525,453 438,385 355,261 274,532 194,782 114,694 33,027 0 0 0 Gross Sqft Paying Market Rent 55,000 115,775 182,931 257,139 339,139 429,748 529,872 589,101 618,180 618,180 In Place Annual Rent $11,122,793 $9,743,725 $8,290,986 $6,727,305 $5,011,698 $3,098,598 $936,888 $0 $0 $0 Annual Market Rent $1,801,800 $3,982,428 $6,607,097 $9,751,693 $13,504,501 $17,968,202 $23,262,190 $27,155,552 $29,920,812 $31,416,853 Existing Office Total Rent $12,924,593 $13,726,153 $14,898,083 $16,478,999 $18,516,199 $21,066,799 $24,199,078 $27,155,552 $29,920,812 $31,416,853 New Office Gross Sqft Paying Market Rent 0 0 0 312,129 366,230 423,036 482,682 521,208 521,208 521,208 New Office Total Rent 0 0 0 $11,837,108 $14,583,265 $17,687,546 $21,190,491 $24,025,922 $25,227,218 $26,488,579 Total EGI Office $12,924,593 $13,726,153 $14,898,083 $28,316,107 $33,099,464 $38,754,345 $45,389,569 $51,181,474 $55,148,030 $57,905,431 Other Revenue Existing Parking Revenue $5,215,500 $5,476,275 $5,750,089 $6,037,593 $6,339,473 $6,656,446 $6,989,269 $7,338,732 $7,705,669 $8,090,952 NewParking Revenue $4,104,000 $4,309,200 $4,524,660 $4,750,893 $4,988,438 $5,237,860 $5,499,753 $5,774,740 $6,063,477 $6,366,651 Total Parking Revenue $9,319,500 $9,785,475 $10,274,749 $10,788,486 $11,327,910 $11,894,306 $12,489,021 $13,113,472 $13,769,146 $14,457,603 Total Income Before Expenses $22,244,093 $23,511,628 $25,172,831 $39,104,593 $44,427,375 $50,648,651 $57,878,591 $64,294,946 $68,917,176 $72,363,035 General Operating Expense $1,938,688.91 $2,058,923 $2,234,712.41 $4,247,415.98 $4,964,919.62 $5,813,152 $6,808,435 $7,677,221 $8,272,204 $8,685,814.72 General Parking Expense $698,963 $733,911 $770,606 $809,136 $849,593.29 $892,073 $936,677 $983,510 $1,032,686 $1,084,320 LC Old $387,737.78 $411,784.59 $446,942.48 $494,369.96 $555,485.97 $632,003.97 $725,972.35 $814,666.55 $897,624.36 $942,505.58 LC New $0.00 $0.00 $0.00 $355,113.24 $437,497.96 $530,626.39 $635,714.73 $720,777.65 $756,816.54 $794,657.36 Asset Management Fee included in expenses Total Expense $2,637,651.41 $2,792,833.60 $3,005,318.56 $5,056,552.45 $5,814,512.90 $6,705,224.76 $7,745,112.00 $8,660,731.46 $9,304,890.45 $9,770,134.97 NOI $19,606,441 $20,718,795 $22,167,513 $34,048,040 $38,612,862 $43,943,427 $50,133,479 $55,634,214 $59,612,286 $62,592,900
  • 37.
    Existing Parking NewParking Year 10 Revenue $8,090,952 $6,366,651 Year 10 Expenses 8% $606,821 $477,499 Year 10 NOI $7,484,131 $5,889,152 cap rate 5.00% 5.00% Value $149,682,618 $117,783,043 $267,465,661 Original Basis $73,886,250 $42,499,174 Land Basis $2,098,778 Capital Gains $75,796,368 $73,185,092 Value Add Tax 7.50% $5,684,728 $5,488,882 $11,173,610 Currency Exchange rate 1.29 Acqusition Loan from APRB in $US $124,839,753 In $A City Loan $17,280,000 Total Reversion $714,137,199 Construction Loan from APRB $156,066,513 Tax $24,188,876 Debt Service $298,186,267 Value $391,762,056 Value ($US) $303,047,645 Return of Capital ($US) $89,348,608 Return of Capital Leftovers $213,699,037 Fund Leftover $149,589,326 Firm Leftovers $64,109,711
  • 38.
    ***In $US Currency Exchangerate 1 1.05 1.1 1.15 1.17 1.2 1.218 1.23627 1.25481405 1.27363626 1.292740805 EM IRR Fund $49,154,708 $4,848,430 $5,588,716 $29,183,975 $4,038,776 $5,564,354 $11,470,223 $14,805,639 $17,655,431 $19,580,891 $206,425,631 5.305578 18.76% Firm $4,749,481 $345,647 $380,497 $1,453,399 $293,755 $2,463,881 $815,859 $2,305,913 $3,586,948 $4,470,957 $58,362,628 15.06958 34.03% ***In $A Operation MC Owners CF % CF CUM Ret CF % CF CUM Ret CF % CF CUM Ret CF % CF CUM Ret Acqusition Loan from APRB 9.23% $140,898,607 $13,000,661 92% 9.2% $0 0% 9.2% $0.00 0% 9.2% $0.00 0% City Loan 4.00% $28,800,000 $1,152,000 8% 4.0% $0 0% 4.0% $0.00 0% 4.0% $0.00 0% Construction Loan from APRB 9.50% $156,066,513 $0 0% 0.0% $0.00 0% 0.0% $0.00 0% 0.0% $0.00 0% Fund $90,240,148 95% $0 0% 0.0% 0 0% 0.0% $13,536,022.22 95% 15.0% $0.00 70% Firm $4,749,481 5% $0 0% 0.0% $94,989.63 100% 2.0% $712,422.22 5% 17.0% $0.00 30% $14,152,661 $94,990 $14,248,444 Total $14,152,661 $14,247,650 $28,496,095 2nd rule: Equity Managmeent Fee 2% 1st rule 3rd rule 4th rule Debt Service 15% 15%+ ***In $A Operation MC Owners CF % CF CUM Ret CF % CF CUM Ret CF % CF CUM Ret CF % CF CUM Ret Acqusition Loan from APRB 9.23% $140,898,607 $13,000,661 45% 9.2% $0 0% 9.2% $0.00 0% 9.2% $0.00 0% City Loan 4.00% $28,800,000 $1,152,000 4% 4.0% $0 0% 4.0% $0.00 0% 4.0% $0.00 0% Construction Loan from APRB 9.50% $156,066,513 $14,826,319 51% 9.5% $0.00 0% 9.5% $0.00 0% 9.5% $0.00 0% Fund $90,240,148 95% $0 0% 0.0% $0.00 0% 0.0% $13,536,022.22 95% 15.0% $0.00 70% Firm $4,749,481 5% $0 0% 0.0% $94,989.63 100% 2.0% $712,422.22 5% 17.0% $0.00 30% $28,978,979 $94,990 $14,248,444 Total $28,978,979 $29,073,969 $43,322,413 1st rule 2nd rule Debt Service +Construction Loan 2% 3rd rule 4th rule 15% 15%+ ***In $A 0 1 2 3 4 5 6 7 8 9 10 EM IRR Acqusition Loan from APRB $140,898,607 $13,000,661 $13,000,661 $13,000,661 $13,000,661 $13,000,661 $13,000,661 $13,000,661 $13,000,661 $13,000,661 $137,840,414 8.46% City Loan $28,800,000 $1,152,000 $1,152,000 $1,152,000 $1,152,000 $1,152,000 $1,152,000 $1,152,000 $1,152,000 $1,152,000 $18,432,000 0.00% Construction Loan from APRB $0 $0 $0 $156,066,513 $14,826,319 $14,826,319 $14,826,319 $14,826,319 $14,826,319 $14,826,319 $170,892,832 9.50%
  • 39.
    Existing Gross Office813395 Hard Costs 175 $142,344,125.00 Soft Costs (of hard, TI, parking) 20% $43,924,170.00 Contingencies ( of hard and soft) 10% $18,626,829.50 Parking 20000 $32,540,000.00 Developer fee 3% $9,120,563.41 Tenant improvments $55 $44,736,725.00 Tax 7.50% $21,846,930.97 Total $313,139,343.88

Editor's Notes