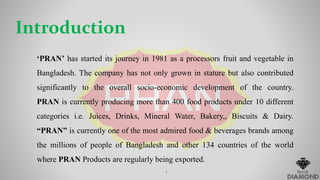
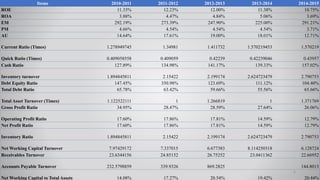
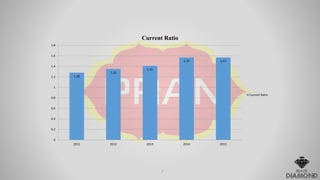
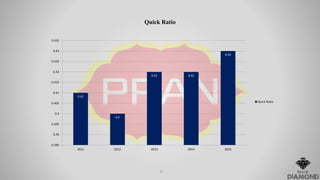
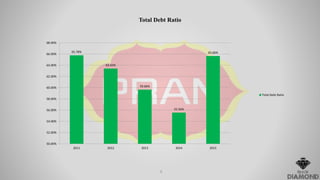
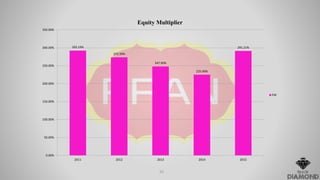
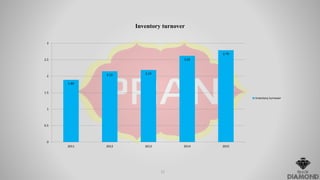
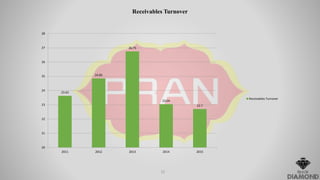
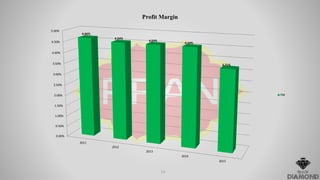
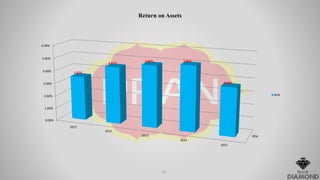
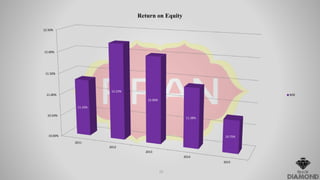
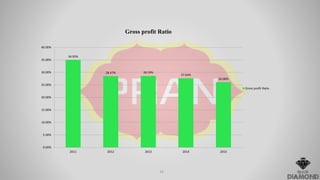
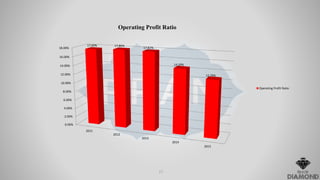
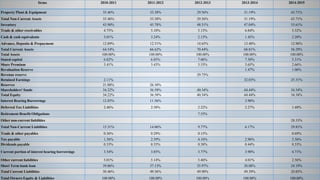
Welcome
To Our Presentation
1
Group Name:
Group Members
SL No. Name ID#
1 MD. Rashedul Islam 15202136
2 Ummea sayma 15202147
3 MD. Azizul Hakim Chowdhury 15202149
4 Mst. Jannatul Ferdous 15102355
5 MD. Yeasin Arafat 15102389
2
Presentation On
Ratio Analysis Of Pran Company
3
Introduction
‘PRAN’ has started its journey in 1981 as a processors fruit and vegetable in
Bangladesh. The company has not only grown in stature but also contributed
significantly to the overall socio-economic development of the country.
PRAN is currently producing more than 400 food products under 10 different
categories i.e. Juices, Drinks, Mineral Water, Bakery,, Biscuits & Dairy.
“PRAN” is currently one of the most admired food & beverages brands among
the millions of people of Bangladesh and other 134 countries of the world
where PRAN Products are regularly being exported.
4
The vision of the company
is to create a wonderful
brand image throughout the
world.
VisionMission
“Poverty and hunger are curses”-
mission of PRAN-RFL group. So
their aim is “to generate
employment and earn dignity and
self-respect for our competitors”
through profitable enterprise.
5
6
Items 2010-2011 2011-2012 2012-2013 2013-2014 2014-2015
ROE 11.33% 12.23% 12.00% 11.38% 10.75%
ROA 3.88% 4.47% 4.84% 5.06% 3.69%
EM 292.19% 273.39% 247.90% 225.00% 291.21%
PM 4.66% 4.54% 4.54% 4.54% 3.71%
AU 14.64% 17.61% 19.00% 18.01% 12.71%
Current Ratio (Times) 1.278949745 1.34981 1.411732 1.570219453 1.570219
Quick Ratio (Times) 0.409058558 0.409059 0.42239 0.42239046 0.43957
Cash Ratio 127.89% 134.98% 141.17% 139.33% 157.02%
Inventory turnover 1.894845811 2.15422 2.199174 2.624723479 2.790753
Debt Equity Ratio 147.45% 350.98% 123.69% 111.12% 104.40%
Total Debt Ratio 65.78% 63.42% 59.66% 55.56% 65.66%
Total Asset Turnover (Times) 1.122522111 1 1.266819 1 1.371769
Gross Profit Ratio 34.95% 28.47% 28.59% 27.64% 26.06%
Operating Profit Ratio 17.60% 17.86% 17.81% 14.59% 12.79%
Net Profit Ratio 17.60% 17.86% 17.81% 14.59% 12.79%
Inventory Ratio 1.894845811 2.15422 2.199174 2.624723479 2.790753
Net Working Capital Turnover 7.97429172 7.337015 6.677383 8.114250318 6.128724
Receivables Turnover 23.6344156 24.85152 26.75252 23.0411362 22.66952
Accounts Payable Turnover 232.5798859 339.9326 869.2825 144.8013
Net Working Capital to Total Assets 14.08% 17.27% 20.54% 19.42% 20.44%
1.28
1.35
1.41
1.57 1.57
0
0.2
0.4
0.6
0.8
1
1.2
1.4
1.6
1.8
2011 2012 2013 2014 2015
Current Ratio
Current Ratio
7
0.41
0.4
0.42 0.42
0.43
0.385
0.39
0.395
0.4
0.405
0.41
0.415
0.42
0.425
0.43
0.435
2011 2012 2013 2014 2015
Quick Ratio
Quick Ratio
8
65.78%
63.42%
59.66%
55.56%
65.66%
50.00%
52.00%
54.00%
56.00%
58.00%
60.00%
62.00%
64.00%
66.00%
68.00%
2011 2012 2013 2014 2015
Total Debt Ratio
Total Debt Ratio
9
292.19%
273.39%
247.90%
225.00%
291.21%
0.00%
50.00%
100.00%
150.00%
200.00%
250.00%
300.00%
350.00%
2011 2012 2013 2014 2015
Equity Multiplier
EM
10
1.89
2.15 2.19
2.62
2.79
0
0.5
1
1.5
2
2.5
3
2011 2012 2013 2014 2015
Inventory turnover
Inventory turnover
11
23.63
24.85
26.75
23.04
22.7
20
21
22
23
24
25
26
27
28
2011 2012 2013 2014 2015
Receivables Turnover
12
0.00%
0.50%
1.00%
1.50%
2.00%
2.50%
3.00%
3.50%
4.00%
4.50%
5.00%
2011
2012
2013
2014
2015
4.66%
4.54%
4.54%
4.54%
3.71%
Profit Margin
PM
13
ROA
0.00%
1.00%
2.00%
3.00%
4.00%
5.00%
6.00%
2011
2012
2013
2014
2015
3.47%
4.47%
4.84% 5.06%
3.69%
Return on Assets
ROA
14
10.00%
10.50%
11.00%
11.50%
12.00%
12.50%
2011
2012
2013
2014
2015
11.33%
12.23%
12.00%
11.38%
10.75%
Return on Equity
ROE
15
34.95%
28.47% 28.59%
27.64%
26.06%
0.00%
5.00%
10.00%
15.00%
20.00%
25.00%
30.00%
35.00%
40.00%
2011 2012 2013 2014 2015
Gross profit Ratio
Gross profit Ratio
16
0.00%
2.00%
4.00%
6.00%
8.00%
10.00%
12.00%
14.00%
16.00%
18.00%
2011
2012
2013
2014
2015
17.60% 17.86%
17.81%
14.59%
12.79%
Operating Profit Ratio
17
Items 2010-2011 2011-2012 2012-2013 2013-2014 2014-2015
Property Plant & Equipment 35.46% 33.38% 29.56% 31.19% 43.71%
Total Non-Current Assets 35.46% 33.38% 29.56% 31.19% 43.71%
Inventory 43.90% 45.78% 48.51% 47.04% 35.61%
Trade & other receivables 4.75% 5.10% 5.13% 6.84% 5.52%
Cash & cash equivalents 3.01% 3.24% 2.15% 1.45% 2.20%
Advance, Deposits & Prepayment 12.89% 12.51% 14.65% 13.48% 12.96%
Total Current Assets 64.54% 66.62% 70.44% 68.81% 56.29%
Total Assets 100.00% 100.00% 100.00% 100.00% 100.00%
Stated capital 6.82% 6.85% 7.06% 7.30% 5.31%
Share Premium 3.41% 3.43% 3.53% 3.65% 2.66%
Revaluation Reserve 1.47% 1.06%
Revenue reserve 29.75%
Retained Earnings 2.11% 32.03% 25.31%
Reserves 21.88% 26.30%
Shareholders' funds 34.22% 36.58% 40.34% 44.44% 34.34%
Total Equity 34.22% 36.58% 40.34% 44.44% 34.34%
Interest Bearing Borrowings 12.85% 11.56% 3.90%
Deferred Tax Liabilities 2.46% 2.50% 2.22% 2.27% 1.48%
Retirement Benefit Obligations 7.55%
Other non-current liabilities 28.33%
Total Non-Current Liabilities 15.31% 14.06% 9.77% 6.17% 29.81%
Trade & other payables 0.36% 0.29% 0.15% 0.69%
Tax payable 1.36% 2.59% 4.16% 2.96% 3.36%
Dividends payable 0.33% 0.35% 0.38% 0.44% 0.33%
Current portion of interest bearing borrowings 3.54% 3.85% 3.77% 3.90% 4.71%
Other current liabilities 5.01% 5.14% 5.46% 4.01% 2.56%
Short Term bank loan 39.86% 37.13% 35.97% 38.08% 24.19%
Total Current Liabilities 50.46% 49.36% 49.90% 49.39% 35.85%
Total Owners Equity & Liabilities 100.00% 100.00% 100.00% 100.00% 100.00%
18
Conclusion:
Ratios are just one number divided by another and as such
really don’t mean much. The trick is in the way ratios are
analyzed and used by the decision maker.
A good strategy is to compare the ratios to some sort of
benchmark. Once ratios are calculated, an analyst needs
some benchmarks to find out where the company stands at
the particular point.
19
Thank You
For
Listening
us.
20

Ratio analysis of pran