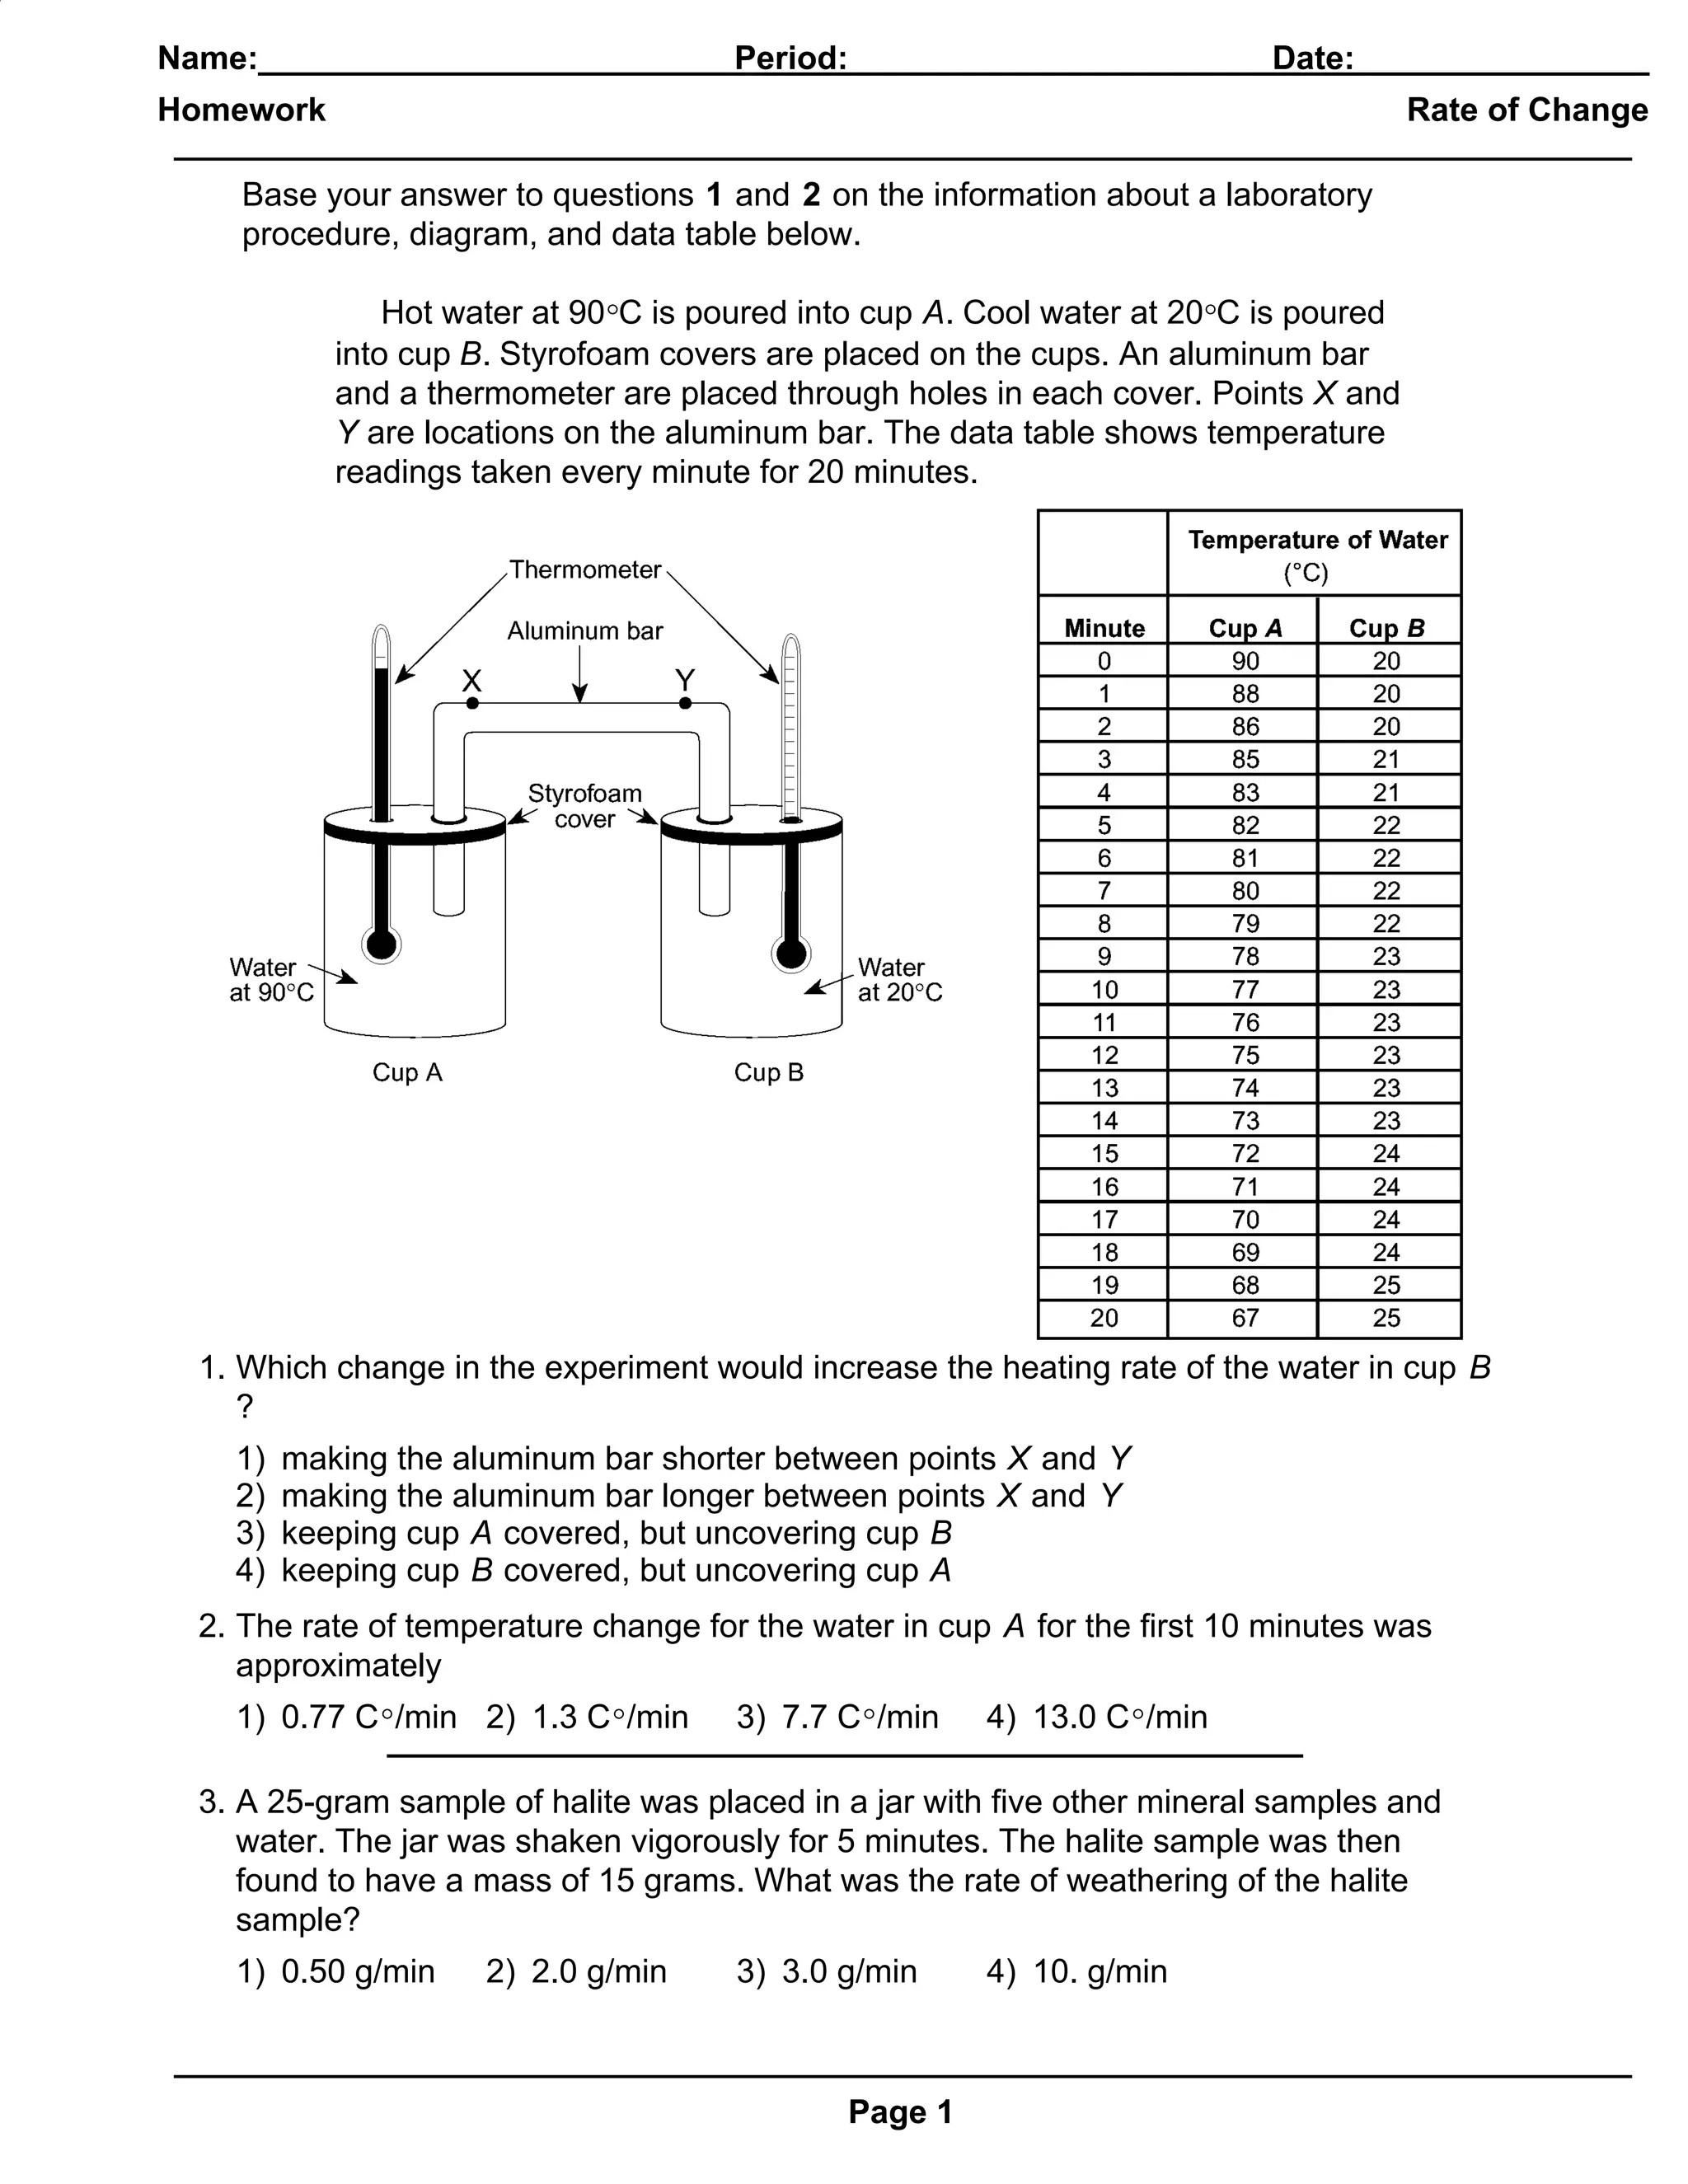
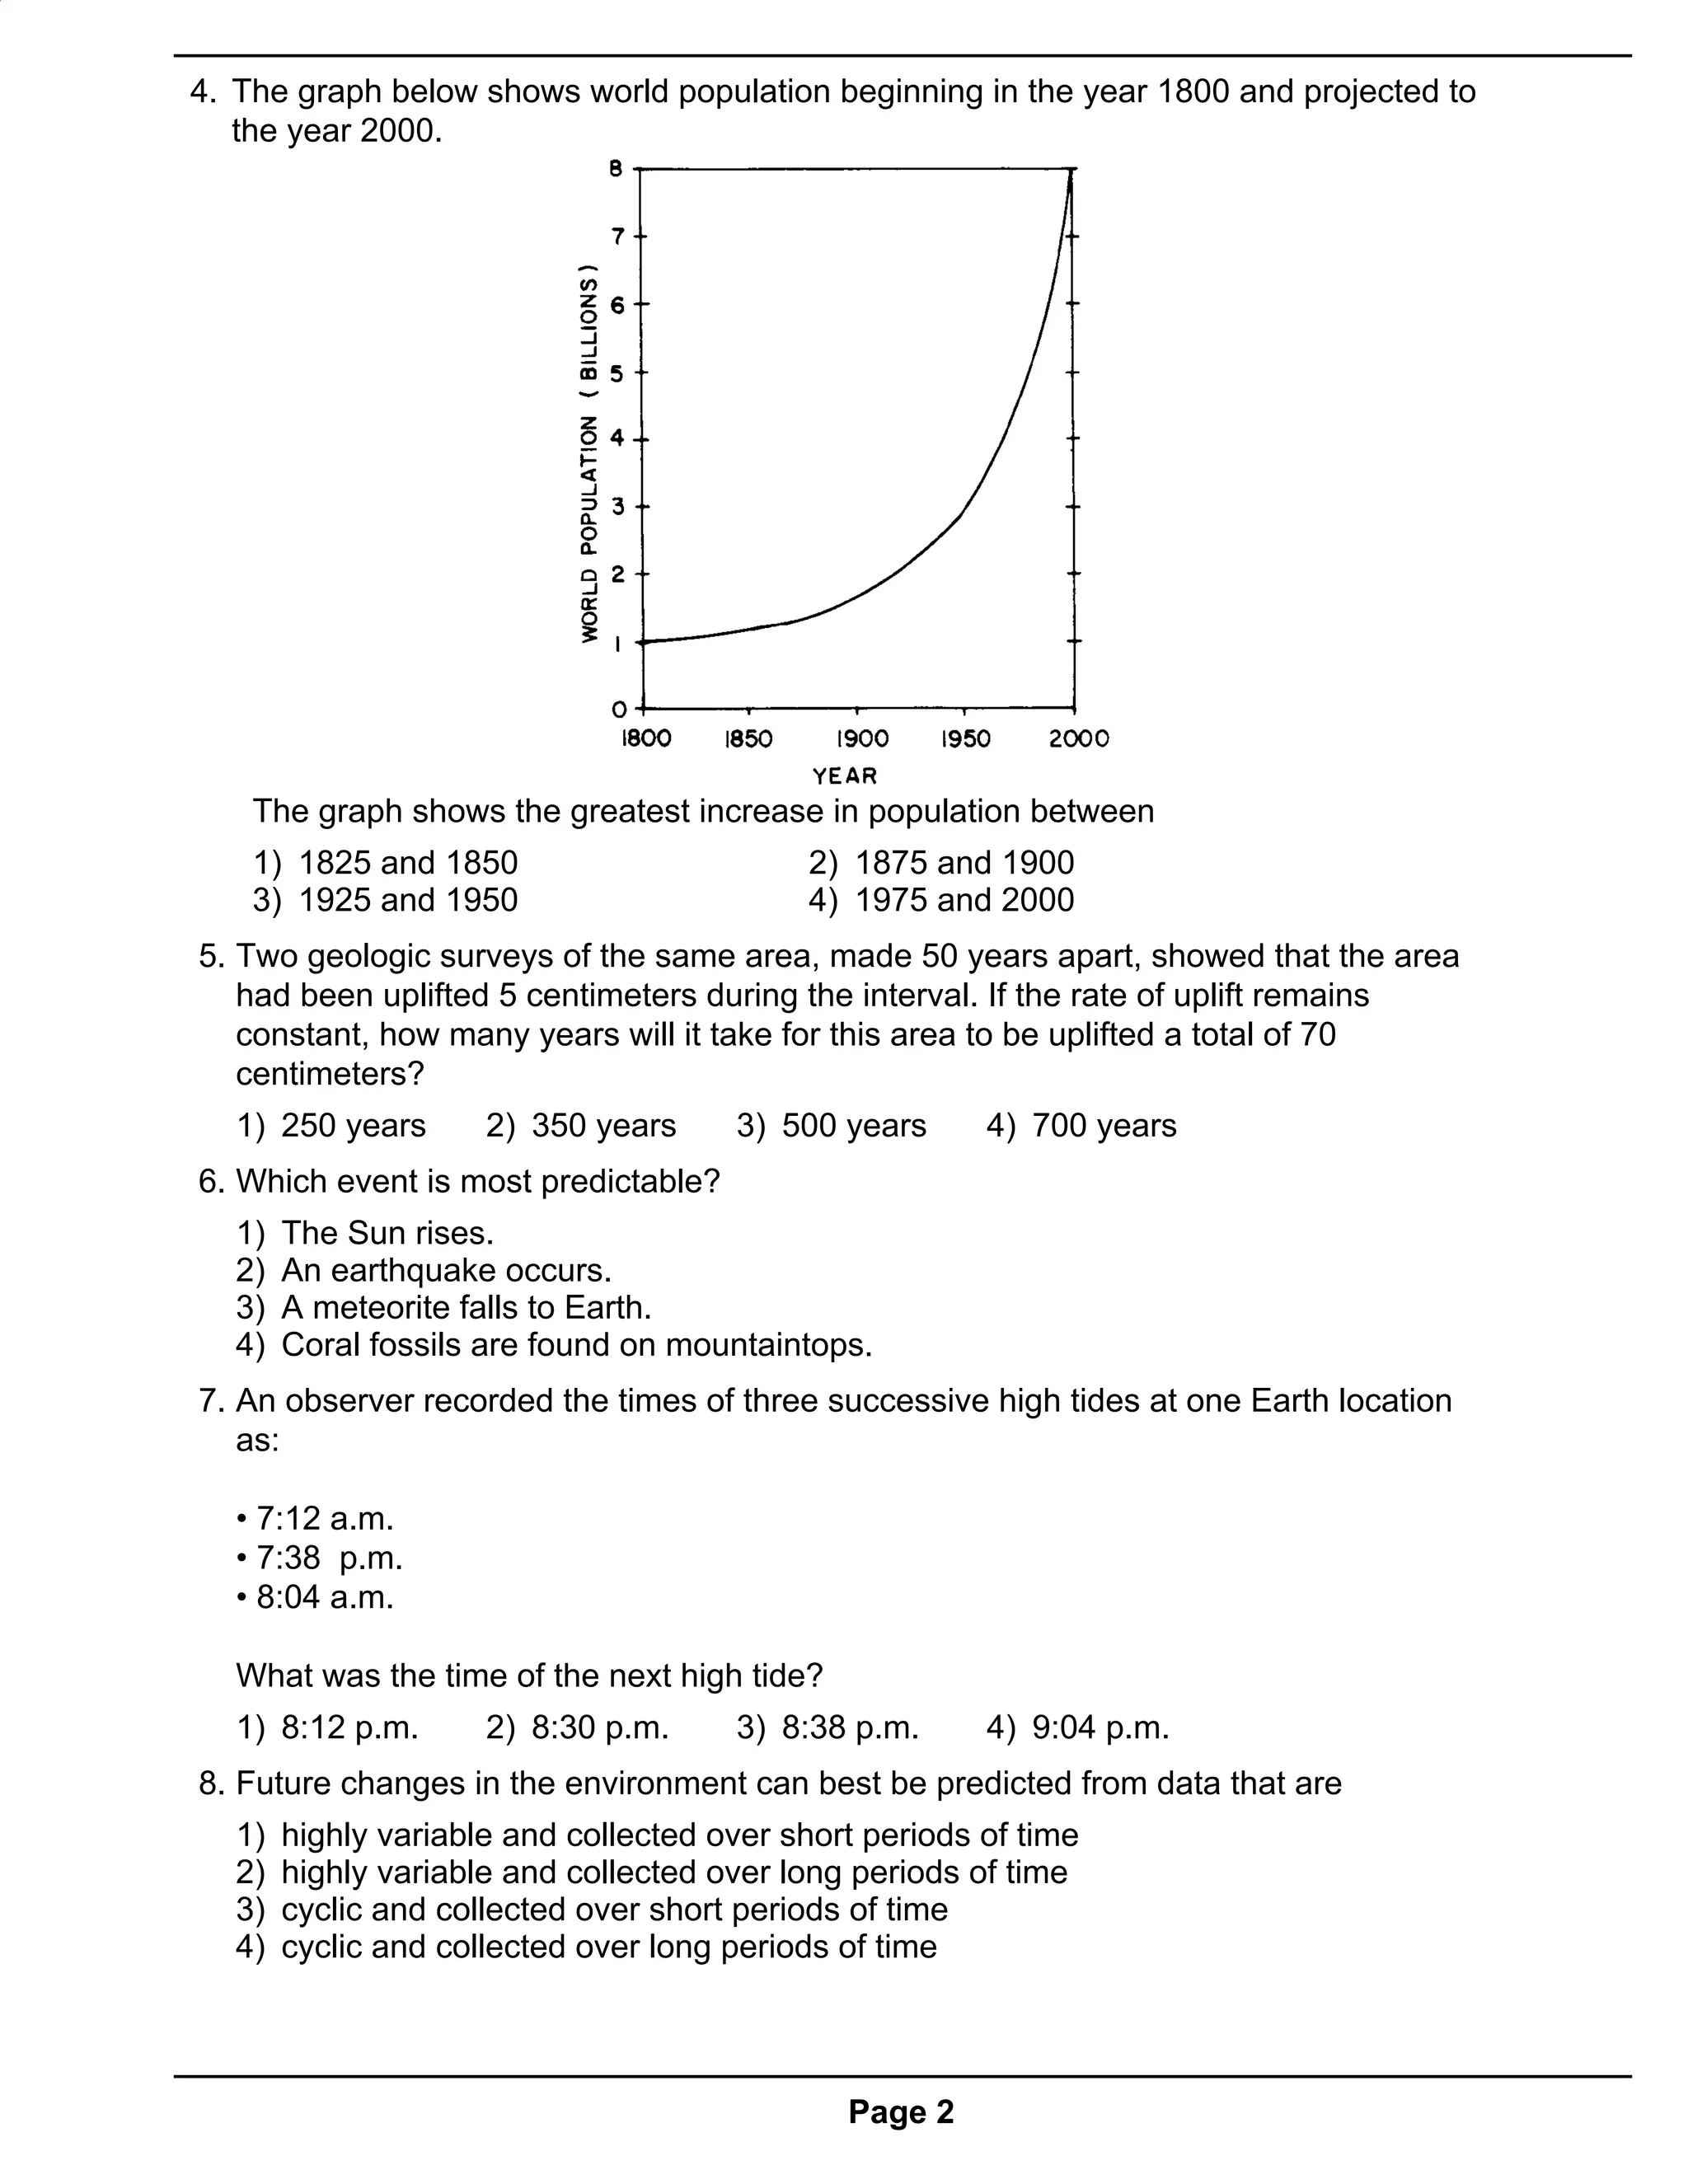
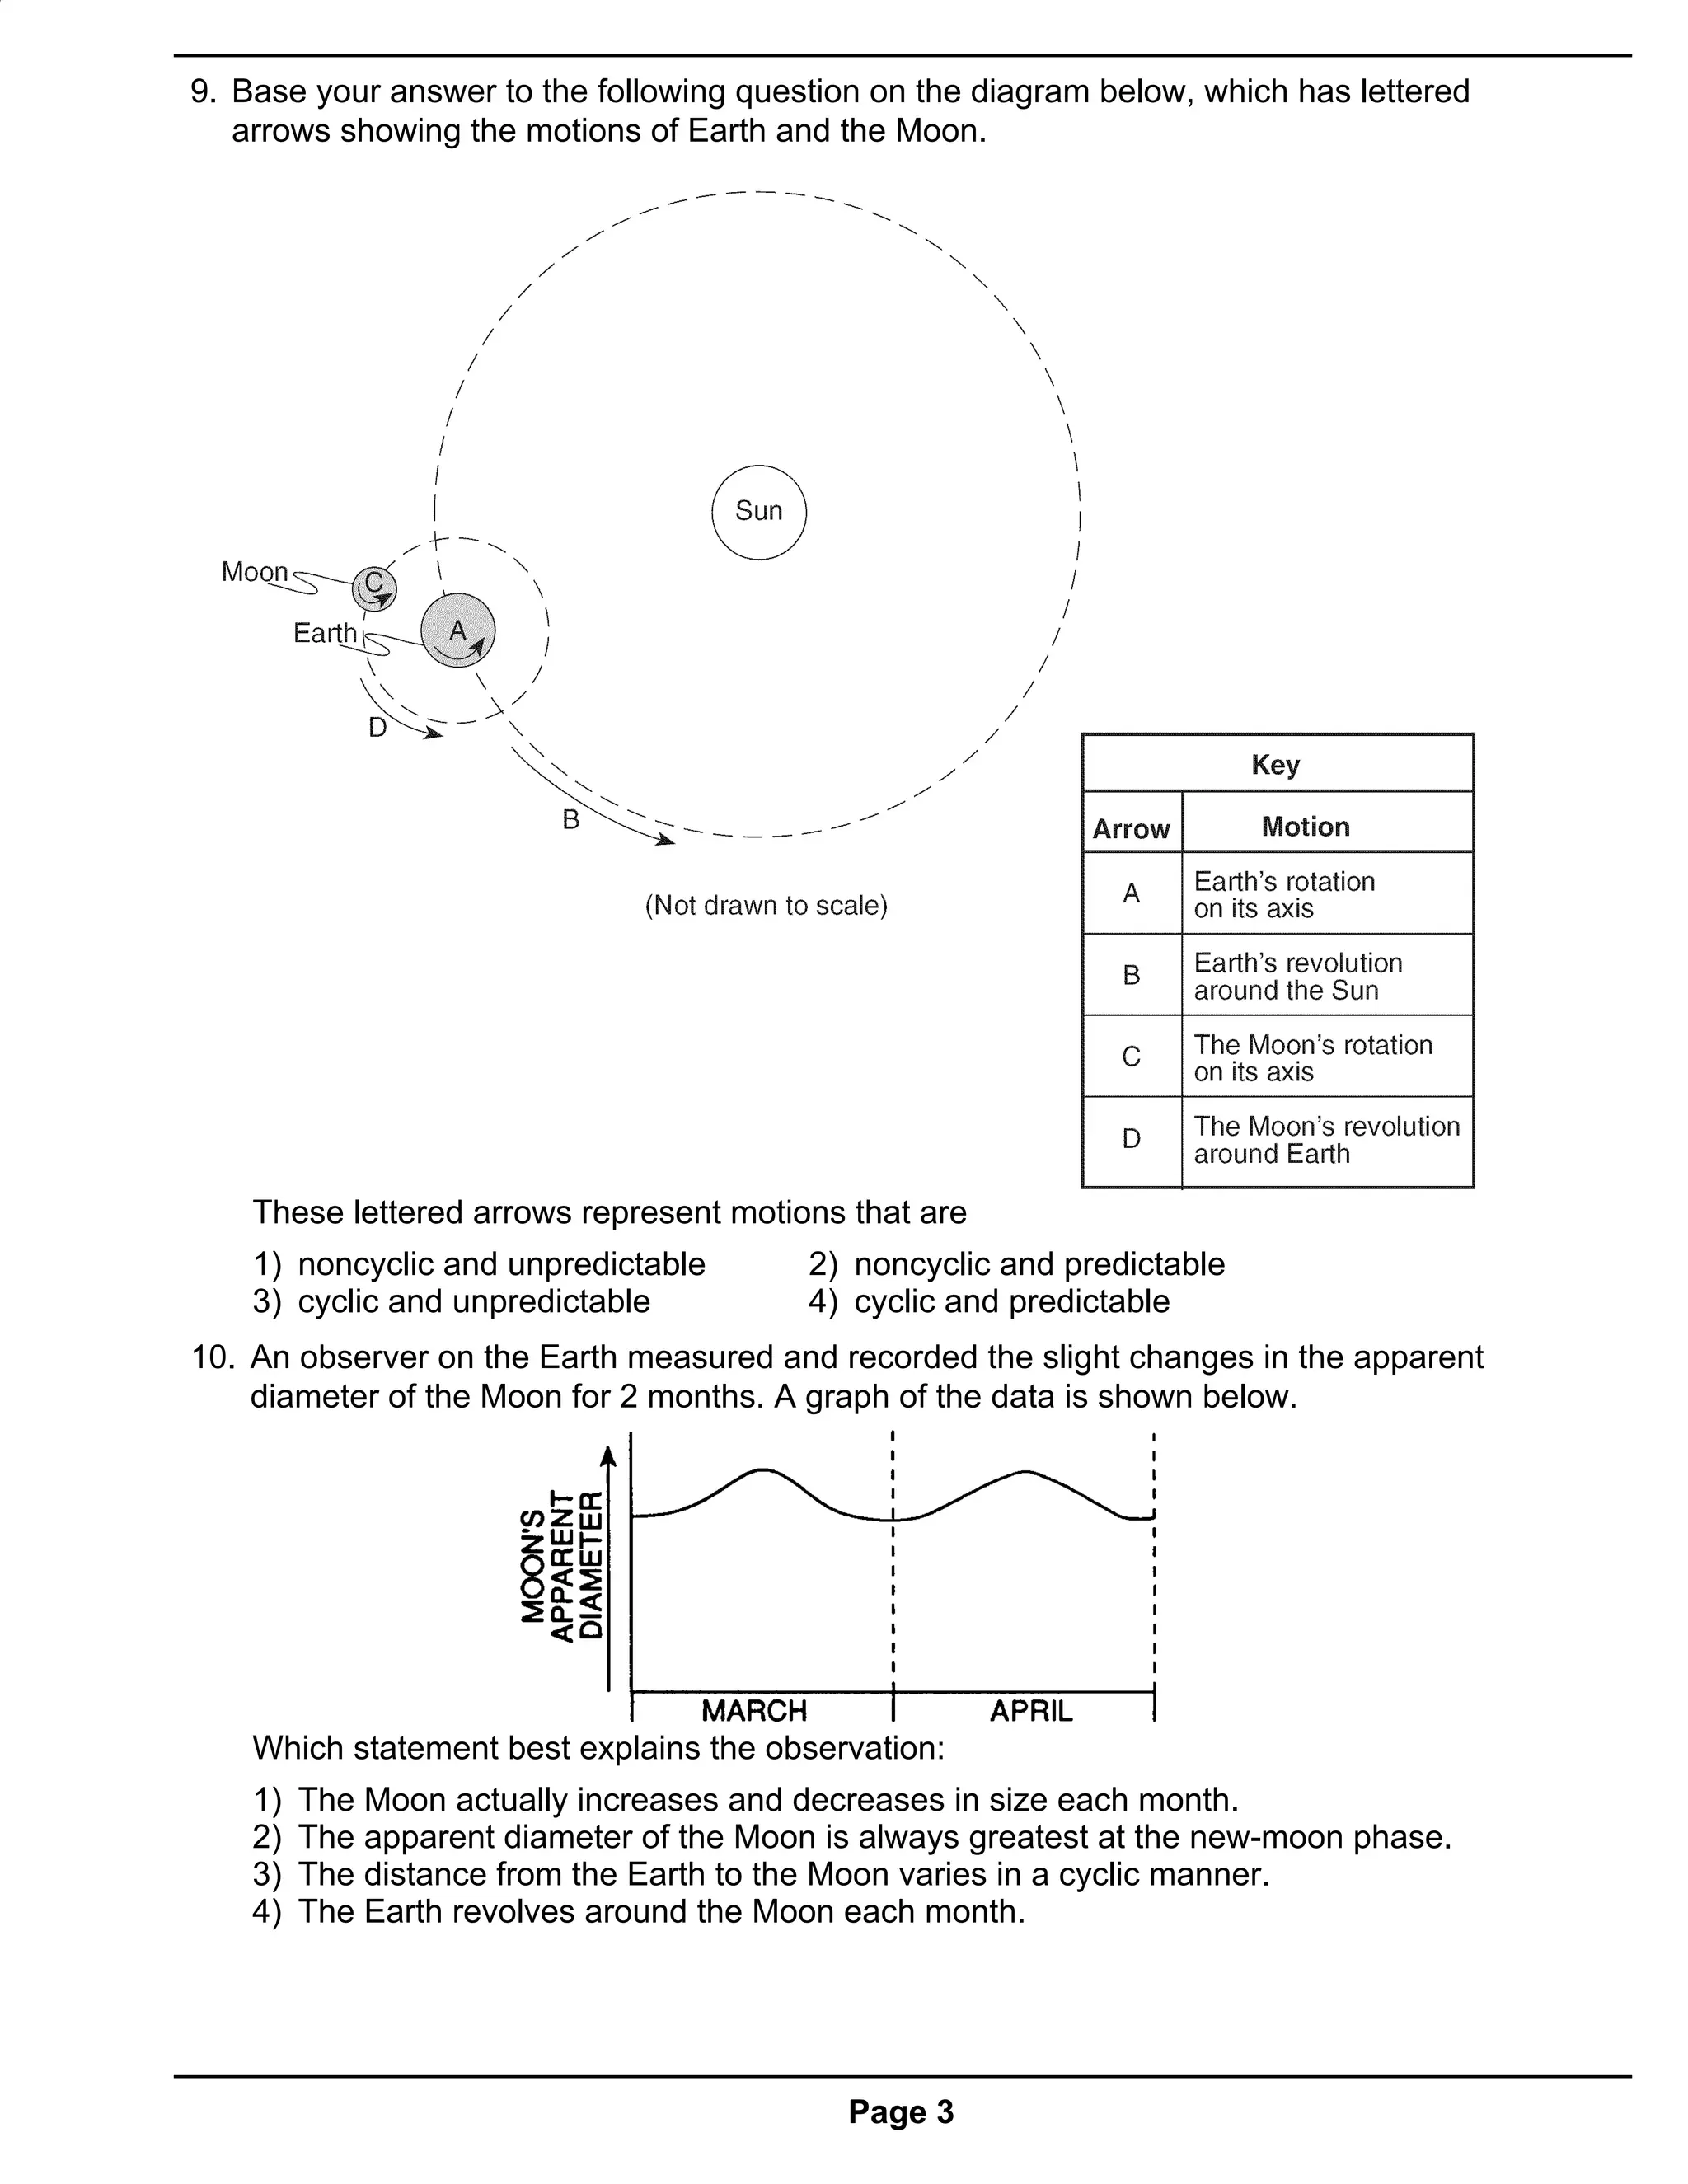
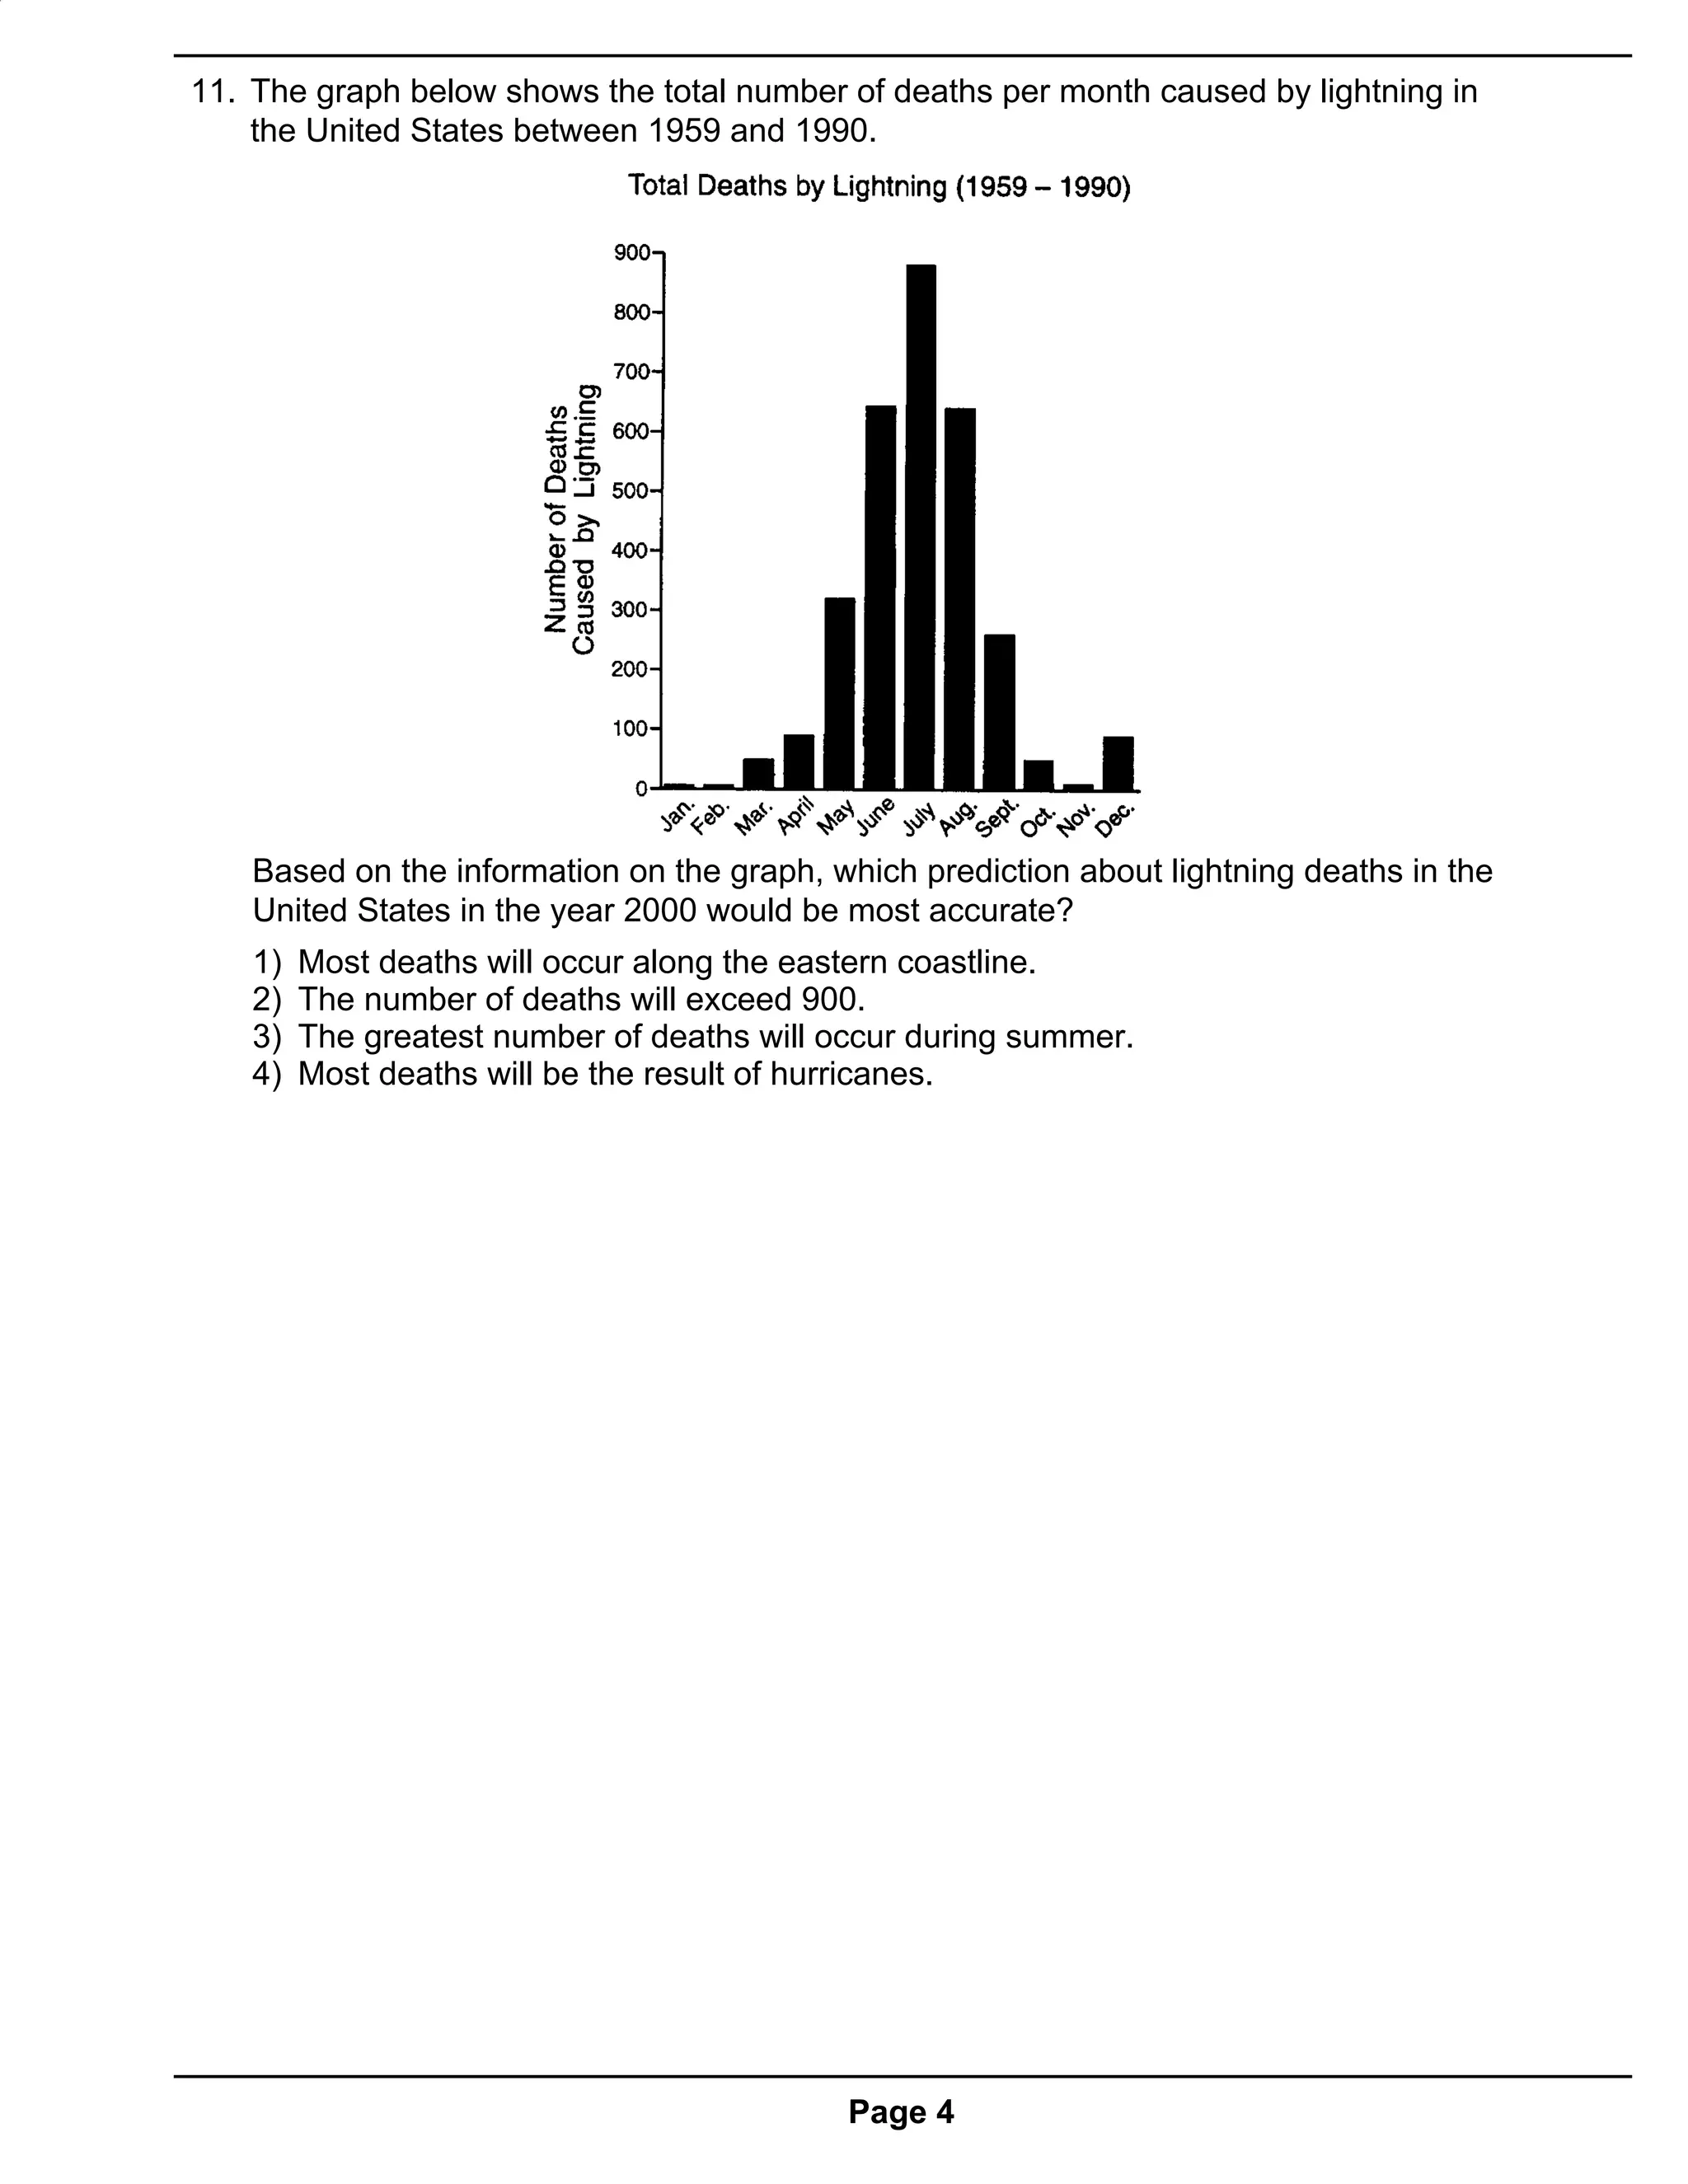
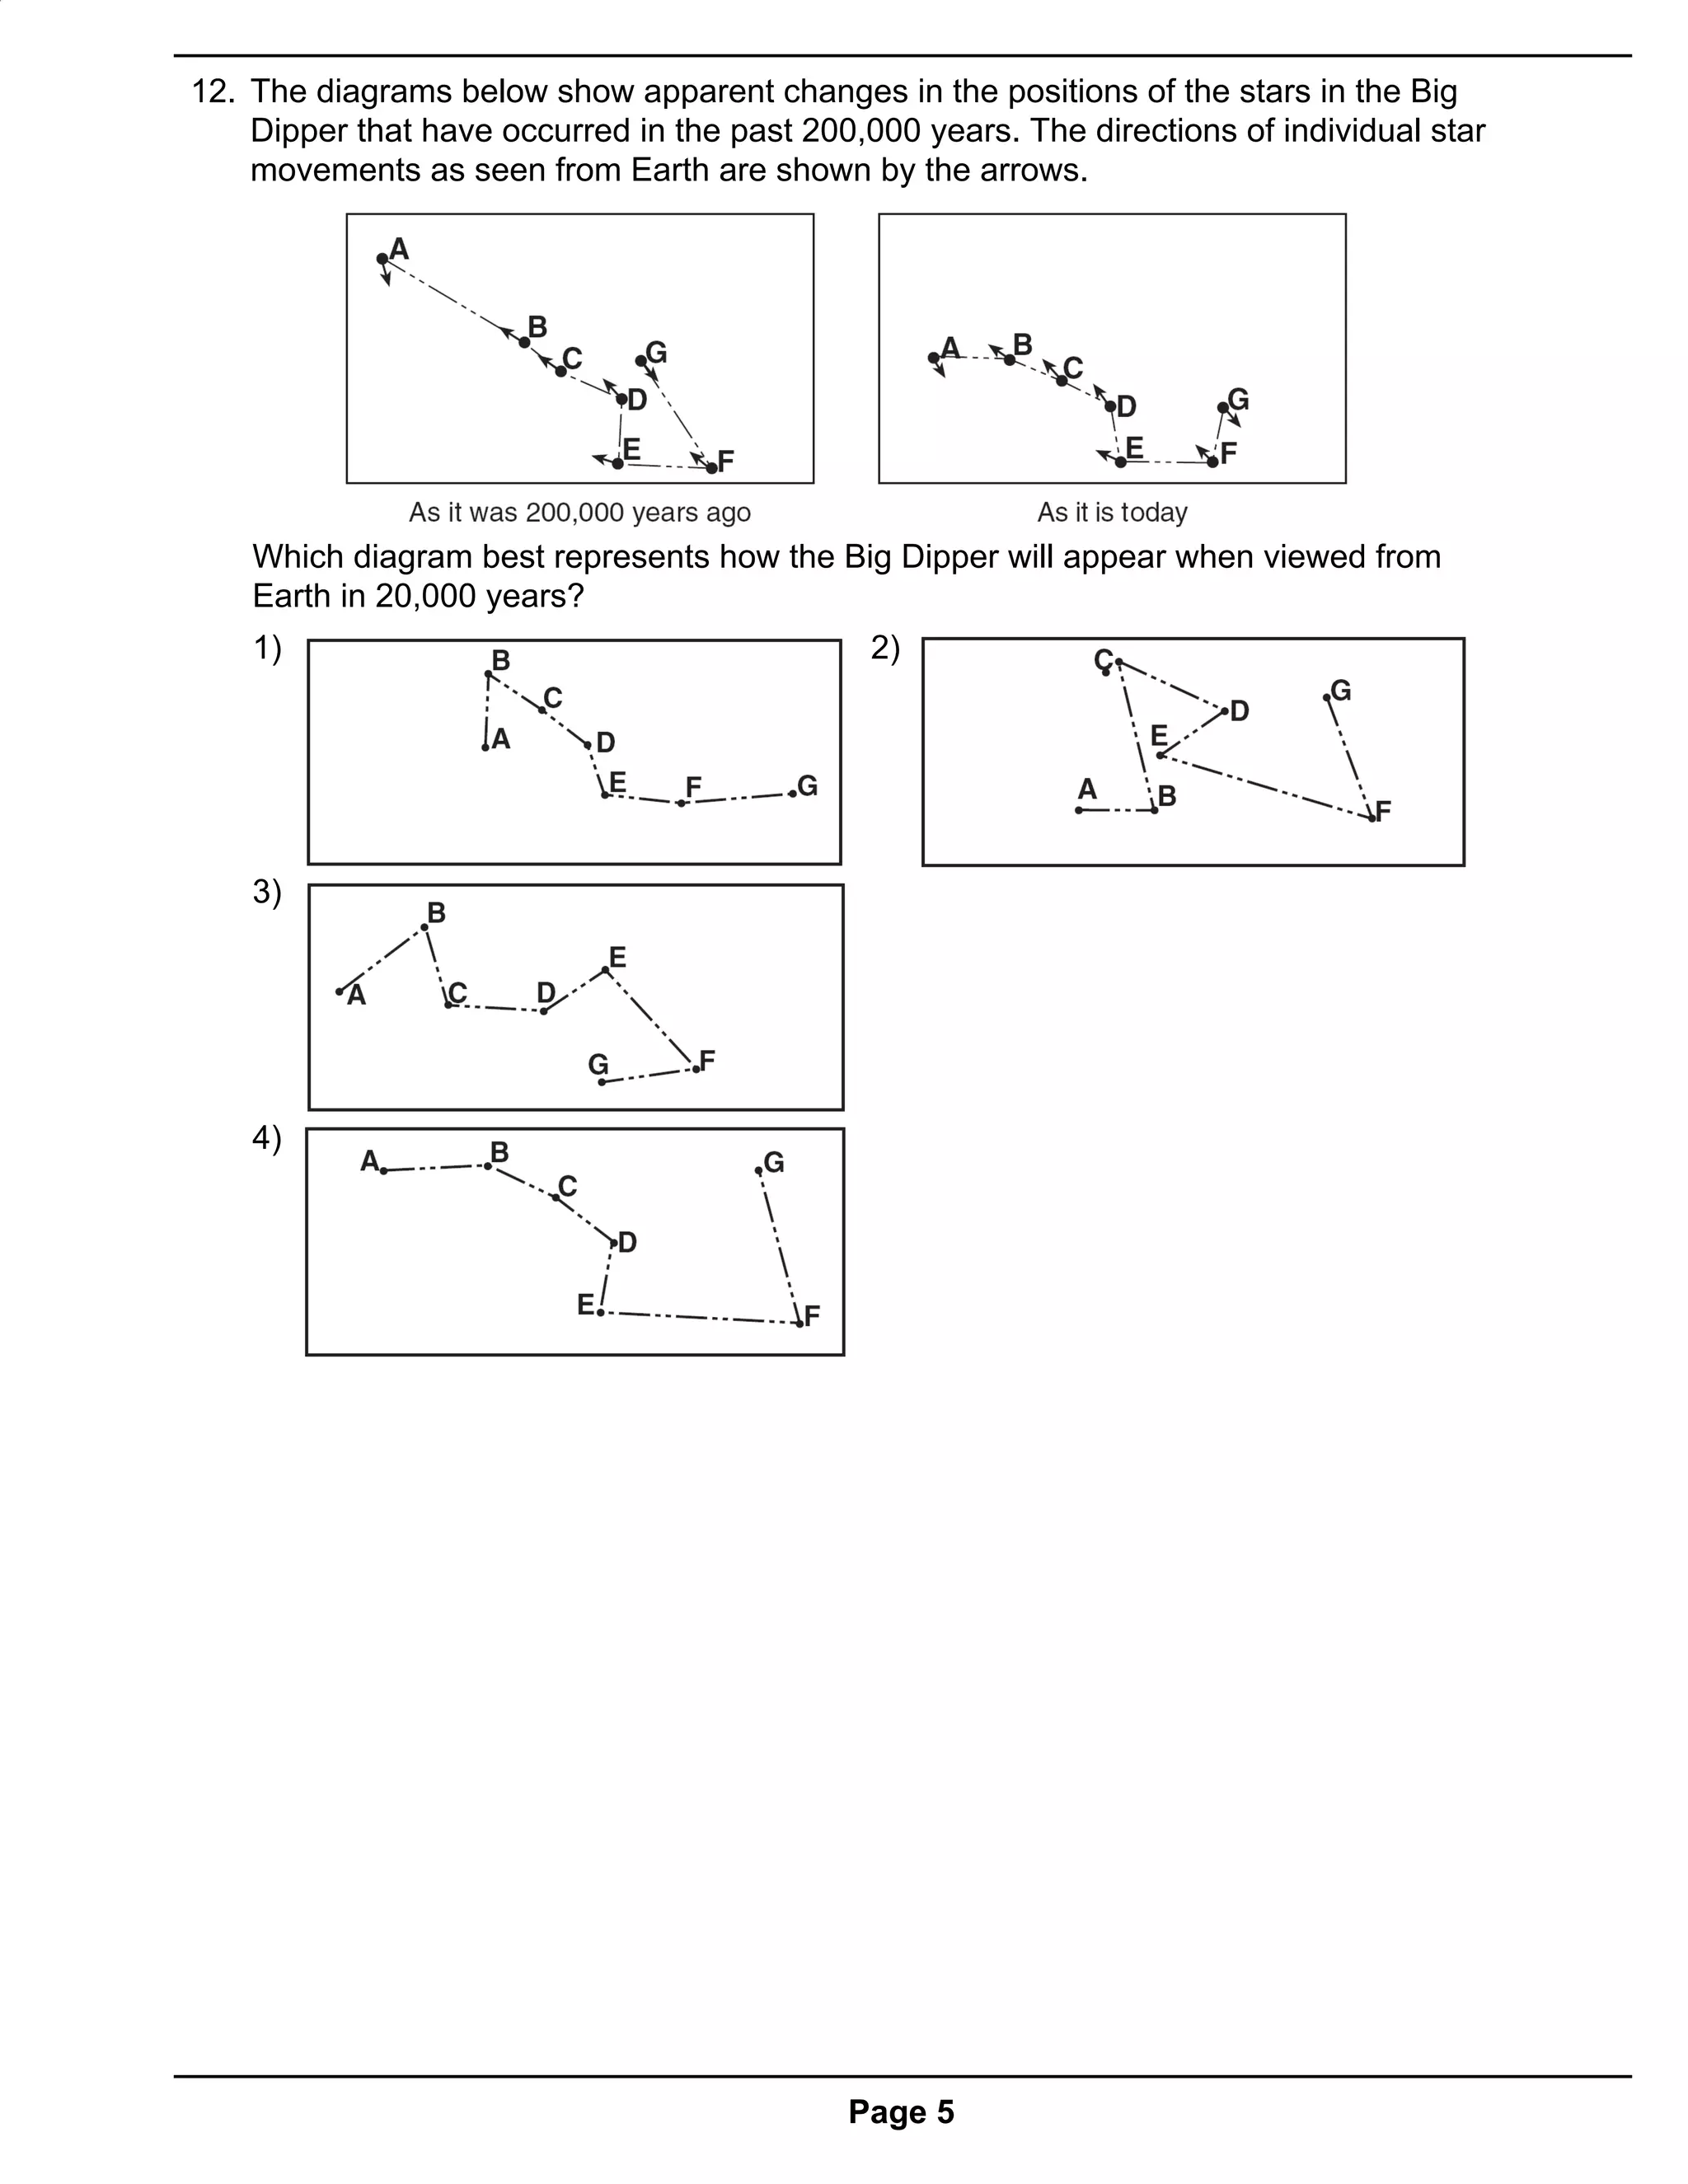
Name:_____________________________________________________________
                               Period:____________          Date:________________
Homework                                                                               Rate of Change

    Base your answer to questions 1 and 2 on the information about a laboratory
    procedure, diagram, and data table below.

                Hot water at 90°C is poured into cup A. Cool water at 20°C is poured
            into cup B. Styrofoam covers are placed on the cups. An aluminum bar
            and a thermometer are placed through holes in each cover. Points X and
            Y are locations on the aluminum bar. The data table shows temperature
            readings taken every minute for 20 minutes.


  1. Which change in the experiment would increase the heating rate of the water in cup B
     ?
    1)   making the aluminum bar shorter between points X and Y
    2)   making the aluminum bar longer between points X and Y
    3)   keeping cup A covered, but uncovering cup B
    4)   keeping cup B covered, but uncovering cup A
  2. The rate of temperature change for the water in cup A for the first 10 minutes was
     approximately
    1) 0.77 C ° /min 2) 1.3 C ° /min   3) 7.7 C ° /min   4) 13.0 C ° /min

  3. A 25-gram sample of halite was placed in a jar with five other mineral samples and
     water. The jar was shaken vigorously for 5 minutes. The halite sample was then
     found to have a mass of 15 grams. What was the rate of weathering of the halite
     sample?
    1) 0.50 g/min     2) 2.0 g/min     3) 3.0 g/min      4) 10. g/min


                                               Page 1
4. The graph below shows world population beginning in the year 1800 and projected to
   the year 2000.


    The graph shows the greatest increase in population between
    1) 1825 and 1850                         2) 1875 and 1900
    3) 1925 and 1950                         4) 1975 and 2000
5. Two geologic surveys of the same area, made 50 years apart, showed that the area
   had been uplifted 5 centimeters during the interval. If the rate of uplift remains
   constant, how many years will it take for this area to be uplifted a total of 70
   centimeters?
   1) 250 years       2) 350 years     3) 500 years      4) 700 years
6. Which event is most predictable?
   1)   The Sun rises.
   2)   An earthquake occurs.
   3)   A meteorite falls to Earth.
   4)   Coral fossils are found on mountaintops.
7. An observer recorded the times of three successive high tides at one Earth location
   as:

   • 7:12 a.m.
   • 7:38 p.m.
   • 8:04 a.m.

   What was the time of the next high tide?
   1) 8:12 p.m.       2) 8:30 p.m.     3) 8:38 p.m.      4) 9:04 p.m.
8. Future changes in the environment can best be predicted from data that are
   1)   highly variable and collected over short periods of time
   2)   highly variable and collected over long periods of time
   3)   cyclic and collected over short periods of time
   4)   cyclic and collected over long periods of time


                                               Page 2
9. Base your answer to the following question on the diagram below, which has lettered
   arrows showing the motions of Earth and the Moon.


    These lettered arrows represent motions that are
    1) noncyclic and unpredictable        2) noncyclic and predictable
    3) cyclic and unpredictable           4) cyclic and predictable
10. An observer on the Earth measured and recorded the slight changes in the apparent
    diameter of the Moon for 2 months. A graph of the data is shown below.


    Which statement best explains the observation:
    1)   The Moon actually increases and decreases in size each month.
    2)   The apparent diameter of the Moon is always greatest at the new-moon phase.
    3)   The distance from the Earth to the Moon varies in a cyclic manner.
    4)   The Earth revolves around the Moon each month.


                                            Page 3
11. The graph below shows the total number of deaths per month caused by lightning in
    the United States between 1959 and 1990.


    Based on the information on the graph, which prediction about lightning deaths in the
    United States in the year 2000 would be most accurate?
    1)   Most deaths will occur along the eastern coastline.
    2)   The number of deaths will exceed 900.
    3)   The greatest number of deaths will occur during summer.
    4)   Most deaths will be the result of hurricanes.


                                             Page 4
12. The diagrams below show apparent changes in the positions of the stars in the Big
    Dipper that have occurred in the past 200,000 years. The directions of individual star
    movements as seen from Earth are shown by the arrows.


    Which diagram best represents how the Big Dipper will appear when viewed from
    Earth in 20,000 years?
    1)                                         2)


    3)


    4)


                                             Page 5

Rate of change student's copy

  • 1.
    Name:_____________________________________________________________ Period:____________ Date:________________ Homework Rate of Change Base your answer to questions 1 and 2 on the information about a laboratory procedure, diagram, and data table below. Hot water at 90°C is poured into cup A. Cool water at 20°C is poured into cup B. Styrofoam covers are placed on the cups. An aluminum bar and a thermometer are placed through holes in each cover. Points X and Y are locations on the aluminum bar. The data table shows temperature readings taken every minute for 20 minutes. 1. Which change in the experiment would increase the heating rate of the water in cup B ? 1) making the aluminum bar shorter between points X and Y 2) making the aluminum bar longer between points X and Y 3) keeping cup A covered, but uncovering cup B 4) keeping cup B covered, but uncovering cup A 2. The rate of temperature change for the water in cup A for the first 10 minutes was approximately 1) 0.77 C ° /min 2) 1.3 C ° /min 3) 7.7 C ° /min 4) 13.0 C ° /min 3. A 25-gram sample of halite was placed in a jar with five other mineral samples and water. The jar was shaken vigorously for 5 minutes. The halite sample was then found to have a mass of 15 grams. What was the rate of weathering of the halite sample? 1) 0.50 g/min 2) 2.0 g/min 3) 3.0 g/min 4) 10. g/min Page 1
  • 2.
    4. The graphbelow shows world population beginning in the year 1800 and projected to the year 2000. The graph shows the greatest increase in population between 1) 1825 and 1850 2) 1875 and 1900 3) 1925 and 1950 4) 1975 and 2000 5. Two geologic surveys of the same area, made 50 years apart, showed that the area had been uplifted 5 centimeters during the interval. If the rate of uplift remains constant, how many years will it take for this area to be uplifted a total of 70 centimeters? 1) 250 years 2) 350 years 3) 500 years 4) 700 years 6. Which event is most predictable? 1) The Sun rises. 2) An earthquake occurs. 3) A meteorite falls to Earth. 4) Coral fossils are found on mountaintops. 7. An observer recorded the times of three successive high tides at one Earth location as: • 7:12 a.m. • 7:38 p.m. • 8:04 a.m. What was the time of the next high tide? 1) 8:12 p.m. 2) 8:30 p.m. 3) 8:38 p.m. 4) 9:04 p.m. 8. Future changes in the environment can best be predicted from data that are 1) highly variable and collected over short periods of time 2) highly variable and collected over long periods of time 3) cyclic and collected over short periods of time 4) cyclic and collected over long periods of time Page 2
  • 3.
    9. Base youranswer to the following question on the diagram below, which has lettered arrows showing the motions of Earth and the Moon. These lettered arrows represent motions that are 1) noncyclic and unpredictable 2) noncyclic and predictable 3) cyclic and unpredictable 4) cyclic and predictable 10. An observer on the Earth measured and recorded the slight changes in the apparent diameter of the Moon for 2 months. A graph of the data is shown below. Which statement best explains the observation: 1) The Moon actually increases and decreases in size each month. 2) The apparent diameter of the Moon is always greatest at the new-moon phase. 3) The distance from the Earth to the Moon varies in a cyclic manner. 4) The Earth revolves around the Moon each month. Page 3
  • 4.
    11. The graphbelow shows the total number of deaths per month caused by lightning in the United States between 1959 and 1990. Based on the information on the graph, which prediction about lightning deaths in the United States in the year 2000 would be most accurate? 1) Most deaths will occur along the eastern coastline. 2) The number of deaths will exceed 900. 3) The greatest number of deaths will occur during summer. 4) Most deaths will be the result of hurricanes. Page 4
  • 5.
    12. The diagramsbelow show apparent changes in the positions of the stars in the Big Dipper that have occurred in the past 200,000 years. The directions of individual star movements as seen from Earth are shown by the arrows. Which diagram best represents how the Big Dipper will appear when viewed from Earth in 20,000 years? 1) 2) 3) 4) Page 5