Downloaded 376 times


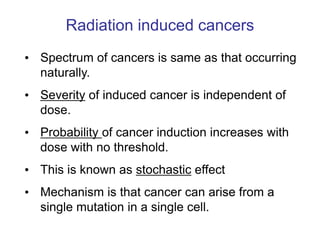


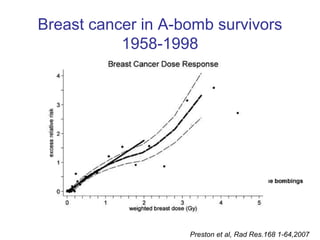


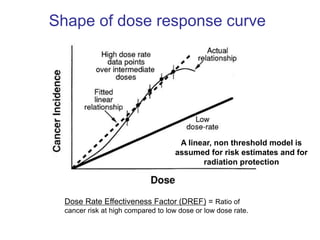
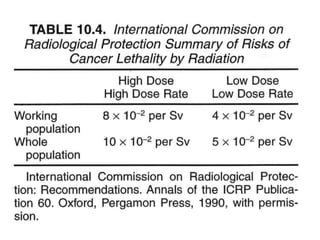

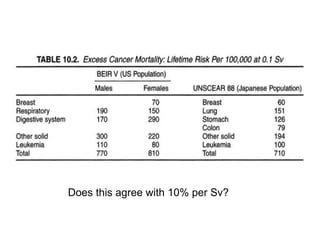

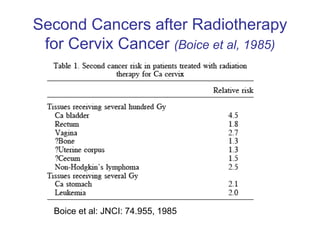


Radiation can cause both deterministic and stochastic effects. Deterministic effects have a threshold dose and increase in severity with higher doses, while stochastic effects like cancer have no threshold and risk increases with any dose but severity is independent of dose. Studies of radiation exposures from radium dial painters, atomic bomb survivors, and medical treatments provide data showing radiation is a carcinogen and mutagen, and the risk of cancer increases linearly with dose without a threshold. The lifetime cancer risk from radiation is estimated to be 10% per sievert of exposure at high doses.


