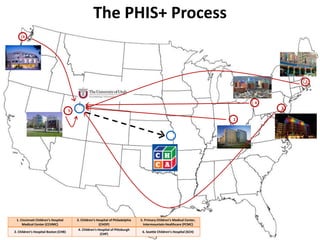
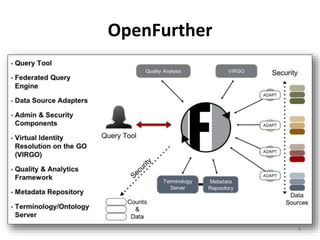
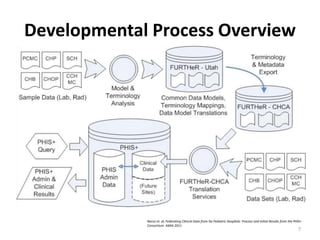
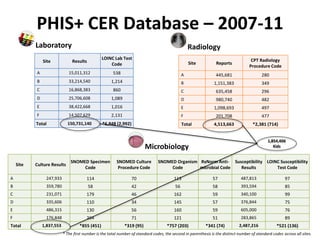
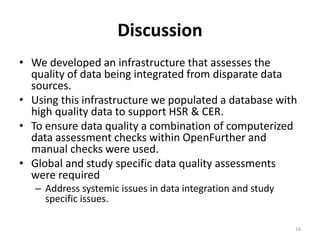
This document summarizes a presentation about ensuring data quality in the PHIS+ consortium, which integrates clinical and administrative data across multiple children's hospitals for comparative effectiveness research. It describes the process of developing common data models, semantically mapping local data elements to standards, collecting data using a toolkit with validation, processing the data through a platform to standardize terminology and storage, and conducting various automated and manual checks for data quality issues. These included checks for missing or invalid data, relationships between test results and specimens/cultures, and study-specific assessments through chart review. The final database contained over 4.5 million records across various domains with standardized coding to support health services research.
![Acknowledgements
• Raj Srivastava, MD, MPH
• Ron Keren MD, MPH
• OpenFurther Team members
• PHIS+ Team members across multiple institutions
• Apelon
• FURTHeR development was supported by the NCRR and the NCATS, NIH, through
Grant UL1RR025764 and supplement 3UL1RR025764-02S2. This project was
funded under grant number R01 HS019862-01 from the AHRQ, U.S. Department of
Health and Human Services (HHS). The opinions expressed [in this document] are
those of the authors and do not reflect the official position of AHRQ or the HHS.
• PHIS+: www.childrenshospitals.org/phisplus/index.html
2](https://image.slidesharecdn.com/rgouripeddifinalhsrslides-150416132757-conversion-gate01/85/10th-Annual-Utah-s-Health-Services-Research-Conference-Data-Quality-in-Multi-Site-Health-Services-and-Comparative-Effective-Research-Lessons-from-PHIS-By-Ram-Gouripeddi-2-320.jpg)
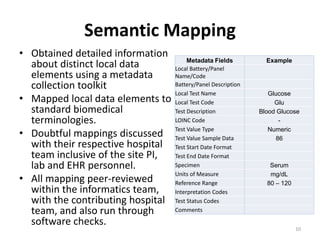
![Differences in Local Coding Schemas
C Reactive
Protein
[Mass/volume]
in Serum or
Plasma (1988-5)
C Reactive
Protein
(8726)
C Reactive
Protein
(CRPT)
CRP (CRP)
CRP Test
(700111)
C-Reactive
Protein
(801582)
C R Protein
(801679)
11
Nanogram/
Decilitre
(258805003)
NG/DL
ng/dL
ng/dL
ng per
dL
ng/Dl
ng per
dL
Laboratory Test Unit of Measure](https://image.slidesharecdn.com/rgouripeddifinalhsrslides-150416132757-conversion-gate01/85/10th-Annual-Utah-s-Health-Services-Research-Conference-Data-Quality-in-Multi-Site-Health-Services-and-Comparative-Effective-Research-Lessons-from-PHIS-By-Ram-Gouripeddi-11-320.jpg)
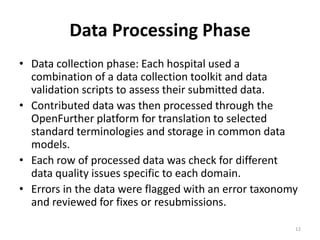
![Study Specific Quality Assessment
• Individual studies have
different granularities and
specificities in their data
requirements.
• We undertook a second set
of data quality assessments
at the study cohort level.
• This included a chart review
of a significant sample
within each study cohort.
14
0
5000
10000
15000
20000
25000
30000
35000
0.6
1.9
2.9
3.76
4.5
5.4
6.4
7.4
8.4
9.4
10.4
11.4
12.6
13.7
****
>9.0
QNStorepeat
2823-3: Potassium
[Moles/volume] in Serum or
Plasma](https://image.slidesharecdn.com/rgouripeddifinalhsrslides-150416132757-conversion-gate01/85/10th-Annual-Utah-s-Health-Services-Research-Conference-Data-Quality-in-Multi-Site-Health-Services-and-Comparative-Effective-Research-Lessons-from-PHIS-By-Ram-Gouripeddi-14-320.jpg)


![PERI-PROSTHETIC FRACTURE NAIL-PLATE CONSTRUCT [NPC].pptx](https://cdn.slidesharecdn.com/ss_thumbnails/drarunkumardrmohamedashrafperiprostheticfrasturenail-plateconstructnpc-260209164459-7e9d15a1-thumbnail.jpg?width=640&height=640&fit=bounds)

![ONFH[AVN HIP] -TRIPLE REGIME -A NOVAL SURGICAL CONCEPT .pptx](https://cdn.slidesharecdn.com/ss_thumbnails/onfhavnhip2026koaconcalicutdrgokuldevdrmashraf-260210064517-213ec005-thumbnail.jpg?width=640&height=640&fit=bounds)


