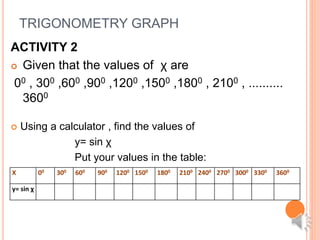
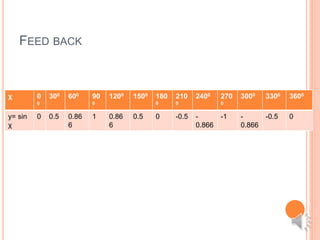
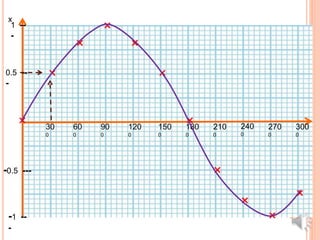
TRIGONOMETRY 2
SIMPLE TRIGONOMETRY GRAPH
Sin graph
RECAP
 ACTIVITY 1:
 Use calculator to find:
sin 300
TO DEMONSTRATE:
Step 1
key in sin
Step 2
key in 300
sin 300 = 0.5
RATIONALE
Architects use trigonometry to
calculate structural load, roof
slopes, ground surfaces and
other aspects, such as sun
shading and light angles when
drawing house plans.
It is used in oceanography in
calculating the height of tides in
oceans to provide information for
travellers by ship.
TRIGONOMETRY GRAPH
ACTIVITY 2
 Given that the values of χ are
00 , 300 ,600 ,900 ,1200 ,1500 ,1800 , 2100 , ..........
3600
 Using a calculator , find the values of
y= sin χ
Put your values in the table:
X 00 300 600 900 1200 1500 1800 2100 2400 2700 3000 3300 3600
y= sin χ
FEED BACK
χ 0
0
300 600 90
0
1200 1500 180
0
210
0
2400 270
0
3000 3300 3600
y= sin
χ
0 0.5 0.86
6
1 0.86
6
0.5 0 -0.5 -
0.866
-1 -
0.866
-0.5 0
ACTIVITY 3: GROUP WORK
Using the values on the table , Draw a graph of
y= sin χ for 00≤ x ≥ 3600
What are the key steps in drawing trigonometry
graph?
y
x
0.5 --
-
1 --
-
-0.5 ---
-1 --
-
30
0
60
0
90
0
120
0
150
0
180
0
×
×
×
×
×
××
×
210
0
240
0
270
0
300
0
×
×
×
INDIVIDUAL WORK
Draw a graph of y= Cos χ for 00≤ x ≥ 3600
CONCLUSION
To have a nice trigonometry curve, what are some
key points to consider?
ASSIGNMENT AND FURTHER WORK
 Draw the graph of
y= 2 sin x for 00≤ x ≥ 3600
Trigonometry 2

Trigonometry 2