
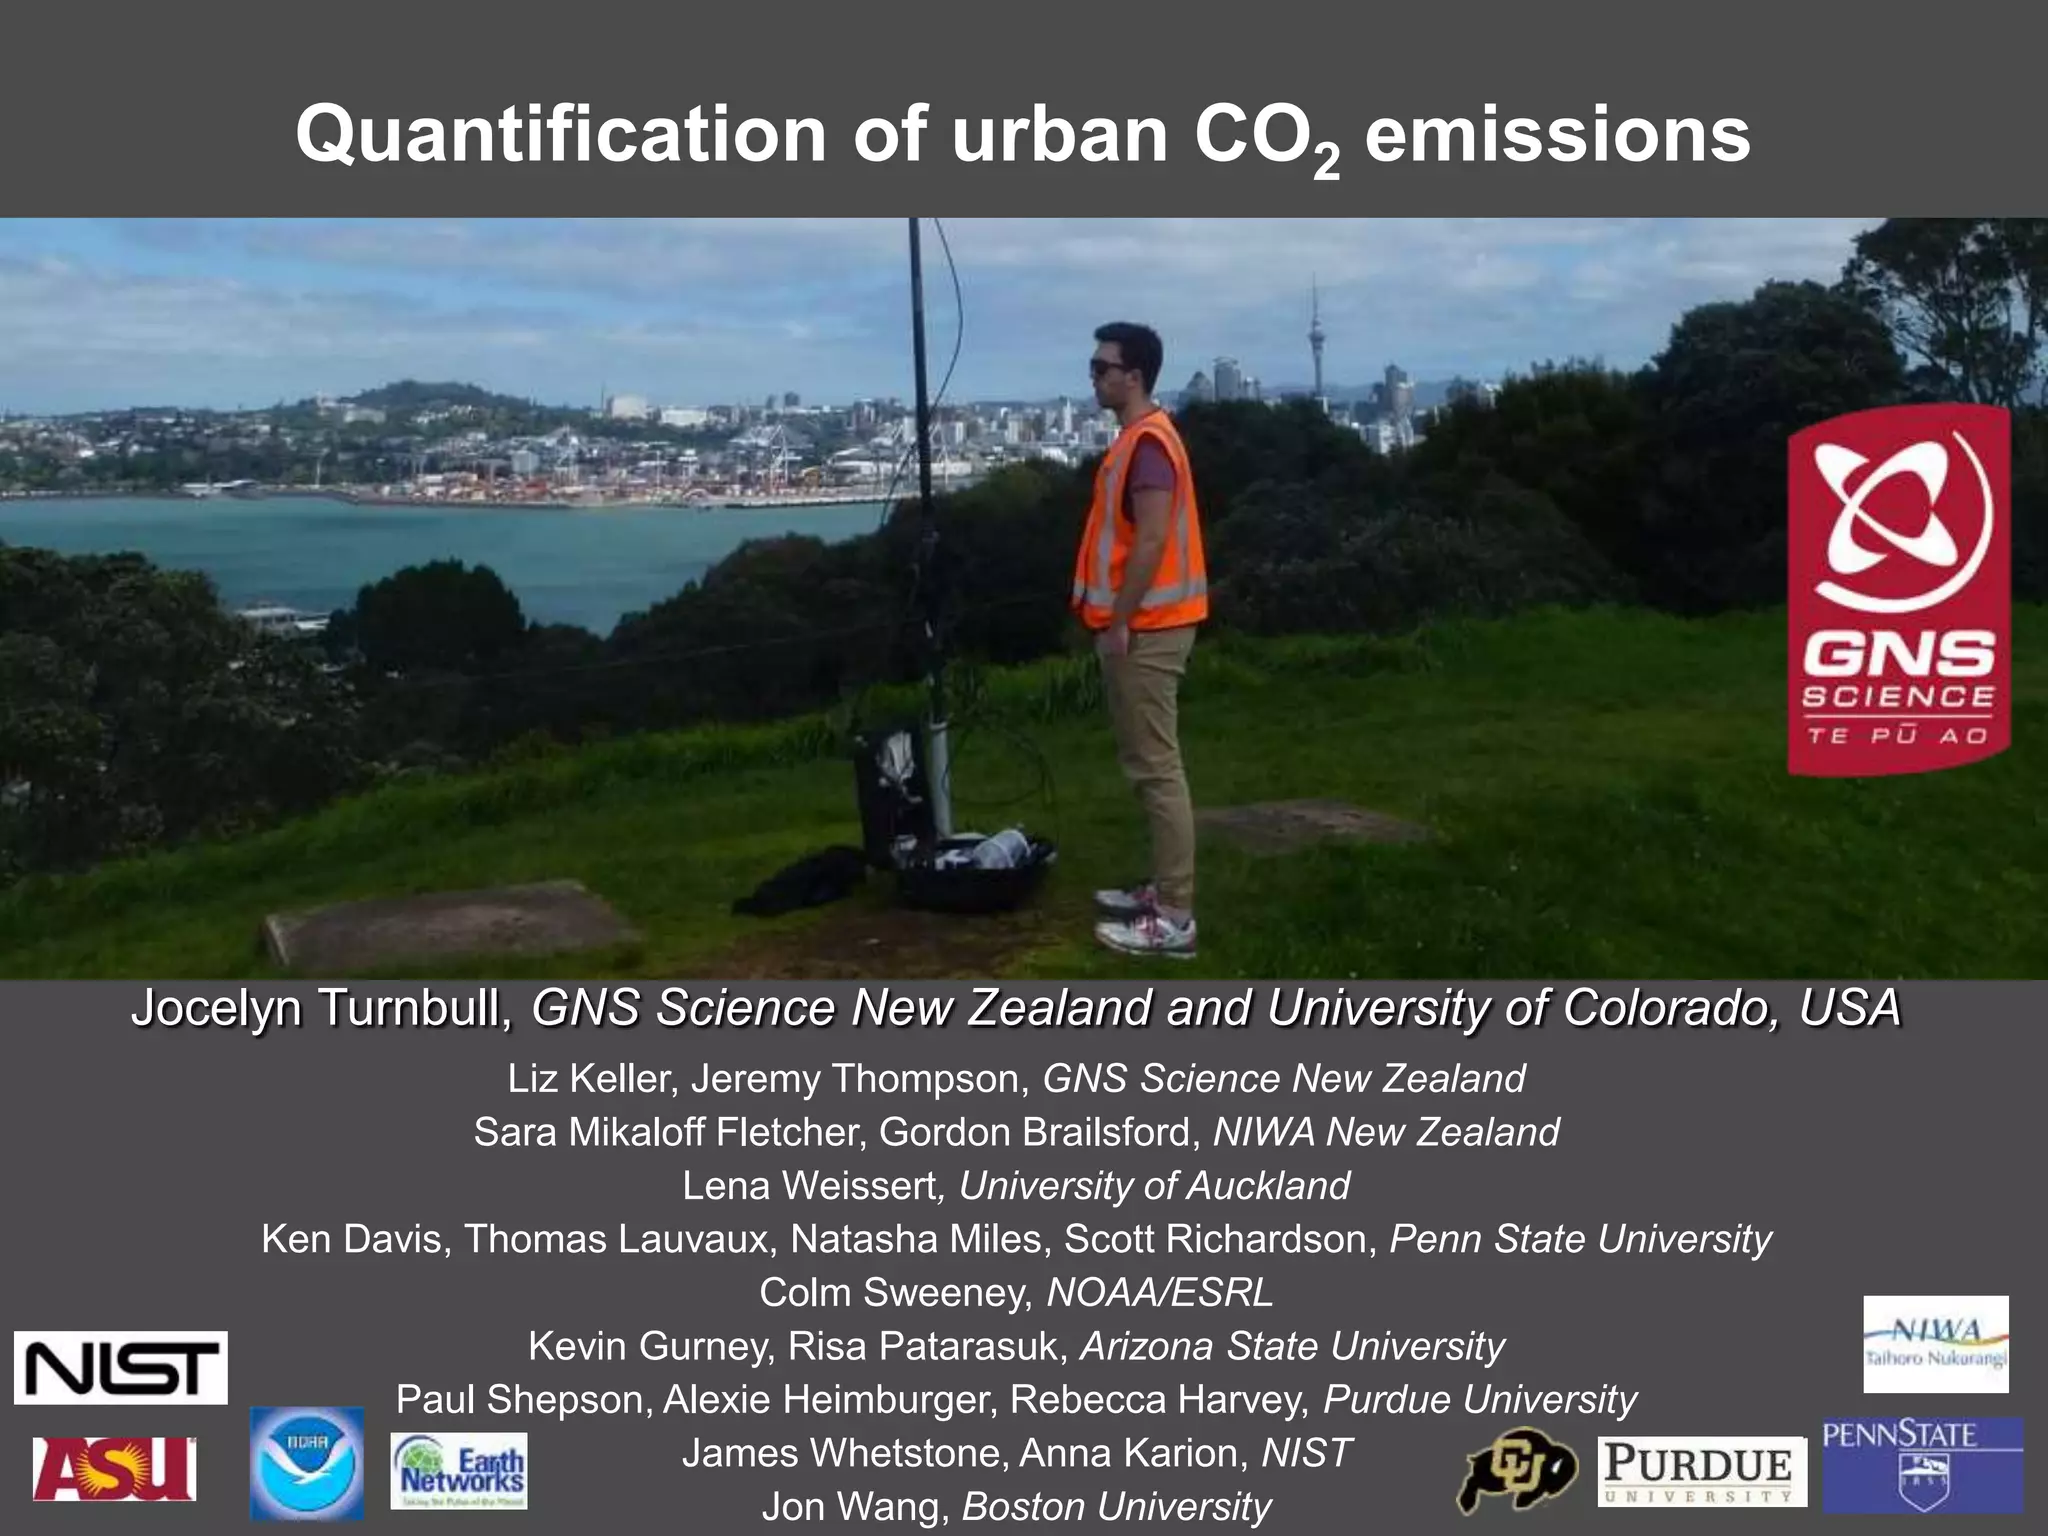
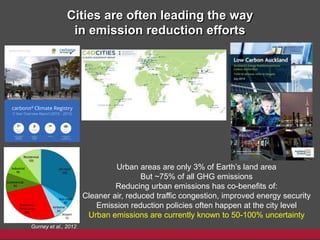
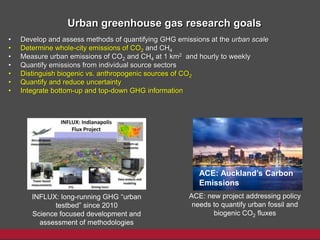
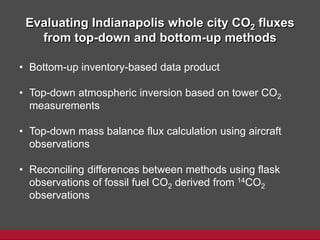
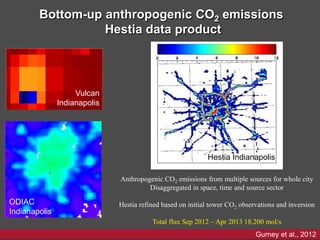
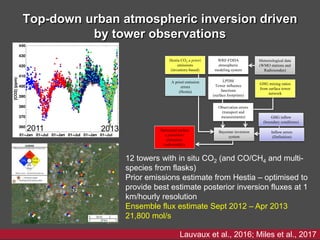
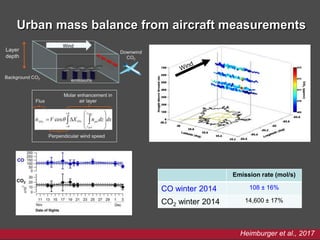
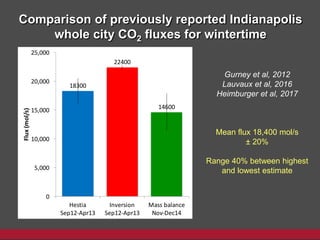
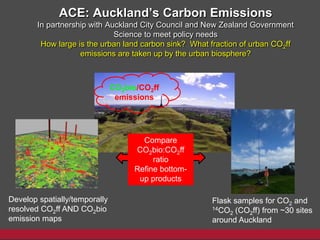
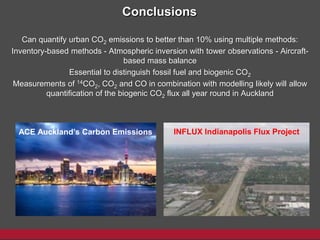

1) The document summarizes efforts to quantify urban greenhouse gas (GHG) emissions, specifically carbon dioxide (CO2), through both top-down atmospheric measurements and bottom-up inventory methods. 2) A key goal is to reconcile differences between top-down and bottom-up estimates of whole-city CO2 emissions in Indianapolis, finding final agreement within 7% once various factors are accounted for. 3) A new project called ACE (Auckland's Carbon Emissions) aims to quantify both fossil fuel and biogenic CO2 fluxes in Auckland to meet policy needs, given most current estimates exclude urban land carbon.


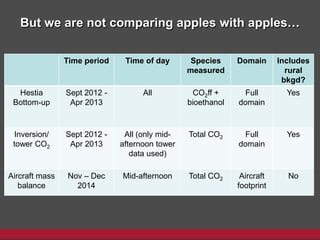
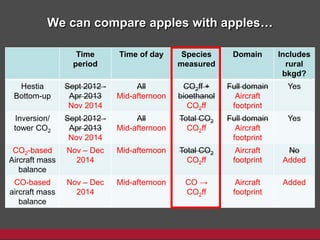
![Polymer [ बहुलक ] Chemistry Notes PDF - Irfanullah Mehar - JJ Sir Chemistry.pdf](https://cdn.slidesharecdn.com/ss_thumbnails/polymerchemistrynotespdf-irfanullahmehar-jjsirchemistry-260210172118-3f9b37f7-thumbnail.jpg?width=640&height=640&fit=bounds)


