Download to read offline
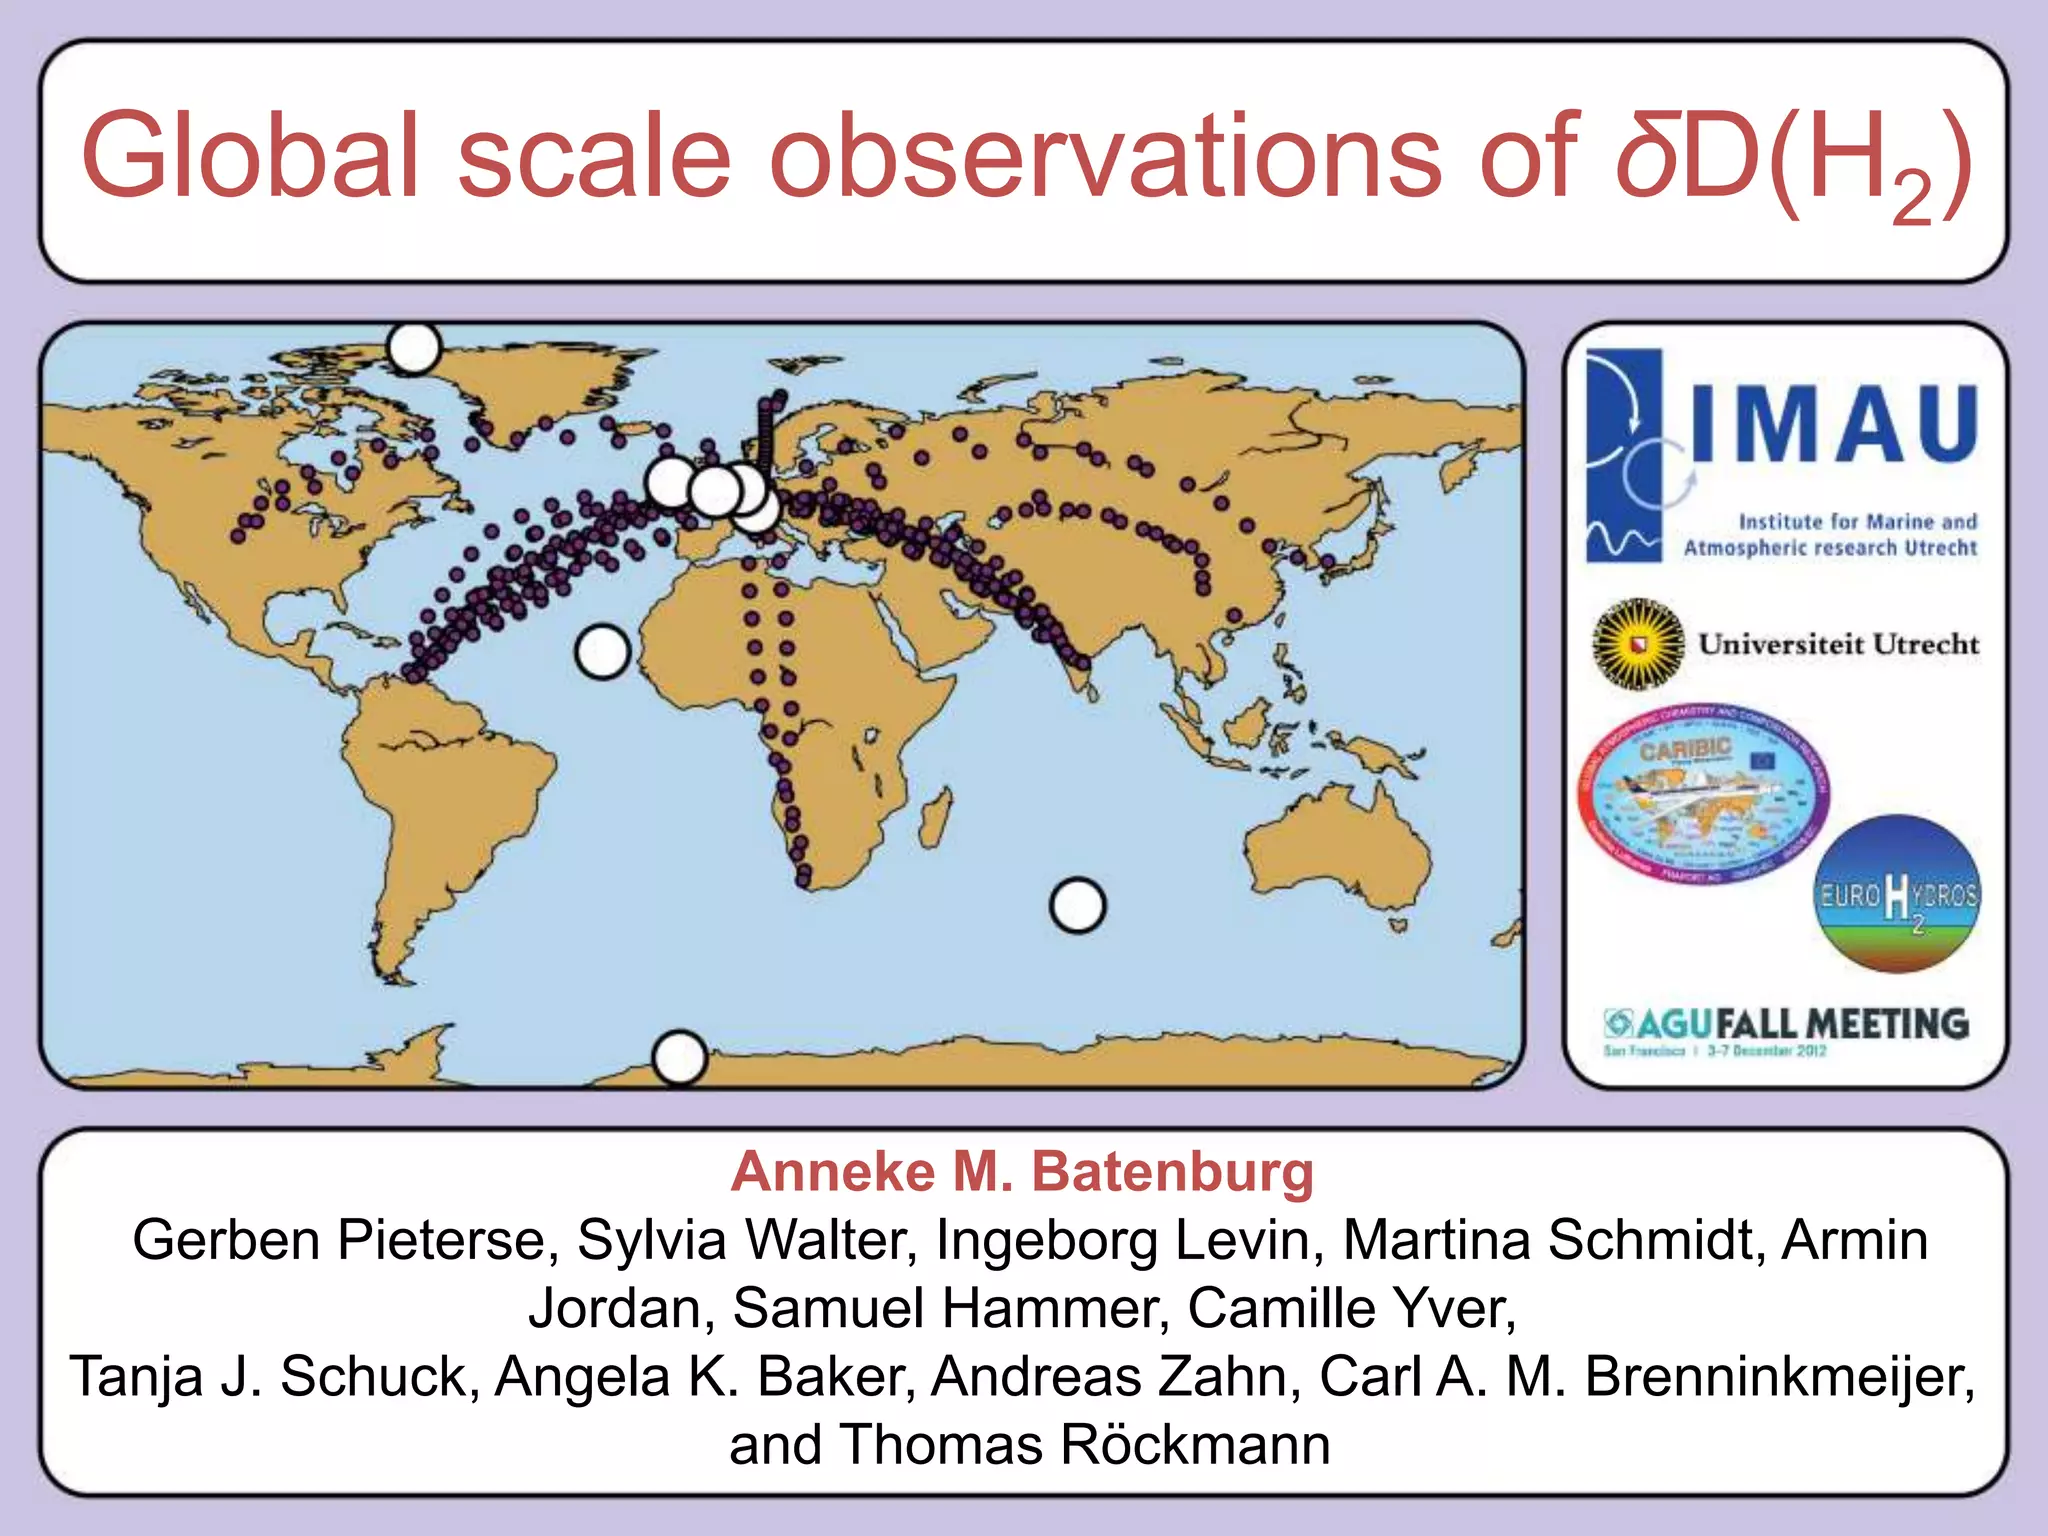
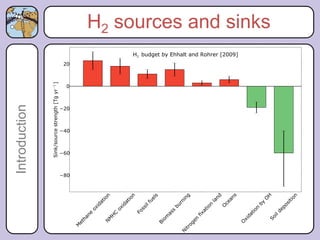
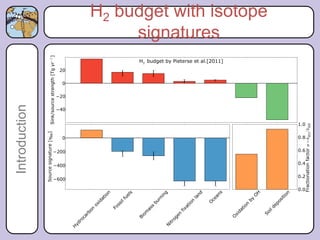
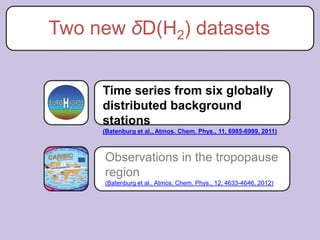
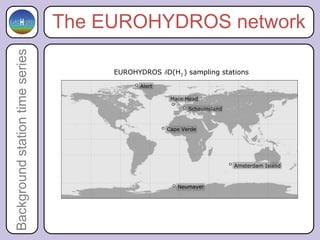
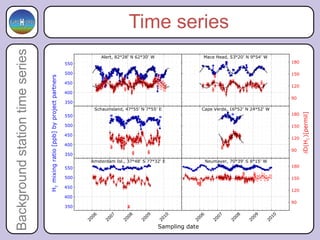
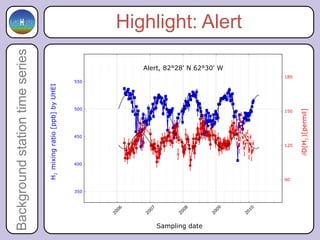
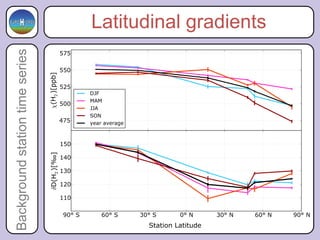
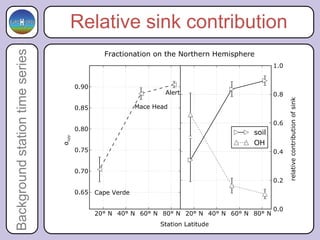
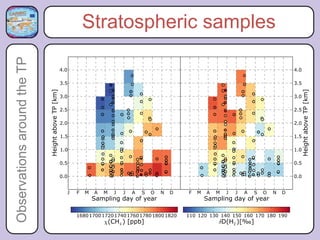
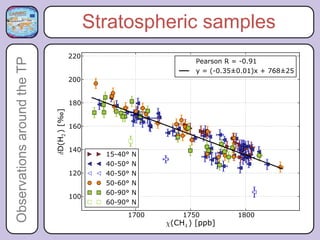
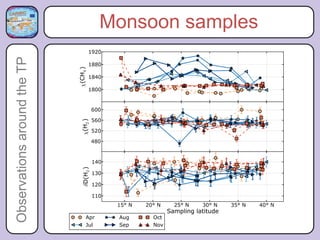


This document presents global observations of δD(H2) from multiple background stations and highlights new datasets that reveal seasonal and latitudinal variations in H2 levels. It discusses the impact of stratospheric processing on H2 mixing ratios and delves into isotope data's role in enhancing atmospheric models. The findings may also indicate potential new H2 sources over regions like India.