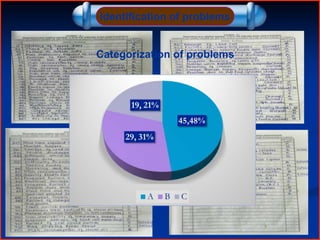
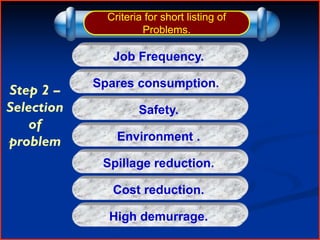
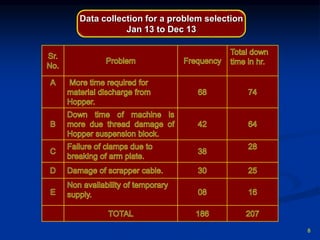
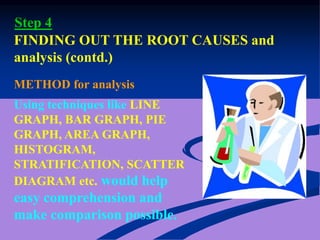
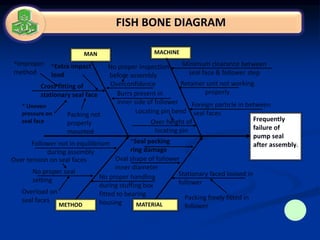
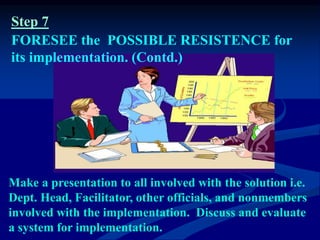
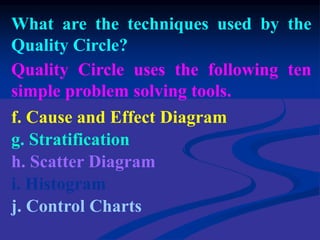
SlideShare a Scribd company logo
Name – Mayur Patil
Post – Technician Grade 1
Plant – Urea Mechanical
Qualification – Diploma Mechanical Engg
Topic –Introduction of Quality Circle 12 Steps
How does a Quality Circle solve a problem
by using A, B, C classification?
Step 1 – Identification of problem
They
Generate a list of problems using
‘BRAINSTORMING’
‘A’ Category Problem
Minimum
involvement of other
departments in
solving them.
‘B’ Category Problem
Involvement of other
departments is a
necessity.
‘C’Category Problem
Management sanction
may be needed in
implementing
the solution.
Identification of problems
Categorization of problems
Job Frequency.
Spares consumption.
Safety.
Environment .
Spillage reduction.
Cost reduction.
High demurrage.
Criteria for short listing of
Problems.
Step 2 –
Selection
of
problem
Non availability of temporary electric supply.
High maintenance of clamp assembly.
More time required for material discharge from Hopper.
Failure of clamps due to breaking of arm plate.
Frequent failure of hopper suspension.
Short listed problems
8
Data collection for a problem selection
Jan 13 to Dec 13
Use a mile stone chart to plan the time
required for the activities before
starting.
MILESTONE CHART
Quality Circle Activity Planning
10. Follow-
up/Review
9. Regular Implementation
8. Trial implementation
and checking
performance
7. Foreseeing possible
resistance
6. Developing solution
5. Data analysis
4. Finding out the root
cause
3. Identifying the causes
2. Analyzing the problem
1. Defining the problem
No. Activity Week 1 2 3 4 5 6 7 8 9 10 11 12 13 14 15 16 17 18 19 20 21 22 23 24 Target
Actual
Meeting Day Time No. of projects completed
Project No. Date of beginning Date of completion
Project Reason for selection
Quality Circle Name Department Manager Facilitator Members’ Name
PROJECT STUDY PLANNING IS AN EFFECTIVE METHOD BY WHICH QUALITY CIRCLE MEMBERS ATTAIN THE
SKILL TO PLAN THEIR ACTIVITIES AND EFFECTIVE TIME MANAGMENT
Use of flow diagram
helps in having clarity
of the problem by all
members. There may
be some members
who are not aware of
the entire process.
Once the problem is selected Quality Circle is advised to
follow the steps shown here.
DEFINE THE PROBLEM with the help of a flow
diagram.
Step 3 – Define the Problem
Analysis is very essential. There may be
certain dimensions of the problem
which are not understood by all. A
discussion will help in pooling up ideas.
ANALYSE THE PROBLEM
METHOD
‘DATA COLLECTION’ on the problem on all
possible aspects.
STEP 4
IDENTIFICATION OF CAUSES
METHOD
BRAINSTORMING first and making a CAUSE
and EFFECT DIAGRAM, logically linking the
causes to the main contributory factors.
Identification of causes is not only what we think
as cause for that situation but also all possible
causes. What is expected is a total analysis and
presentation in the form of Cause and Effect
diagram. It needs to be studied and discussed in
detail.
STEP 3
FINDING OUT THE ROOT CAUSES and
analysis
METHOD to find out root causes
Identifying the main causes in ‘CAUSE and
EFFECT DIAGRAM’ by ‘DATA
COLLECTION’ and discussion.
Root cause has to be established with the help of data. In
case, for any reason, it is not possible to collect data it
may be established based on experience. But experience
has also to be quantified.
STEP 4
METHOD for analysis
Using techniques like LINE
GRAPH, BAR GRAPH, PIE
GRAPH, AREA GRAPH,
HISTOGRAM,
STRATIFICATION, SCATTER
DIAGRAM etc. would help
easy comprehension and
make comparison possible.
FINDING OUT THE ROOT CAUSES and
analysis (contd.)
Step 4
GOAL
“No single stationary seal face fail after assembly.”
4
0
- Where is problem?
In pump mechanical seal assembly.
3 - ANALYSIS OF PROBLEM (4W - 1H)
- What was the loss due to problem?
More time required to complete breakdown of plant pump &
increase the shut down chances.
4W-1H ANALYSIS
- When we faced problem?
When spare pump fitting to casing at the place of faulty pump.
4W-1H ANALYSIS
- Why problem occurs?
When we dismantle seal assembly stationary seal face found break.
SLEEVE
ROTATING SEAL FACE
COMPRESSION UNIT
FOLLOWER
Stationary seal face found crack
SEAL LEAKAGE
HOW PROBLEM COMES?
*Extra impact
load
No proper inspection
before assembly
Follower not in equilibrium
during assembly
Minimum clearance between
seal face & follower step
Oval shape of follower
inner diameter
Cross fitting of
stationary seal face
* Uneven
pressure on
seal face
*Improper
method
Stationary faced loosed in
follower
Foreign particle in between
seal faces
Frequently
failure of
pump seal
after assembly.
Locating pin bend
Overload on
seal faces
Over height of
locating pin
Overconfidence
Packing freely fitted in
follower
Over tension on seal faces
Packing not
properly
mounted
Burrs present in
inner side of follower
*Seal packing
ring damage
MACHINE
No proper seal
setting No proper handling
during stuffing box
fitted to bearing
housing
MAN
Retainer unit not working
properly
FISH BONE DIAGRAM
MATERIAL
METHOD
WHY WHY ANALYSIS
1) Uneven pressure on seal face during assembly.
Why?
It is fitted in follower by using hand.
Why?
by regular hand fitting practice
Why?
No arrangements to fit stationary seal face in follower.
2) Improper method.
Why?
No Standardization to fit stationary seal face
Why?
By regular hand fitting practice.
Why?
No arrangement to fit seal face in follower
WHY WHY ANALYSIS
IDENTIFY SOLUTIONS
METHOD
‘BRAINSTORMING’
Select the appropriate solution
Step 6
STEP 5
METHOD
‘BRAINSTORMING’
Identifying the probable
constraints and finding
ways to overcome them.
Step 7
FORESEE the POSSIBLE RESISTENCE for
its implementation.
Make a presentation to all involved with the solution i.e.
Dept. Head, Facilitator, other officials, and nonmembers
involved with the implementation. Discuss and evaluate
a system for implementation.
Step 7
FORESEE the POSSIBLE RESISTENCE for
its implementation. (Contd.)
Implement the solution on a trial basis and
check performance.
METHOD
Data collection after implementation compared
with the data collected before solving the
problem. Collect fresh data using control chart
and watch process trends. Analyse the result,
discuss and incorporate the changes needed.
Step 8
REGULAR IMPLEMENTATION
Once validity is checked and
improvement observed with data, regular
implementation can be effected.
Incorporate the suggestions in the working
system or work instruction sheets (Process
cards.)
Step 9
FOLLOW UP / REVIEW
METHOD
Implement evaluation procedure, use
Control Chart, have six monthly
report for evaluation.
Make modifications if necessary.
Step 10
What are the techniques used by the
Quality Circle?
Quality Circle uses the following ten
simple problem solving tools.
a. Brainstorming
b. Flow Diagram
c. Data Collection
d. Graphs
e. Pareto Analysis
What are the techniques used by the
Quality Circle?
Quality Circle uses the following ten
simple problem solving tools.
f. Cause and Effect Diagram
g. Stratification
h. Scatter Diagram
i. Histogram
j. Control Charts
Seven Basic Quality Tools
HISTOGRAM
PARETO
CHART
CAUSE &
EFFECT
FLOWCHART
CHECK
SHEET
CONTROL
CHART
SCATTER
DIAGRAM
What is Brainstorming?
Brainstorming is a group
technique for generating
new and useful ideas.
It uses a few simple rules
for discussion on a
subject matter that
contributes to originality
and innovation.
Shop floor workers
What is Data collection?
Data collection is nothing but the
collection of the required
‘information’ in figures for the
statistical analysis of a problem.
This provides a sound basis for
decision making and corrective
action.
These numbers are called data. They are
expression of facts of any activity or feature in
numerical terms.
TYPE NUMBER CUM % OF CUM
OF OF TOTAL %
DEFECT FANS
F. Regulator 40 40 27% 27%
G. Bend in Screws 25 65 17% 44%
A. Motor winding 20 85 13% 57%
B. Bend in wings 15 100 10% 67%
C. Cracks in Central rod 14 114 9% 76%
E. Scratches 12 126 8% 84%
D. Capacitor 10 136 7% 91%
H. Others 14 150 9% 100%
Total 150 100%
What is Graph?
Graph is a pictorial
representation of data which,
when presented, is easily
understandable. It helps to
represent large amount of
information comprehensively but
in a compact manner.
As Graphs are pictorial
representation of data,
they make it easy for
anybody to understand the
information.
i.e. from top management
to grass root level
employees.
in shop floor
0
5
10
15
20
25 Jan
Feb
Mar
Apr
May
Jun
Jul
Aug
Sep
Oct
Nov
Dec
Months
Foundry
Rejections
(%)
In offices
Sales Up
What is
Stratification?
Stratification is the
process of separation
of data into categories.
Stratification is the process to classify
large amount of data to find out whether
we can get indication of problem point.
It is too
complicated !!
Then
Stratify it!!
Mumbai, we have
a problem !!
What is it ?
In a manufacturing organisation
absenteeism was very high.
They had 60% of the employees staying
in the colony and balance in the city
which was 20 Kilometres away.
Staff
Quaters
Septa Inds. Ltd.
Absenteeism
was first
segregated
month wise.
It revealed that it was more in
January, May, June and December.
0
10
20
30
40
50
60
Jan
Feb
Mar
Apr
May
Jun
Jul
Aug
Sep
Oct
Nov
Dec
Number
of
Absentees
It was further
stratified shift
wise.
It was found that in December and
January it was more in early morning
shift starting at 6 AM and in night shift
starting at 10 PM
0
5
10
15
20
25
30
Morning Shift
Afternoon Shift
Night Shift
Number
of
Absentees
JANUARY
0
5
10
15
20
25
30
35
Morning
Shift
Afternoon
Shift
Night Shift
Number
of
Absentees
DECEMBER
In May and June it was during
shift starting at 2 PM.
0
5
10
15
20
25
30
35
40
45
Morning
Shift
Afternoon
Shift
Night Shift
Number
of
Absentees
MAY
0
5
10
15
20
25
30
35
40
Morning
Shift
Afternoon
Shift
Night Shift
Number
of
Absentees
JUNE
Then it was checked as to
how many of the colony people were
absent and how many from the city.
Further Stratification revealed that
people residing in the city were
absent in most of the cases.
0
10
20
30
40
50
60
70
80
90
100
Colony
residents
City residents
In the months of December &
January
Number
of
Absentees
0
10
20
30
40
50
60
70
80
90
100
Colony
residents
City residents
In the months of May & June
Number
of
Absentees
This helped to workout an
action plan.
I think we should
put more of colony
people in the
problem shifts.
0
100
200
300
400
500
600
700
800
100
80
60
40
20
0
%
No
of
complaints
Types of defects
What is a Pareto
diagram?
Pareto diagram is a
technique of arranging
data according to
priority or importance
and using into a
problem solving
framework.
This helps to find out
the ‘VITAL FEW’ from
the ‘USEFUL MANY’ for
problem selection.
What is a cause and effect
diagram?
Any defect in a component, a
product or service could be
due to one or more causes. To
find out the relationship
between the causes and
effect, a diagram is drawn
systematically by mapping out
all the probable causes
influencing the effect. This is
called a cause and effect
diagram.
ANGLE BEFORE LAPPING
ANGLE
AFTER
LAPPING
10 20 30 40 50 60 70 80 90
10
20
30
40
50
60
70
80
90
What is Scatter
Diagram?
Scatter Diagram is a
graphical representation of
relationship between two
variables. It can be between
a Cause and Effect and
between two causes.
It also reveals the nature of
relationship between two
variables and their
approximate strength.
As said a Scatter
diagram
is a graphical
representation
of relationship
between two variables
It can be a Cause and
Effect relationship
OBESE
Overeating
CAUSE EFFECT
Lack of exercise
What is Histogram?
Histogram is a
graphical
representation of a
frequency
distribution which
is a summary
variation in a
product or process.
30
0
5
10
15
20
25
WEIGHT (gms)
FREQUENCY
Control Charts
Control charts present the results of a process over time.
They are used to determine if the process is under control.
They are used to monitor any type of variable output.
Can be used to monitor
• Cost and schedule variances;
• Volume and frequency of changes;
• Errors in the project documentation
Checklist
It is a list with
previously defined
options that are used
as a guide to control
risks.
It allows a thorough
evaluation in a short
period of time.
What are the overall benefits a
member gets?
Members get many benefits. They
improve their knowledge. They learn to
work together. They learn to interact
better.
They learn to present before the
management their case study, which
helps to boost their morale and
confidence. They learn to work
systematically.
They learn to plan their activities. Above all they
learn simple techniques which help in solving their
problems effectively and ultimately helps in
problem prevention in their work area.
What is a Management Presentation?
A management presentation is where the leader and
members describe to their management what project
they have been working on and what recommendations
they wish to make concerning it. Participants use charts
which are prepared by them. This event represents a
most exciting form of participation, communication and
recognition for all.
ii. Organising Drama Skits on Quality
Circle themes and awarding trophies for
the best ones.
iv. Honouring best QCs on Republic Day would be
a good way of recognising them. On such
occasions, family members, friends and general
public will come to know of their good work. This
will give them immense pride in their
achievements.
vi. Declaring best Circle of the year, half year, for the
quarter and so on and putting up photo of the
group at vantage points - Reception Hall, Canteen
etc. This will go a long way in boosting the self-
esteem needs of people.
viii. Conducting regular Quiz Programmes on QC for
Quality Circle teams coming from different
divisions and awarding token gifts for winners. The
enthusiasm generated in such programmes should
be seen to know the impact of these on the
motivation of QCs.
What is being done in India
by QCFI?
Quality Circle Forum of India was
established as a non-profit body in the
year 1982 with Hyderabad as its
Headquarters.
QCFI has
* Patron Members
* Institutional Members
* Quality Circle Members
* Individual Members
North East West South
Delhi Calcutta Mumbai Chennai
Kanpur Guwahati Pune Madurai
Chandigarh Durgapur Vadodara Neyveli
Jhalawar Rourkela Nagpur Coimbatore
Faridabad Bhilai Jabalpur Cochin
Gwalior Bokaro Bangalore
Koraput Hyderabad
QCFI has 25 Chapters all over India.

More Related Content

What's hot

7 NEW QC Tools | 7 NEW QC Tools Training
7 NEW QC Tools | 7 NEW QC Tools Training7 NEW QC Tools | 7 NEW QC Tools Training
7 NEW QC Tools | 7 NEW QC Tools Training
himalya sharma
 
Continous process improvement
Continous process improvementContinous process improvement
Continous process improvement
Sarfraz Ashraf
 
Process improvement techniques and its applicability in pharma mfg an overview
Process improvement techniques and its applicability in pharma mfg   an overviewProcess improvement techniques and its applicability in pharma mfg   an overview
Process improvement techniques and its applicability in pharma mfg an overview
VikalpNagori1
 
PDCA quality improvement
PDCA quality improvementPDCA quality improvement
PDCA quality improvement
Mohamed Helmy
 
7 new qc tools
7 new qc tools7 new qc tools
7 new qc tools
Paul Robere
 
Contionus improvement case analysis
Contionus improvement case analysisContionus improvement case analysis
Contionus improvement case analysis1shruthika
 
How pdca cycle used in context of TQM
How pdca cycle used in context of TQMHow pdca cycle used in context of TQM
How pdca cycle used in context of TQMAkhil Padiga
 
The Deming Cycle; Plan Do Check Act
The Deming Cycle; Plan Do Check ActThe Deming Cycle; Plan Do Check Act
The Deming Cycle; Plan Do Check Act
Prama Academy
 
Deming’s PDCA and Constant Learning
Deming’s PDCA and Constant LearningDeming’s PDCA and Constant Learning
Deming’s PDCA and Constant Learning
Jeanie Arnoco
 
PDCA Cycle
PDCA CyclePDCA Cycle
PDCA Cycle
Vardhan Shah
 
Continuous improvement by Julian Kalac
Continuous improvement  by Julian KalacContinuous improvement  by Julian Kalac
Continuous improvement by Julian Kalac
Julian Kalac P.Eng
 
8D Training, Eight Disciplines Training : Tonex Training
8D Training, Eight Disciplines Training : Tonex Training8D Training, Eight Disciplines Training : Tonex Training
8D Training, Eight Disciplines Training : Tonex Training
Bryan Len
 
Ppt total quality management
Ppt total quality managementPpt total quality management
Ppt total quality management
Anitha Velusamy
 
How to solve problems (or at least try) with 8D
How to solve problems (or at least try) with 8DHow to solve problems (or at least try) with 8D
How to solve problems (or at least try) with 8D
Stefan Kovacs
 
Six Sigma in Healthcare
Six Sigma in HealthcareSix Sigma in Healthcare
Six Sigma in Healthcare
ljmcneill33
 

What's hot (20)

PDSA Cycle
PDSA CyclePDSA Cycle
PDSA Cycle
 
7 NEW QC Tools | 7 NEW QC Tools Training
7 NEW QC Tools | 7 NEW QC Tools Training7 NEW QC Tools | 7 NEW QC Tools Training
7 NEW QC Tools | 7 NEW QC Tools Training
 
Continous process improvement
Continous process improvementContinous process improvement
Continous process improvement
 
Process improvement techniques and its applicability in pharma mfg an overview
Process improvement techniques and its applicability in pharma mfg   an overviewProcess improvement techniques and its applicability in pharma mfg   an overview
Process improvement techniques and its applicability in pharma mfg an overview
 
PDCA
PDCAPDCA
PDCA
 
PDCA quality improvement
PDCA quality improvementPDCA quality improvement
PDCA quality improvement
 
7 new qc tools
7 new qc tools7 new qc tools
7 new qc tools
 
Contionus improvement case analysis
Contionus improvement case analysisContionus improvement case analysis
Contionus improvement case analysis
 
How pdca cycle used in context of TQM
How pdca cycle used in context of TQMHow pdca cycle used in context of TQM
How pdca cycle used in context of TQM
 
The Deming Cycle; Plan Do Check Act
The Deming Cycle; Plan Do Check ActThe Deming Cycle; Plan Do Check Act
The Deming Cycle; Plan Do Check Act
 
Deming’s PDCA and Constant Learning
Deming’s PDCA and Constant LearningDeming’s PDCA and Constant Learning
Deming’s PDCA and Constant Learning
 
Tools pdsa
Tools   pdsaTools   pdsa
Tools pdsa
 
Plan do-study-act
Plan do-study-actPlan do-study-act
Plan do-study-act
 
PDCA Cycle
PDCA CyclePDCA Cycle
PDCA Cycle
 
Continuous improvement by Julian Kalac
Continuous improvement  by Julian KalacContinuous improvement  by Julian Kalac
Continuous improvement by Julian Kalac
 
8D Training, Eight Disciplines Training : Tonex Training
8D Training, Eight Disciplines Training : Tonex Training8D Training, Eight Disciplines Training : Tonex Training
8D Training, Eight Disciplines Training : Tonex Training
 
Ppt total quality management
Ppt total quality managementPpt total quality management
Ppt total quality management
 
How to solve problems (or at least try) with 8D
How to solve problems (or at least try) with 8DHow to solve problems (or at least try) with 8D
How to solve problems (or at least try) with 8D
 
8 D
8 D8 D
8 D
 
Six Sigma in Healthcare
Six Sigma in HealthcareSix Sigma in Healthcare
Six Sigma in Healthcare
 

Similar to Qc

problem-solving-training.pdf
problem-solving-training.pdfproblem-solving-training.pdf
problem-solving-training.pdf
srinandan10
 
TQM Tools and Techniques. ( PDFDrive ).pptx
TQM Tools and Techniques. ( PDFDrive ).pptxTQM Tools and Techniques. ( PDFDrive ).pptx
TQM Tools and Techniques. ( PDFDrive ).pptx
OSWALDOAUGUSTOGONZAL1
 
Qa improvement
Qa improvementQa improvement
Qa improvement
Jitesh Gaurav
 
8d_en.pdf
8d_en.pdf8d_en.pdf
8d_en.pdf
DeepakMore54
 
Qc story
Qc storyQc story
Qc story
ssuser283e821
 
Rkfl Problem Solving
Rkfl Problem SolvingRkfl Problem Solving
Rkfl Problem Solving
Mahendra K SHUKLA
 
Mangt tool with statistical process control ch 18 asif jamal
Mangt tool with statistical process control  ch 18 asif jamalMangt tool with statistical process control  ch 18 asif jamal
Mangt tool with statistical process control ch 18 asif jamal
Asif Jamal
 
QM-021-PDCA
QM-021-PDCAQM-021-PDCA
QM-021-PDCAhandbook
 
8D Problem Solving
8D Problem Solving8D Problem Solving
8D Problem Solving
Ajay Garg
 
ОКСАНА ГОРОЩУК «Improving Quality Through Root Cause Analysis»
ОКСАНА ГОРОЩУК «Improving Quality Through Root Cause Analysis»ОКСАНА ГОРОЩУК «Improving Quality Through Root Cause Analysis»
ОКСАНА ГОРОЩУК «Improving Quality Through Root Cause Analysis»
QADay
 
Twelve steps of qc
Twelve steps of qcTwelve steps of qc
Twelve steps of qc
Prabhat Pandey
 
SQT.ppt
SQT.pptSQT.ppt
Week 11 data collation & analysis
Week 11 data collation & analysisWeek 11 data collation & analysis
Week 11 data collation & analysisKevin Goh At Np
 
Total Quality Management Principles
Total Quality Management PrinciplesTotal Quality Management Principles
Total Quality Management PrinciplesAmmar Mubarak
 
Training on qc
Training on qcTraining on qc
Training on qc
Aparesh Mohapatra
 
Rootcauseanalysispresentation 090728111941 Phpapp01
Rootcauseanalysispresentation 090728111941 Phpapp01Rootcauseanalysispresentation 090728111941 Phpapp01
Rootcauseanalysispresentation 090728111941 Phpapp01Rahul Kushwaha
 
2 5 root cause
2 5 root cause2 5 root cause
2 5 root cause
mahadevpawase
 

Similar to Qc (20)

problem-solving-training.pdf
problem-solving-training.pdfproblem-solving-training.pdf
problem-solving-training.pdf
 
TQM Tools and Techniques. ( PDFDrive ).pptx
TQM Tools and Techniques. ( PDFDrive ).pptxTQM Tools and Techniques. ( PDFDrive ).pptx
TQM Tools and Techniques. ( PDFDrive ).pptx
 
Qa improvement
Qa improvementQa improvement
Qa improvement
 
8d_en.pdf
8d_en.pdf8d_en.pdf
8d_en.pdf
 
Training Module
Training ModuleTraining Module
Training Module
 
Qc story
Qc storyQc story
Qc story
 
Tata Project
Tata ProjectTata Project
Tata Project
 
Rkfl Problem Solving
Rkfl Problem SolvingRkfl Problem Solving
Rkfl Problem Solving
 
Mangt tool with statistical process control ch 18 asif jamal
Mangt tool with statistical process control  ch 18 asif jamalMangt tool with statistical process control  ch 18 asif jamal
Mangt tool with statistical process control ch 18 asif jamal
 
QM-021-PDCA
QM-021-PDCAQM-021-PDCA
QM-021-PDCA
 
8D Problem Solving
8D Problem Solving8D Problem Solving
8D Problem Solving
 
ОКСАНА ГОРОЩУК «Improving Quality Through Root Cause Analysis»
ОКСАНА ГОРОЩУК «Improving Quality Through Root Cause Analysis»ОКСАНА ГОРОЩУК «Improving Quality Through Root Cause Analysis»
ОКСАНА ГОРОЩУК «Improving Quality Through Root Cause Analysis»
 
Twelve steps of qc
Twelve steps of qcTwelve steps of qc
Twelve steps of qc
 
SQT.ppt
SQT.pptSQT.ppt
SQT.ppt
 
Week 11 data collation & analysis
Week 11 data collation & analysisWeek 11 data collation & analysis
Week 11 data collation & analysis
 
Total Quality Management Principles
Total Quality Management PrinciplesTotal Quality Management Principles
Total Quality Management Principles
 
Training on qc
Training on qcTraining on qc
Training on qc
 
Root Cause Analysis Presentation
Root Cause Analysis PresentationRoot Cause Analysis Presentation
Root Cause Analysis Presentation
 
Rootcauseanalysispresentation 090728111941 Phpapp01
Rootcauseanalysispresentation 090728111941 Phpapp01Rootcauseanalysispresentation 090728111941 Phpapp01
Rootcauseanalysispresentation 090728111941 Phpapp01
 
2 5 root cause
2 5 root cause2 5 root cause
2 5 root cause
 

Recently uploaded

一比一原版(Bristol毕业证书)布里斯托大学毕业证成绩单如何办理
一比一原版(Bristol毕业证书)布里斯托大学毕业证成绩单如何办理一比一原版(Bristol毕业证书)布里斯托大学毕业证成绩单如何办理
一比一原版(Bristol毕业证书)布里斯托大学毕业证成绩单如何办理
smpc3nvg
 
一比一原版(Bolton毕业证书)博尔顿大学毕业证成绩单如何办理
一比一原版(Bolton毕业证书)博尔顿大学毕业证成绩单如何办理一比一原版(Bolton毕业证书)博尔顿大学毕业证成绩单如何办理
一比一原版(Bolton毕业证书)博尔顿大学毕业证成绩单如何办理
h7j5io0
 
EASY TUTORIAL OF HOW TO USE CAPCUT BY: FEBLESS HERNANE
EASY TUTORIAL OF HOW TO USE CAPCUT BY: FEBLESS HERNANEEASY TUTORIAL OF HOW TO USE CAPCUT BY: FEBLESS HERNANE
EASY TUTORIAL OF HOW TO USE CAPCUT BY: FEBLESS HERNANE
Febless Hernane
 
一比一原版(BU毕业证)波士顿大学毕业证如何办理
一比一原版(BU毕业证)波士顿大学毕业证如何办理一比一原版(BU毕业证)波士顿大学毕业证如何办理
一比一原版(BU毕业证)波士顿大学毕业证如何办理
peuce
 
一比一原版(RHUL毕业证书)伦敦大学皇家霍洛威学院毕业证如何办理
一比一原版(RHUL毕业证书)伦敦大学皇家霍洛威学院毕业证如何办理一比一原版(RHUL毕业证书)伦敦大学皇家霍洛威学院毕业证如何办理
一比一原版(RHUL毕业证书)伦敦大学皇家霍洛威学院毕业证如何办理
9a93xvy
 
SECURING BUILDING PERMIT CITY OF CALOOCAN.pdf
SECURING BUILDING PERMIT CITY OF CALOOCAN.pdfSECURING BUILDING PERMIT CITY OF CALOOCAN.pdf
SECURING BUILDING PERMIT CITY OF CALOOCAN.pdf
eloprejohn333
 
Timeless Principles of Good Design
Timeless Principles of Good DesignTimeless Principles of Good Design
Timeless Principles of Good Design
Carolina de Bartolo
 
Transforming Brand Perception and Boosting Profitability
Transforming Brand Perception and Boosting ProfitabilityTransforming Brand Perception and Boosting Profitability
Transforming Brand Perception and Boosting Profitability
aaryangarg12
 
Technoblade The Legacy of a Minecraft Legend.
Technoblade The Legacy of a Minecraft Legend.Technoblade The Legacy of a Minecraft Legend.
Technoblade The Legacy of a Minecraft Legend.
Techno Merch
 
Design-Thinking-eBook for Public Service Delivery
Design-Thinking-eBook for Public Service DeliveryDesign-Thinking-eBook for Public Service Delivery
Design-Thinking-eBook for Public Service Delivery
farhanaslam79
 
Book Formatting: Quality Control Checks for Designers
Book Formatting: Quality Control Checks for DesignersBook Formatting: Quality Control Checks for Designers
Book Formatting: Quality Control Checks for Designers
Confidence Ago
 
一比一原版(MMU毕业证书)曼彻斯特城市大学毕业证成绩单如何办理
一比一原版(MMU毕业证书)曼彻斯特城市大学毕业证成绩单如何办理一比一原版(MMU毕业证书)曼彻斯特城市大学毕业证成绩单如何办理
一比一原版(MMU毕业证书)曼彻斯特城市大学毕业证成绩单如何办理
7sd8fier
 
UNIT IV-VISUAL STYLE AND MOBILE INTERFACES.pptx
UNIT IV-VISUAL STYLE AND MOBILE INTERFACES.pptxUNIT IV-VISUAL STYLE AND MOBILE INTERFACES.pptx
UNIT IV-VISUAL STYLE AND MOBILE INTERFACES.pptx
GOWSIKRAJA PALANISAMY
 
一比一原版(UAL毕业证书)伦敦艺术大学毕业证成绩单如何办理
一比一原版(UAL毕业证书)伦敦艺术大学毕业证成绩单如何办理一比一原版(UAL毕业证书)伦敦艺术大学毕业证成绩单如何办理
一比一原版(UAL毕业证书)伦敦艺术大学毕业证成绩单如何办理
708pb191
 
一比一原版(BU毕业证书)伯恩茅斯大学毕业证成绩单如何办理
一比一原版(BU毕业证书)伯恩茅斯大学毕业证成绩单如何办理一比一原版(BU毕业证书)伯恩茅斯大学毕业证成绩单如何办理
一比一原版(BU毕业证书)伯恩茅斯大学毕业证成绩单如何办理
h7j5io0
 
Коричневый и Кремовый Деликатный Органический Копирайтер Фрилансер Марке...
Коричневый и Кремовый Деликатный Органический Копирайтер Фрилансер Марке...Коричневый и Кремовый Деликатный Органический Копирайтер Фрилансер Марке...
Коричневый и Кремовый Деликатный Органический Копирайтер Фрилансер Марке...
ameli25062005
 
Maximize Your Content with Beautiful Assets : Content & Asset for Landing Page
Maximize Your Content with Beautiful Assets : Content & Asset for Landing Page Maximize Your Content with Beautiful Assets : Content & Asset for Landing Page
Maximize Your Content with Beautiful Assets : Content & Asset for Landing Page
pmgdscunsri
 
Moldes de letra 3D Alfabeto completo esp
Moldes de letra 3D Alfabeto completo espMoldes de letra 3D Alfabeto completo esp
Moldes de letra 3D Alfabeto completo esp
Hess9
 
Design Thinking Design thinking Design thinking
Design Thinking Design thinking Design thinkingDesign Thinking Design thinking Design thinking
Design Thinking Design thinking Design thinking
cy0krjxt
 
Borys Sutkowski portfolio interior design
Borys Sutkowski portfolio interior designBorys Sutkowski portfolio interior design
Borys Sutkowski portfolio interior design
boryssutkowski
 

Recently uploaded (20)

一比一原版(Bristol毕业证书)布里斯托大学毕业证成绩单如何办理
一比一原版(Bristol毕业证书)布里斯托大学毕业证成绩单如何办理一比一原版(Bristol毕业证书)布里斯托大学毕业证成绩单如何办理
一比一原版(Bristol毕业证书)布里斯托大学毕业证成绩单如何办理
 
一比一原版(Bolton毕业证书)博尔顿大学毕业证成绩单如何办理
一比一原版(Bolton毕业证书)博尔顿大学毕业证成绩单如何办理一比一原版(Bolton毕业证书)博尔顿大学毕业证成绩单如何办理
一比一原版(Bolton毕业证书)博尔顿大学毕业证成绩单如何办理
 
EASY TUTORIAL OF HOW TO USE CAPCUT BY: FEBLESS HERNANE
EASY TUTORIAL OF HOW TO USE CAPCUT BY: FEBLESS HERNANEEASY TUTORIAL OF HOW TO USE CAPCUT BY: FEBLESS HERNANE
EASY TUTORIAL OF HOW TO USE CAPCUT BY: FEBLESS HERNANE
 
一比一原版(BU毕业证)波士顿大学毕业证如何办理
一比一原版(BU毕业证)波士顿大学毕业证如何办理一比一原版(BU毕业证)波士顿大学毕业证如何办理
一比一原版(BU毕业证)波士顿大学毕业证如何办理
 
一比一原版(RHUL毕业证书)伦敦大学皇家霍洛威学院毕业证如何办理
一比一原版(RHUL毕业证书)伦敦大学皇家霍洛威学院毕业证如何办理一比一原版(RHUL毕业证书)伦敦大学皇家霍洛威学院毕业证如何办理
一比一原版(RHUL毕业证书)伦敦大学皇家霍洛威学院毕业证如何办理
 
SECURING BUILDING PERMIT CITY OF CALOOCAN.pdf
SECURING BUILDING PERMIT CITY OF CALOOCAN.pdfSECURING BUILDING PERMIT CITY OF CALOOCAN.pdf
SECURING BUILDING PERMIT CITY OF CALOOCAN.pdf
 
Timeless Principles of Good Design
Timeless Principles of Good DesignTimeless Principles of Good Design
Timeless Principles of Good Design
 
Transforming Brand Perception and Boosting Profitability
Transforming Brand Perception and Boosting ProfitabilityTransforming Brand Perception and Boosting Profitability
Transforming Brand Perception and Boosting Profitability
 
Technoblade The Legacy of a Minecraft Legend.
Technoblade The Legacy of a Minecraft Legend.Technoblade The Legacy of a Minecraft Legend.
Technoblade The Legacy of a Minecraft Legend.
 
Design-Thinking-eBook for Public Service Delivery
Design-Thinking-eBook for Public Service DeliveryDesign-Thinking-eBook for Public Service Delivery
Design-Thinking-eBook for Public Service Delivery
 
Book Formatting: Quality Control Checks for Designers
Book Formatting: Quality Control Checks for DesignersBook Formatting: Quality Control Checks for Designers
Book Formatting: Quality Control Checks for Designers
 
一比一原版(MMU毕业证书)曼彻斯特城市大学毕业证成绩单如何办理
一比一原版(MMU毕业证书)曼彻斯特城市大学毕业证成绩单如何办理一比一原版(MMU毕业证书)曼彻斯特城市大学毕业证成绩单如何办理
一比一原版(MMU毕业证书)曼彻斯特城市大学毕业证成绩单如何办理
 
UNIT IV-VISUAL STYLE AND MOBILE INTERFACES.pptx
UNIT IV-VISUAL STYLE AND MOBILE INTERFACES.pptxUNIT IV-VISUAL STYLE AND MOBILE INTERFACES.pptx
UNIT IV-VISUAL STYLE AND MOBILE INTERFACES.pptx
 
一比一原版(UAL毕业证书)伦敦艺术大学毕业证成绩单如何办理
一比一原版(UAL毕业证书)伦敦艺术大学毕业证成绩单如何办理一比一原版(UAL毕业证书)伦敦艺术大学毕业证成绩单如何办理
一比一原版(UAL毕业证书)伦敦艺术大学毕业证成绩单如何办理
 
一比一原版(BU毕业证书)伯恩茅斯大学毕业证成绩单如何办理
一比一原版(BU毕业证书)伯恩茅斯大学毕业证成绩单如何办理一比一原版(BU毕业证书)伯恩茅斯大学毕业证成绩单如何办理
一比一原版(BU毕业证书)伯恩茅斯大学毕业证成绩单如何办理
 
Коричневый и Кремовый Деликатный Органический Копирайтер Фрилансер Марке...
Коричневый и Кремовый Деликатный Органический Копирайтер Фрилансер Марке...Коричневый и Кремовый Деликатный Органический Копирайтер Фрилансер Марке...
Коричневый и Кремовый Деликатный Органический Копирайтер Фрилансер Марке...
 
Maximize Your Content with Beautiful Assets : Content & Asset for Landing Page
Maximize Your Content with Beautiful Assets : Content & Asset for Landing Page Maximize Your Content with Beautiful Assets : Content & Asset for Landing Page
Maximize Your Content with Beautiful Assets : Content & Asset for Landing Page
 
Moldes de letra 3D Alfabeto completo esp
Moldes de letra 3D Alfabeto completo espMoldes de letra 3D Alfabeto completo esp
Moldes de letra 3D Alfabeto completo esp
 
Design Thinking Design thinking Design thinking
Design Thinking Design thinking Design thinkingDesign Thinking Design thinking Design thinking
Design Thinking Design thinking Design thinking
 
Borys Sutkowski portfolio interior design
Borys Sutkowski portfolio interior designBorys Sutkowski portfolio interior design
Borys Sutkowski portfolio interior design
 

Qc

  • 1. Name – Mayur Patil Post – Technician Grade 1 Plant – Urea Mechanical Qualification – Diploma Mechanical Engg Topic –Introduction of Quality Circle 12 Steps
  • 2. How does a Quality Circle solve a problem by using A, B, C classification? Step 1 – Identification of problem
  • 3. They Generate a list of problems using ‘BRAINSTORMING’
  • 4. ‘A’ Category Problem Minimum involvement of other departments in solving them. ‘B’ Category Problem Involvement of other departments is a necessity. ‘C’Category Problem Management sanction may be needed in implementing the solution.
  • 6. Job Frequency. Spares consumption. Safety. Environment . Spillage reduction. Cost reduction. High demurrage. Criteria for short listing of Problems. Step 2 – Selection of problem
  • 7. Non availability of temporary electric supply. High maintenance of clamp assembly. More time required for material discharge from Hopper. Failure of clamps due to breaking of arm plate. Frequent failure of hopper suspension. Short listed problems
  • 8. 8 Data collection for a problem selection Jan 13 to Dec 13
  • 9. Use a mile stone chart to plan the time required for the activities before starting.
  • 10. MILESTONE CHART Quality Circle Activity Planning 10. Follow- up/Review 9. Regular Implementation 8. Trial implementation and checking performance 7. Foreseeing possible resistance 6. Developing solution 5. Data analysis 4. Finding out the root cause 3. Identifying the causes 2. Analyzing the problem 1. Defining the problem No. Activity Week 1 2 3 4 5 6 7 8 9 10 11 12 13 14 15 16 17 18 19 20 21 22 23 24 Target Actual Meeting Day Time No. of projects completed Project No. Date of beginning Date of completion Project Reason for selection Quality Circle Name Department Manager Facilitator Members’ Name PROJECT STUDY PLANNING IS AN EFFECTIVE METHOD BY WHICH QUALITY CIRCLE MEMBERS ATTAIN THE SKILL TO PLAN THEIR ACTIVITIES AND EFFECTIVE TIME MANAGMENT
  • 11. Use of flow diagram helps in having clarity of the problem by all members. There may be some members who are not aware of the entire process. Once the problem is selected Quality Circle is advised to follow the steps shown here. DEFINE THE PROBLEM with the help of a flow diagram. Step 3 – Define the Problem
  • 12. Analysis is very essential. There may be certain dimensions of the problem which are not understood by all. A discussion will help in pooling up ideas. ANALYSE THE PROBLEM METHOD ‘DATA COLLECTION’ on the problem on all possible aspects. STEP 4
  • 13. IDENTIFICATION OF CAUSES METHOD BRAINSTORMING first and making a CAUSE and EFFECT DIAGRAM, logically linking the causes to the main contributory factors. Identification of causes is not only what we think as cause for that situation but also all possible causes. What is expected is a total analysis and presentation in the form of Cause and Effect diagram. It needs to be studied and discussed in detail. STEP 3
  • 14. FINDING OUT THE ROOT CAUSES and analysis METHOD to find out root causes Identifying the main causes in ‘CAUSE and EFFECT DIAGRAM’ by ‘DATA COLLECTION’ and discussion. Root cause has to be established with the help of data. In case, for any reason, it is not possible to collect data it may be established based on experience. But experience has also to be quantified. STEP 4
  • 15. METHOD for analysis Using techniques like LINE GRAPH, BAR GRAPH, PIE GRAPH, AREA GRAPH, HISTOGRAM, STRATIFICATION, SCATTER DIAGRAM etc. would help easy comprehension and make comparison possible. FINDING OUT THE ROOT CAUSES and analysis (contd.) Step 4
  • 16. GOAL “No single stationary seal face fail after assembly.” 4 0
  • 17. - Where is problem? In pump mechanical seal assembly. 3 - ANALYSIS OF PROBLEM (4W - 1H)
  • 18. - What was the loss due to problem? More time required to complete breakdown of plant pump & increase the shut down chances. 4W-1H ANALYSIS
  • 19. - When we faced problem? When spare pump fitting to casing at the place of faulty pump. 4W-1H ANALYSIS
  • 20. - Why problem occurs? When we dismantle seal assembly stationary seal face found break. SLEEVE ROTATING SEAL FACE COMPRESSION UNIT FOLLOWER Stationary seal face found crack
  • 22. *Extra impact load No proper inspection before assembly Follower not in equilibrium during assembly Minimum clearance between seal face & follower step Oval shape of follower inner diameter Cross fitting of stationary seal face * Uneven pressure on seal face *Improper method Stationary faced loosed in follower Foreign particle in between seal faces Frequently failure of pump seal after assembly. Locating pin bend Overload on seal faces Over height of locating pin Overconfidence Packing freely fitted in follower Over tension on seal faces Packing not properly mounted Burrs present in inner side of follower *Seal packing ring damage MACHINE No proper seal setting No proper handling during stuffing box fitted to bearing housing MAN Retainer unit not working properly FISH BONE DIAGRAM MATERIAL METHOD
  • 23. WHY WHY ANALYSIS 1) Uneven pressure on seal face during assembly. Why? It is fitted in follower by using hand. Why? by regular hand fitting practice Why? No arrangements to fit stationary seal face in follower.
  • 24. 2) Improper method. Why? No Standardization to fit stationary seal face Why? By regular hand fitting practice. Why? No arrangement to fit seal face in follower WHY WHY ANALYSIS
  • 25. IDENTIFY SOLUTIONS METHOD ‘BRAINSTORMING’ Select the appropriate solution Step 6 STEP 5
  • 26. METHOD ‘BRAINSTORMING’ Identifying the probable constraints and finding ways to overcome them. Step 7 FORESEE the POSSIBLE RESISTENCE for its implementation.
  • 27. Make a presentation to all involved with the solution i.e. Dept. Head, Facilitator, other officials, and nonmembers involved with the implementation. Discuss and evaluate a system for implementation. Step 7 FORESEE the POSSIBLE RESISTENCE for its implementation. (Contd.)
  • 28. Implement the solution on a trial basis and check performance. METHOD Data collection after implementation compared with the data collected before solving the problem. Collect fresh data using control chart and watch process trends. Analyse the result, discuss and incorporate the changes needed. Step 8
  • 29. REGULAR IMPLEMENTATION Once validity is checked and improvement observed with data, regular implementation can be effected. Incorporate the suggestions in the working system or work instruction sheets (Process cards.) Step 9
  • 30. FOLLOW UP / REVIEW METHOD Implement evaluation procedure, use Control Chart, have six monthly report for evaluation. Make modifications if necessary. Step 10
  • 31. What are the techniques used by the Quality Circle? Quality Circle uses the following ten simple problem solving tools. a. Brainstorming b. Flow Diagram c. Data Collection d. Graphs e. Pareto Analysis
  • 32. What are the techniques used by the Quality Circle? Quality Circle uses the following ten simple problem solving tools. f. Cause and Effect Diagram g. Stratification h. Scatter Diagram i. Histogram j. Control Charts
  • 33. Seven Basic Quality Tools HISTOGRAM PARETO CHART CAUSE & EFFECT FLOWCHART CHECK SHEET CONTROL CHART SCATTER DIAGRAM
  • 34.
  • 35.
  • 36.
  • 37.
  • 38. What is Brainstorming? Brainstorming is a group technique for generating new and useful ideas. It uses a few simple rules for discussion on a subject matter that contributes to originality and innovation.
  • 40. What is Data collection? Data collection is nothing but the collection of the required ‘information’ in figures for the statistical analysis of a problem. This provides a sound basis for decision making and corrective action.
  • 41. These numbers are called data. They are expression of facts of any activity or feature in numerical terms. TYPE NUMBER CUM % OF CUM OF OF TOTAL % DEFECT FANS F. Regulator 40 40 27% 27% G. Bend in Screws 25 65 17% 44% A. Motor winding 20 85 13% 57% B. Bend in wings 15 100 10% 67% C. Cracks in Central rod 14 114 9% 76% E. Scratches 12 126 8% 84% D. Capacitor 10 136 7% 91% H. Others 14 150 9% 100% Total 150 100%
  • 42. What is Graph? Graph is a pictorial representation of data which, when presented, is easily understandable. It helps to represent large amount of information comprehensively but in a compact manner.
  • 43. As Graphs are pictorial representation of data, they make it easy for anybody to understand the information. i.e. from top management to grass root level employees.
  • 44. in shop floor 0 5 10 15 20 25 Jan Feb Mar Apr May Jun Jul Aug Sep Oct Nov Dec Months Foundry Rejections (%)
  • 46. What is Stratification? Stratification is the process of separation of data into categories.
  • 47. Stratification is the process to classify large amount of data to find out whether we can get indication of problem point. It is too complicated !! Then Stratify it!! Mumbai, we have a problem !! What is it ?
  • 48. In a manufacturing organisation absenteeism was very high.
  • 49. They had 60% of the employees staying in the colony and balance in the city which was 20 Kilometres away. Staff Quaters Septa Inds. Ltd.
  • 51. It revealed that it was more in January, May, June and December. 0 10 20 30 40 50 60 Jan Feb Mar Apr May Jun Jul Aug Sep Oct Nov Dec Number of Absentees
  • 53. It was found that in December and January it was more in early morning shift starting at 6 AM and in night shift starting at 10 PM 0 5 10 15 20 25 30 Morning Shift Afternoon Shift Night Shift Number of Absentees JANUARY 0 5 10 15 20 25 30 35 Morning Shift Afternoon Shift Night Shift Number of Absentees DECEMBER
  • 54. In May and June it was during shift starting at 2 PM. 0 5 10 15 20 25 30 35 40 45 Morning Shift Afternoon Shift Night Shift Number of Absentees MAY 0 5 10 15 20 25 30 35 40 Morning Shift Afternoon Shift Night Shift Number of Absentees JUNE
  • 55. Then it was checked as to how many of the colony people were absent and how many from the city.
  • 56. Further Stratification revealed that people residing in the city were absent in most of the cases. 0 10 20 30 40 50 60 70 80 90 100 Colony residents City residents In the months of December & January Number of Absentees 0 10 20 30 40 50 60 70 80 90 100 Colony residents City residents In the months of May & June Number of Absentees
  • 57. This helped to workout an action plan. I think we should put more of colony people in the problem shifts.
  • 58. 0 100 200 300 400 500 600 700 800 100 80 60 40 20 0 % No of complaints Types of defects What is a Pareto diagram? Pareto diagram is a technique of arranging data according to priority or importance and using into a problem solving framework. This helps to find out the ‘VITAL FEW’ from the ‘USEFUL MANY’ for problem selection.
  • 59. What is a cause and effect diagram? Any defect in a component, a product or service could be due to one or more causes. To find out the relationship between the causes and effect, a diagram is drawn systematically by mapping out all the probable causes influencing the effect. This is called a cause and effect diagram.
  • 60. ANGLE BEFORE LAPPING ANGLE AFTER LAPPING 10 20 30 40 50 60 70 80 90 10 20 30 40 50 60 70 80 90 What is Scatter Diagram? Scatter Diagram is a graphical representation of relationship between two variables. It can be between a Cause and Effect and between two causes. It also reveals the nature of relationship between two variables and their approximate strength.
  • 61. As said a Scatter diagram is a graphical representation of relationship between two variables
  • 62. It can be a Cause and Effect relationship OBESE Overeating CAUSE EFFECT Lack of exercise
  • 63. What is Histogram? Histogram is a graphical representation of a frequency distribution which is a summary variation in a product or process. 30 0 5 10 15 20 25 WEIGHT (gms) FREQUENCY
  • 64. Control Charts Control charts present the results of a process over time. They are used to determine if the process is under control. They are used to monitor any type of variable output. Can be used to monitor • Cost and schedule variances; • Volume and frequency of changes; • Errors in the project documentation
  • 65. Checklist It is a list with previously defined options that are used as a guide to control risks. It allows a thorough evaluation in a short period of time.
  • 66. What are the overall benefits a member gets?
  • 67. Members get many benefits. They improve their knowledge. They learn to work together. They learn to interact better.
  • 68. They learn to present before the management their case study, which helps to boost their morale and confidence. They learn to work systematically.
  • 69. They learn to plan their activities. Above all they learn simple techniques which help in solving their problems effectively and ultimately helps in problem prevention in their work area.
  • 70. What is a Management Presentation? A management presentation is where the leader and members describe to their management what project they have been working on and what recommendations they wish to make concerning it. Participants use charts which are prepared by them. This event represents a most exciting form of participation, communication and recognition for all.
  • 71.
  • 72. ii. Organising Drama Skits on Quality Circle themes and awarding trophies for the best ones.
  • 73. iv. Honouring best QCs on Republic Day would be a good way of recognising them. On such occasions, family members, friends and general public will come to know of their good work. This will give them immense pride in their achievements.
  • 74. vi. Declaring best Circle of the year, half year, for the quarter and so on and putting up photo of the group at vantage points - Reception Hall, Canteen etc. This will go a long way in boosting the self- esteem needs of people.
  • 75. viii. Conducting regular Quiz Programmes on QC for Quality Circle teams coming from different divisions and awarding token gifts for winners. The enthusiasm generated in such programmes should be seen to know the impact of these on the motivation of QCs.
  • 76. What is being done in India by QCFI?
  • 77. Quality Circle Forum of India was established as a non-profit body in the year 1982 with Hyderabad as its Headquarters. QCFI has * Patron Members * Institutional Members * Quality Circle Members * Individual Members
  • 78. North East West South Delhi Calcutta Mumbai Chennai Kanpur Guwahati Pune Madurai Chandigarh Durgapur Vadodara Neyveli Jhalawar Rourkela Nagpur Coimbatore Faridabad Bhilai Jabalpur Cochin Gwalior Bokaro Bangalore Koraput Hyderabad QCFI has 25 Chapters all over India.