Download as PDF, PPTX

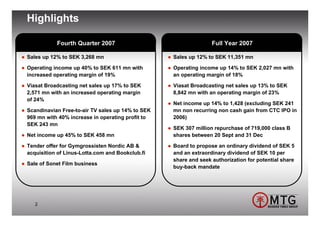
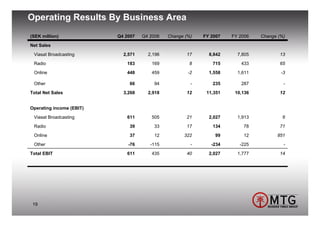
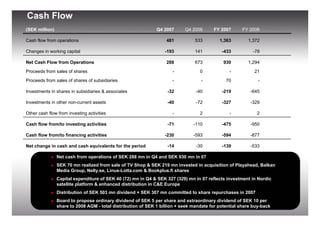
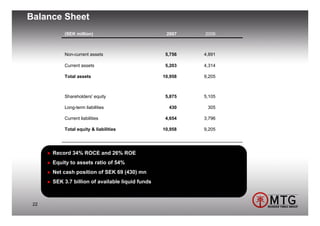
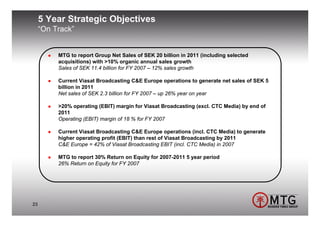

The document outlines the financial results of Modern Times Group (MTG) for the fourth quarter and full year of 2007, showing a 12% increase in sales and a 40% rise in operating income. Viasat Broadcasting saw a significant growth in net sales and operating margins, particularly in Scandanavia and Central & Eastern Europe. The report also highlights various acquisitions and strategic initiatives, including share buybacks and dividends, aimed at enhancing the company's market position.


