Download to read offline

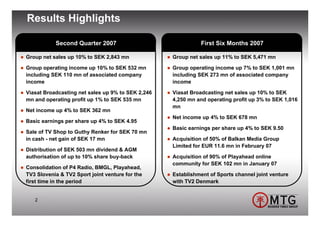
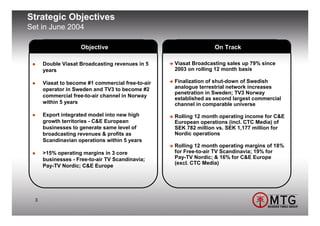
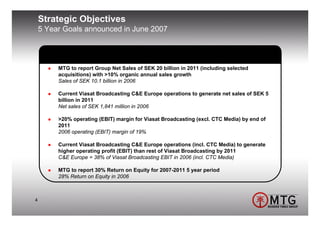
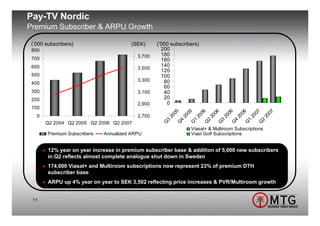
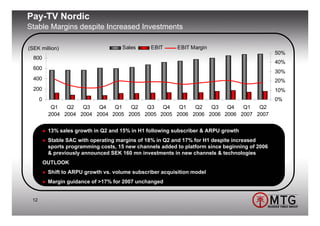

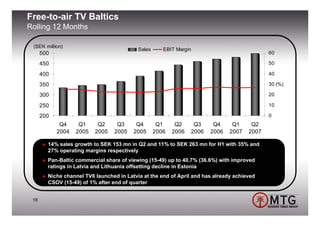
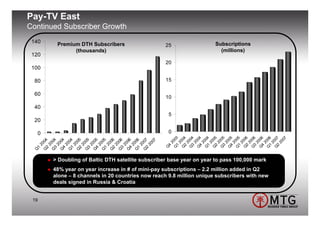
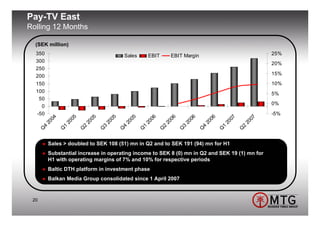
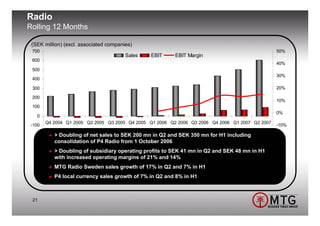

The document reports that the entertainment group achieved net sales increases of 10% in Q2 2007 and 11% for the first half, with significant growth in different segments of its broadcasting operations. It highlights strategic objectives for reaching SEK 20 billion in net sales by 2011 while enhancing operational efficiency and expanding market share in the Nordic and Eastern European regions. Additionally, it notes acquisitions and the positive impact of subscriber growth in pay-TV services.


