Download to read offline
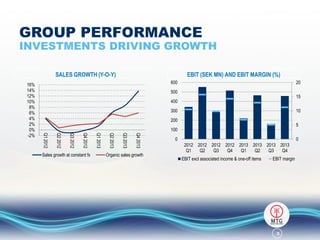
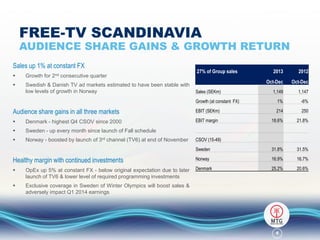
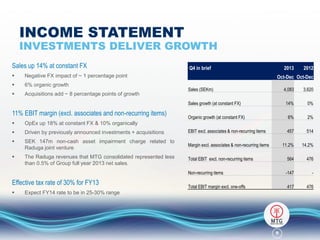
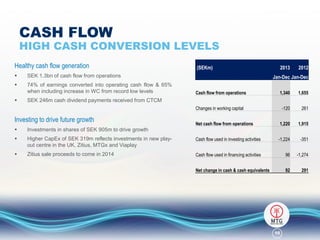
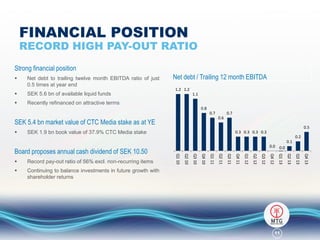


Modern Times Group reported strong financial results for Q4 2013, with accelerated sales growth of 14% driven by increased audience shares and subscriber growth across most markets. Investments in strategic growth areas like content production, digital expansion, and emerging markets delivered higher profits despite rising costs. The company proposed a record high annual dividend as it continues to balance investments for future growth with shareholder returns.


