Download as PDF, PPTX
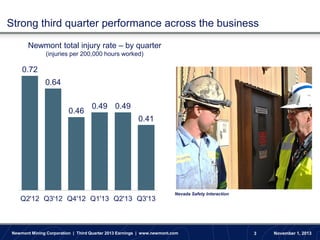
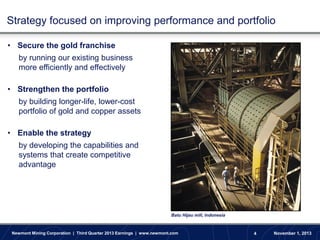

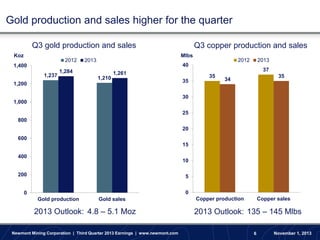
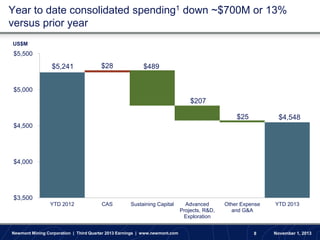
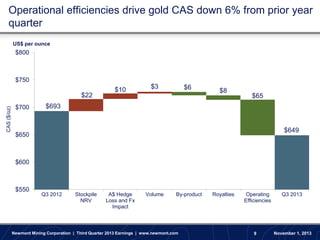
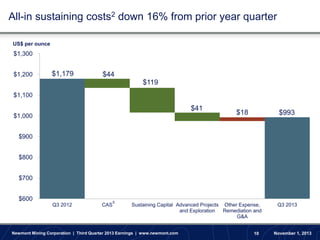

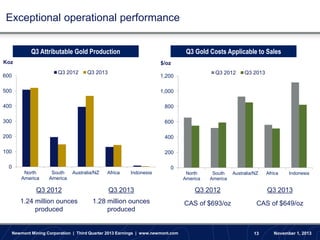

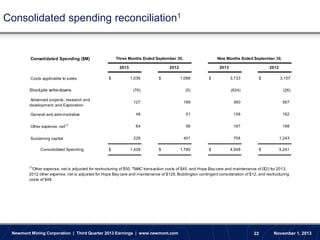
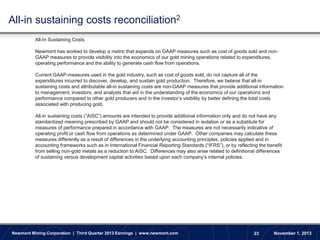
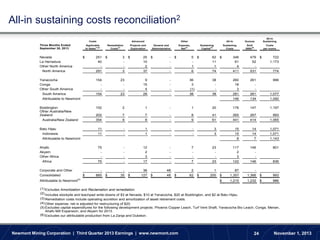
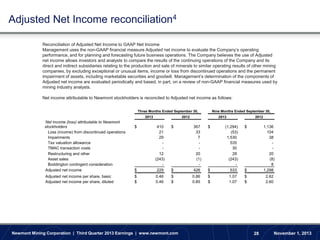

The document provides information on Newmont Mining Corporation's third quarter 2013 earnings. Key points include: - Total injury rates continued to decline quarter-over-quarter. - The company is focused on improving performance and strengthening its portfolio through building lower-cost, longer-life assets. - Year-to-date consolidated spending is down $700 million compared to prior year through cost reductions. - Third quarter gold production was higher than prior year at 1.28 million ounces, while all-in sustaining costs declined 16% to $993 per ounce. - The company maintained its 2013 gold production outlook while lowering its capital outlook by $400 million.


