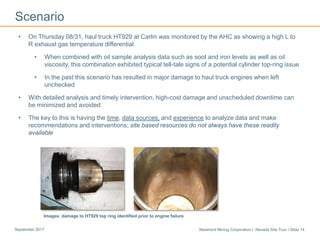
This document provides an overview of Newmont Mining Corporation's Nevada site tour in September 2017. It begins with a cautionary statement regarding forward-looking statements. The summary then discusses Newmont's strategic focus on improving safety and sustainability performance, strengthening its portfolio through projects like Long Canyon and Twin Creeks, and using its Full Potential program to drive cost improvements across its Nevada operations. An asset management discussion and demonstration of centralized health monitoring follows. The document provides background on regional leadership and concludes with information on site-specific leadership at Long Canyon.
This document is an investor presentation from Newmont Mining Corporation dated December 13, 2016. It contains forward-looking statements regarding estimates and expectations of future production, costs, capital expenditures, profitability, and other metrics. It cautions that these statements are based on assumptions that may prove to be incorrect. The presentation provides an overview of Newmont's strategy to improve its underlying business, strengthen its portfolio, and create shareholder value. It summarizes recent performance results and updates to guidance. Newmont aims to maximize opportunities and manage risks across its global operations and projects.
The document provides an agenda and overview for a CC&V site tour on September 18, 2016. The tour will include introductions, a safety overview, and stops at the Cripple Creek & Victor site to discuss the overview, exploration/geology, mining operations, mill processing, and future expansion plans. Presenters will discuss how CC&V is meeting acquisition targets through cost improvements and new facilities, and trends show operating results are favorable to guidance. The tour schedule provides times and locations for presentations on CC&V and a lunch discussion on sustainability.
2017 scotia howard weil energy conference finalGib Knight
- Newfield Exploration Company is focused on developing its large acreage position in the Anadarko Basin, which it believes can deliver decades of high returns through drilling.
- Newfield has a proven track record of finding and developing valuable plays and is a proven operator that has taken multiple plays from concept to development.
- Newfield's financial strength and capital discipline allows it to execute its development plan, even at current commodity prices, through continued Anadarko Basin oil growth.
Newmont Mining Corporation reported its Q2 2018 earnings. Some key points:
- Gold production was in line with guidance at 1.2 million ounces. All-in sustaining costs were $1,024 per ounce.
- Safety performance is improving through applying lessons learned from recent accidents.
- Two projects, Twin Underground and Northwest Exodus, were delivered on time and under budget.
- An agreement was reached to evaluate the world-class Galore Creek copper-gold asset through a partnership with Teck.
- Costs and capital expenditures remain on track with full-year guidance.
North Arrow Corporate Presentation (december 2021) finalnarminerals
Update on the positive year the rough and polished diamond markets have experienced, as well as detail on the Naujaat Diamond Project's 2021 2000 tonne bulk sample and processing. Pikoo overview also included.
This document discusses actions taken by First Quantum Minerals to strengthen its financial position amid volatile market conditions for copper and nickel. It summarizes steps like reducing capital spending and workforce, issuing equity, renegotiating debt, and starting a copper hedging program. It also provides an update on mining operations and projects, including ramping up production at its Sentinel mine and ongoing development of the large Cobre Panama project.
MIL Resources Ltd held its annual general meeting in November 2011. The chairman discussed key initiatives in 2011, including raising $4.36 million, acquiring remaining interests in Papua New Guinea projects, commencing drilling at Golden Peak and Poi projects, and engaging in joint venture discussions. The managing director reviewed the company's strategy of focusing on copper/gold exploration in Papua New Guinea and provided updates on exploration targets and plans for the Golden Peak, Poi, and other PNG projects, as well as the Amazon Bay project.
This document provides contact information for Devon Energy's investor relations department. It also includes standard legal disclosures about the use of forward-looking statements and non-GAAP financial measures in company presentations. The presentation that follows discusses Devon Energy's asset portfolio, growth strategy focused on the STACK and Delaware Basin plays, and financial strength. It highlights the company's leading positions, significant inventory of drilling locations, improving capital efficiency, and plans to increase investment and production growth rates over the next two years.
This document provides an investor presentation for Newmont Mining Corporation from October/November 2016. It includes the following key points:
- Newmont has improved its safety and sustainability performance significantly in recent years while also lowering costs.
- The company is focused on optimizing its existing business, strengthening its portfolio through organic growth projects, and creating shareholder value through industry-leading free cash flow and returns.
- Recent projects like Merian and Long Canyon are expected to provide over a decade of profitable production each and strengthen Newmont's portfolio.
- Newmont's exploration program has delivered over 123 million ounces of gold reserves at a finding cost of $23 per ounce since 2001.
- The company
Gary Goldberg, President and CEO of Newmont Mining Corporation, presented at the BMO Conference on February 24, 2014. In the presentation, he discussed Newmont's strong asset portfolio, focus on cost improvements, and clear capital allocation priorities. He highlighted that in 2013, Newmont improved its business through cost reductions, increased gold production, and divested non-core assets, while maintaining financial flexibility. Goldberg projected that gold and copper production will increase over 2014-2016, and that all-in sustaining costs will remain stable, while capital expenditures will decline by around 30% from 2014 levels. Newmont will focus capital on projects that improve the portfolio and create value, exercising capital discipline.
- Alexco Resource Corp owns the historic Keno Hill Silver District in Canada, which was the country's only primary silver producer from 2011-2013.
- The presentation outlines Alexco's plans to build a sustainable future in silver, including reducing costs, optimizing production, and converting exploration ounces to production ounces.
- Exploration at Keno Hill has been very successful, increasing indicated silver resources from 5.4 million ounces in 2006 to over 60 million ounces currently.
BMO Capital Markets Global Metals & Mining Conferenceyamanagold2015
This document provides an overview of Yamana Gold's operations and outlook. Some key points:
- 2014 production totaled 1.4 million GEO at an AISC of $807/GEO, below guidance. Cornerstone assets performed as expected.
- Operations snapshots are provided for each of Yamana's mines, highlighting 2014 performance and 2015-2017 production outlooks.
- The construction decision was made to proceed with the Cerro Moro project, with an estimated capital cost of $398 million and potential for exploration to increase reserves.
- The 2015-2017 production outlook is 1.3-1.4 million GEO annually at an AISC of $800-$830/oz, with expansionary capital
The document summarizes the results of a positive preliminary economic assessment (PEA) for the Tilemsi Integrated Phosphate Fertilizer Project in Mali. The PEA estimates a 20-year mine life with an after-tax net present value of US$635 million and internal rate of return of 33%. Key highlights include an initial capital cost of US$143 million, operating costs of US$49-91 per tonne, and potential annual production of 1.18 million tonnes of fertilizer products. The project has potential upside from additional exploration across the large land package.
ROVER MERTALS CORPORATE OVERVIEW Q1-2022 + Q2 (Youtube Video Link)MomentumPR
Rover Metals is a junior mining company focused on expanding its high-grade Cabin Gold Project in the Northwest Territories of Canada. Recent drilling has expanded known resources and increased average gold grades in all zones. A maiden NI 43-101 resource estimate is targeted for H2 2022. The project benefits from nearby infrastructure and a potential processing agreement with the developing NICO mine. Rover also owns the Tobin Gold Project in Nevada near major gold mines.
GoldQuest Mining Corp presents information on its Romero discovery project in the Dominican Republic. Key points include:
- A preliminary economic assessment shows an after-tax NPV of $219 million, IRR of 34%, payback of 2.7 years, and AISC of $572/oz for the Romero project.
- The project envisions a 2,500 tpd operation with bulk long-hole and cut-and-fill mining of a high-grade copper-gold deposit.
- Pre-production capital is estimated at $143.1 million. The management team has experience developing mines in the Dominican Republic.
SandRidge Energy has built a portfolio focused on three oil-weighted project areas: NW STACK, North Park Niobrara, and Mississippian. In 2017, the company will continue developing these areas, turning company oil production positive in late 2017. SandRidge has $563 million in liquidity and a moderate capital program focused on high-grading existing positions.
This corporate presentation summarizes Pinecrest Resources' Enchi Gold Project in Ghana. Key points include:
- The project has an inferred gold resource of over 1 million ounces based on drilling across 3 deposits that are open along strike and at depth.
- A 2015 PEA showed promising economics for an open-pit heap leach operation, including an after-tax IRR of 25% and NPV of $62 million at a $1,300 gold price.
- The land package covers 696 square kilometers of underexplored terrain along a prolific gold belt, presenting opportunities to expand resources and make new discoveries through additional drilling.
- Next steps involve permitting, metallurgical testing, and advancing
Newlox Gold Ventures Corp is a junior gold producer focused on processing artisanal tailings in Costa Rica to produce gold in an environmentally-friendly manner. The company has one processing plant in production and is ramping up to full capacity, with a second plant permitted. Newlox aims to become a mid-sized gold producer through organic growth by commissioning multiple small-scale processing facilities over the next 5 years. The company is also conducting research at the University of British Columbia to develop clean technologies for gold processing.
This document provides an overview and summary of Newmont Mining Corporation's presentation at the Bank of America Merrill Lynch 2016 Canada Mining Fireside Chat conference on September 1, 2016. Some key points:
- Newmont has improved its underlying business through cost reductions, increased productivity, and higher resource estimates.
- The company has a proven track record of exploration and development successes at its Ahafo, Tanami, and Merian operations, growing reserves and resources significantly since 2003.
- Newmont has also successfully delivered first production at projects like Long Canyon and is on track to do the same at Merian and the Tanami expansion on schedule and on budget.
- The presentation outlines Newmont
Stornoway reported its first quarter 2018 results on May 16th, 2018. Key highlights included:
- Two lost-time incidents occurred but no environmental non-compliance issues.
- Underground mine ramp-up is on track to reach full production by end of Q2 2018.
- Tonnes processed and carats recovered were below plan due to lower grade ore being processed. Guidance for 2018 carats was revised down.
- Adjusted EBITDA was $7.4 million and the adjusted EBITDA margin was 19%, reflecting lower production.
- $31.1 million in capital expenditures were incurred primarily for the ore sorting facility and underground mine development.
Stornoway provided forward-looking information in its first quarter 2018 results presentation. The forward-looking statements related to objectives, medium and long-term goals, strategies, mineral reserves, future production, financial estimates, mine expansion potential, development timelines, market prices, financing requirements, and assumptions regarding grades, recoveries, and costs. However, the assumptions may prove incorrect and important risk factors could cause actual results to differ materially from expectations. Qualified persons prepared the technical reports and Robin Hopkins supervised exploration programs. Non-IFRS measures including adjusted EBITDA, average diamond price, and cash operating costs per tonne were also included.
Royal Gold reported its third quarter 2014 results on May 1, 2014. It produced 44,662 gold equivalent ounces during the quarter, with revenue of $57.7 million and earnings of $20.1 million. Production was lower than the previous year due to declining gold prices and slightly lower volumes, particularly at the Andacollo mine. However, commercial production had begun at the Mt. Milligan mine. Royal Gold also completed three precious metal acquisitions totaling $94.5 million during the quarter to strengthen its growth profile.
2014 website tj annual meeting final nov 14 2014RoyalGold
Royal Gold held its 2014 Annual Meeting in November. Key highlights included strong volume growth driven by the ramp up of Mt. Milligan and development of the Phoenix project. Royal Gold has a quality portfolio with long mine lives at its largest investments and a focus on investment-grade counterparties and jurisdictions. Financially, Royal Gold has over $900 million in liquidity and a track record of increasing its dividend for 14 consecutive years while maintaining a competitive payout ratio.
This document provides information about SEMAFO's Denver Gold Forum taking place from September 18-21, 2016 in Colorado Springs, CO. It discusses SEMAFO's operating success at its Mana Mine in Burkina Faso, its feasibility study for the new Natougou project indicating strong economics, and outlines its growth profile and exploration programs.
The document summarizes a preliminary economic assessment for Highbank Resources Ltd.'s Swamp Point North Aggregate Project in British Columbia. Key highlights include an after-tax net present value of C$24.3 million and forecast revenue of C$98.9 million over the life of the project. The assessment found potential for economic development and production of the project, subject to future marketing initiatives. It recommends Highbank continue advancing the project toward production by concluding initial sales agreements in parallel with ongoing site works.
QMX Gold - Corporate Presentation - October 2018 QMXGold
QMX Gold is a Quebec based junior exploration company focused on exploring their extensive and highly prolific Val d’Or Mining Camp in the Abitibi District of Quebec. Building on a broad exploration database, QMX is applying new geological models and systematically exploring new targets
- Royal Gold reported solid financial results for the first quarter of 2015, with net income up 23% and adjusted EBITDA of $0.86 per share, despite a 3% decline in the gold price.
- Production at Mt. Milligan continues to ramp up, reaching over 135,000 ounces of gold produced year-to-date. Throughput is expected to reach design capacity by year-end.
- Construction at the Phoenix gold project remains on schedule for a mid-2015 start-up. Over half of the project has been completed and mill assembly is underway.
This document provides a summary of Newmont Mining Corporation's full year and Q4 2016 earnings. Some key points:
- Safety performance improved with injury rates down 50% and fatigue events down 87% due to increased training and technology.
- Operational performance was strong with gold production up 7% to 4.9Moz and AISC down 2% to $912/oz through cost discipline.
- The portfolio was optimized through developing two new mines $200M below budget and adding over 4Moz of reserves while divesting non-core assets.
- Financial results were up significantly year-over-year with free cash flow more than doubling to $784M and adjusted E
Gary Goldberg, President and CEO of Newmont Mining Corporation, presented at the BMO Metals & Mining Conference on February 27, 2017. The presentation included:
1) Cautionary statements regarding the forward-looking nature of estimates and expectations in the presentation.
2) An overview of Newmont's strategy to deliver long-term shareholder value through steady long-term gold production, ongoing cost discipline and capital investment in profitable growth projects.
3) Details on Newmont's consistently strong operational and financial results in recent years, as well as leading safety and sustainability performance.
Gary Goldberg, President and CEO of Newmont Mining Corporation, presented at the Denver Gold Forum in September 2017. The presentation covered Newmont's strategy of improving its underlying business through superior operational execution, strengthening its global portfolio of long-life assets, and creating value for shareholders by leading the sector in profitability and responsibility. It provided details on Newmont's projects and growth pipeline, industry-leading reserves, and financial flexibility to fund growth and return cash to shareholders.
Gary Goldberg, President and CEO of Newmont Mining Corporation, presented at the Denver Gold Forum in September 2017. The presentation covered Newmont's strategy of improving its underlying business through superior operational execution, strengthening its global portfolio of long-life assets, and creating value for shareholders by leading the sector in profitability and responsibility. It highlighted Newmont's industry-leading safety and cost improvement performance, profitable growth projects, top-tier reserves, and financial flexibility.
This three sentence summary provides the high level information from the investor presentation document:
The document is an investor presentation from Newmont Mining Corporation that includes forward-looking statements and cautions readers that actual results may differ. It outlines Newmont's strategy of improving operational performance, strengthening its portfolio through projects like Merian and Long Canyon, and creating shareholder value through increased free cash flow and returns. The presentation also provides updates on Newmont's safety and sustainability performance as well as its financial and operating results.
- Gary Goldberg, President and CEO of Newmont Mining Corporation, presented at the Denver Gold Forum in September 2016
- The presentation contained forward-looking statements regarding estimates and expectations of future production, costs, capital expenditures, and other metrics, which are based on certain assumptions that may prove to be incorrect
- Newmont's strategy focuses on improving the underlying business by optimizing costs, strengthening the portfolio through organic growth and acquisitions, and creating shareholder value through industry-leading returns, cash flow, and financial flexibility
The document summarizes Newmont Mining Corporation's 2017 Investor Day that took place on December 6, 2017. It includes an agenda for the day-long event covering Newmont's business, technical, operational and exploration outlooks. Presentations were given on safety, Newmont's strategy and performance, the gold market outlook, and financial projections. The document provides an overview of Newmont's global portfolio of long-life assets and projects as well as charts on production, cost, capital and reserve metrics through 2022. It emphasizes Newmont's focus on operational excellence, profitable growth from its project pipeline, and leadership in sustainability and value creation.
Newmont Mining Corporation reported its Q1 2017 earnings. Gold production for Q1 was 1.2 Moz, up 9% year-over-year and the company remains on track to meet its full-year guidance of 4.9-5.4 Moz. All-in sustaining costs for Q1 were $900/oz, below guidance. Newmont also approved expansions at its Ahafo mine in Africa, which will improve profitability and mine life. The expansions include an underground mine and mill expansion.
- Newmont Mining Corporation reported its Q3 2017 earnings. Key highlights included strong operational execution, leading safety performance, and top sustainability ratings.
- AISC for Q3 was $943/oz due to strong performance in Africa, Australia, and North America. Attributable gold production for Q3 was 1.3 million ounces, up 7% from the prior year.
- The company is progressing long-life assets globally and longer-term growth projects in Canada, Australia, and French Guiana to sustain production and extend mine lives.
Gary Goldberg, President and CEO of Newmont Mining Corporation, presented at the Denver Gold Forum on September 16, 2014. The presentation included:
1) Cautionary statements regarding forward-looking statements and underlying assumptions in estimates and expectations.
2) Newmont has industry-leading safety performance and is delivering on commitments by lowering costs and strengthening its portfolio.
3) Newmont is focused on maximizing productivity and efficiency across its global portfolio of operations and projects.
Gary Goldberg, President and CEO of Newmont Mining Corporation, presented at the Denver Gold Forum on September 16, 2014. The presentation included:
1) Newmont has industry-leading safety performance and is delivering on commitments to lower costs and strengthen its portfolio.
2) Key projects including Merian, Turf Vent Shaft, and the Ahafo Mill Expansion are on track to optimize production.
3) Newmont has an industry-leading project pipeline and clear capital priorities to maximize value for shareholders.
Gary Goldberg, President and CEO of Newmont Mining Corporation, presented at the Denver Gold Forum on September 16, 2014. In his presentation, he highlighted Newmont's industry-leading safety performance and progress in lowering costs and improving production outlook. He also discussed Newmont's strong and diversified portfolio of operating mines and projects, optimized project pipeline, and disciplined capital allocation approach.
The document is a presentation by Gary Goldberg, President and CEO of Newmont Mining Corporation, at the BAML Metals and Mining Conference in May 2017. It summarizes Newmont's leading safety and sustainability performance, stable production profile from a globally diversified portfolio of assets, investment in profitable growth projects, and opportunities from recent investments and discoveries that provide upside potential. Newmont aims to deliver long-term shareholder value through steady gold production, ongoing cost discipline and capital investment focused on high return projects.
This document is an investor presentation from Newmont Mining Corporation from November 2017. It summarizes Newmont's strategy to improve its underlying business through superior operational execution, strengthen its portfolio of global assets, and sustain a portfolio of long-life mines. Key points include Newmont leading the sector in safety and sustainability performance, having a global portfolio of long-life assets across four continents, and investing in profitable growth projects across its portfolio to extend mine lives and production.
The document is an investor presentation from Newmont Mining Corporation dated September 2017. It provides an overview of Newmont's operations, projects, growth opportunities and key metrics. Newmont has a geographically diverse portfolio of gold mines in North America, South America, Africa and Australia. It is investing in profitable growth projects across its portfolio to sustain steady long-term production while maintaining cost and capital discipline. Newmont also has a leading project pipeline and track record of bringing projects into production.
This document provides a cautionary statement regarding forward-looking statements in an investor presentation by Newmont Mining Corporation. It notes that estimates and expectations in the presentation are based on assumptions that may prove to be incorrect. It also lists potential risks to the forward-looking statements including changes in geotechnical or other conditions, permitting and development issues, political risks, commodity price volatility, and other operational risks. The company does not undertake to publicly revise or update forward-looking statements except as required by law.
This investor presentation provides an overview of Newmont Mining Corporation and highlights key points:
1) Newmont has improved its underlying business through cost reductions, growing production from new projects, and divesting non-core assets. All-in sustaining costs have decreased 22% since 2012.
2) The company has strengthened its portfolio through investing in projects like Merian and Long Canyon that have longer mine lives and lower costs than divested assets.
3) Newmont has created shareholder value by outperforming peers in free cash flow generation, with $1.2 billion generated since 2012. This has allowed it to self-fund projects and increase dividends.
Newmont Mining Corporation held an ESG briefing on May 22, 2018 to discuss their approach to sustainability. The briefing covered Newmont's environmental, social, and governance performance and strategies. Newmont's sustainability efforts are focused on minimizing risks and creating long-term value. Their sustainability framework and robust management systems aim to drive accountability and continuous improvement across their global portfolio.
This document contains forward-looking statements regarding Newmont Mining Corporation's estimates, expectations, and assumptions around future production, costs, capital expenditures, projects, and financial performance. It cautions that actual results could differ materially from expectations due to risks and assumptions that may not prove to be correct around permitting, development, operations, commodity prices, exchange rates, and other factors. The document outlines Newmont's strategy to improve the underlying business through ongoing cost reductions, strengthen its portfolio through investments in projects like Merian and Long Canyon Phase 1, and create shareholder value through strong free cash flow and returns.
This document provides a cautionary statement regarding forward-looking statements in Newmont Mining Corporation's investor presentation. It notes that estimates and expectations in the presentation are based on assumptions that may prove to be incorrect. It lists key assumptions including around geological, metallurgical and other conditions, permitting, development and expansion of operations, political stability, exchange rates, commodity prices, supply prices, mineral reserve and resource estimates, and other risks. The company does not undertake to publicly revise or update forward-looking statements except as required by law.
This document provides an investor presentation for Newmont Mining Corporation from August 2018. It contains forward-looking statements regarding estimates of future production, costs, capital expenditures, and other metrics. It summarizes Newmont's strategy of investing in profitable projects across economic cycles to create long-term value. Examples provided include the Merian mine in Suriname, the Long Canyon expansion in Nevada, and the Tanami expansion in Australia. The presentation also highlights Newmont's industry-leading reserve base and long-term production profile from existing and future projects.
- The document is a presentation from Gary Goldberg, President and CEO of Newmont Mining Corporation, at the BAML Global Metals & Mining Conference in May 2018.
- It discusses Newmont's strategy of focusing on sustainable value creation through its global portfolio of long-life assets and project pipeline, with improvements including new lower cost mines and profitable expansions.
- Newmont highlights its leading sustainability performance and top quartile total shareholder returns since 2014.
The document is an investor presentation from Newmont Mining Corporation that provides an overview of the company's operations and projects. It summarizes Newmont's track record of improving operational execution and reducing costs. It outlines a portfolio of projects expected to sustain profitable production over the next several years. These include expansions and new mines across North America, Australia, Africa, and South America. The presentation provides production and cost guidance for 2018-2022 and demonstrates Newmont's pipeline of long-term projects beyond the next 5 years.
- Newmont Mining Corporation reported its Q1 2018 earnings on April 26, 2018.
- The company reported adjusted EBITDA of $644 million, up 12% from the prior year quarter, and adjusted net income of $0.35 per diluted share.
- Production was in line with guidance at 1.2 million ounces of gold, and AISC was $973 per ounce, also in line with guidance.
This document provides an investor presentation for Newmont Mining Corporation from March 2018. It includes cautionary statements regarding forward-looking statements. The presentation summarizes Newmont's steady trajectory of improved financial and operational performance from 2013 to 2017. It highlights projects in the pipeline expected to sustain profitable production through 2024. The presentation also discusses Newmont's industry-leading reserve base, balanced capital priorities of growth, debt reduction and returning cash to shareholders, and leadership in profitability and responsibility.
This document is an investor presentation from Newmont Mining Corporation given at a BMO Metals & Mining Conference in February 2018. It summarizes Newmont's financial and operating performance in recent years, current projects and growth plans, and strategy for delivering long-term value to shareholders through profitable production, an industry-leading project pipeline, and returning cash to shareholders.
This document contains the highlights from Newmont Mining Corporation's full year and Q4 2017 earnings report. Some key points:
- Newmont achieved strong operational and financial performance in 2017, with 8% higher gold production of 5.3 million ounces and $1.5 billion in free cash flow, an 88% increase over 2016.
- The company invested in five expansion projects to extend production and replaced mining depletion by adding 6.4 million ounces of gold reserves and 7.9 million ounces of resources.
- Guidance for 2018 forecasts gold production of 4.9-5.4 million ounces at an all-in sustaining cost of $965-1,025 per ounce and total capital spending
This investor presentation provides an overview of Newmont Mining Corporation and its strategy for long-term value creation. Key points include:
- Newmont has a proven strategy of improving operations, strengthening its global portfolio of long-life assets, and delivering superior returns to shareholders.
- The company has significantly reduced costs while increasing production and reserves through operational improvements and profitable expansion projects.
- Newmont has an industry-leading project pipeline expected to provide stable production for over a decade and generate significant free cash flow.
- The company maintains a strong balance sheet, stable production profile, and pays a sustainable dividend, while continuing to invest in growth.
This document provides an overview of Newmont Mining Corporation's Nevada site tour in September 2017. It begins with a cautionary statement regarding forward-looking statements. The summary then discusses Newmont's strategic focus on improving safety and sustainability performance, strengthening its portfolio through projects like Long Canyon and Twin Creeks, and using its Full Potential program to drive cost improvements across its Nevada assets. An asset management discussion and demonstration of centralized health monitoring follows. The document provides background on regional leadership and concludes with information on local site leadership at Long Canyon.
- Newmont Mining Corporation reported its Q2 2017 earnings on July 25, 2017.
- In Q2, the company's AISC decreased 3% to $884/oz due to strong operational execution, and attributable gold production increased 13% to 1.4 Moz from higher grades and throughput.
- The company approved its Twin Underground project, which is expected to add higher grade ore and extend the mine life at lower costs.
This document summarizes a site tour of Newmont Mining Corporation's Merian gold mine in Suriname. The tour included introductions of company leadership, an overview of the Merian Project including health and safety practices, commercial production milestones, community investment programs, and plans for optimizing operations and exploring additional opportunities in the region. The mine began commercial production in 2016 and is expected to produce 300,000-375,000 ounces of gold annually over its projected 13+ year mine life.
- Newmont Mining Corporation presented at the Goldman Sachs Global Metals & Mining Conference in November 2016
- The presentation outlines Newmont's strategy to improve its underlying business, strengthen its portfolio, and create shareholder value through optimizing costs, organic growth, and portfolio enhancements
- Newmont highlights its track record of reducing costs, extending mine life through reinvestment and divestment, growing production, improving margins, and generating industry-leading returns and free cash flow
Cleades Robinson, a respected leader in Philadelphia's police force, is known for his diplomatic and tactful approach, fostering a strong community rapport.
The E-Way Bill revolutionizes logistics by digitizing the documentation of goods transport, ensuring transparency, tax compliance, and streamlined processes. This mandatory, electronic system reduces delays, enhances accountability, and combats tax evasion, benefiting businesses and authorities alike. Embrace the E-Way Bill for efficient, reliable transportation operations.
World economy charts case study presented by a Big 4
World economy charts case
World economy charts case study presented by a Big 4
World economy charts case study presented by a Big 4World economy charts case study presented by a Big 4
World economy charts case study presented by a Big 4
World economy charts case study presented by a Big 4World economy charts case study presented by a Big 4World economy charts case study presented by a Big 4World economy charts case study presented by a Big 4World economy charts case study presented by a Big 4World economy charts case study presented by a Big 4World economy charts case study presented by a Big 4World economy charts case study presented by a Big 4World economy charts case study presented by a Big 4World economy charts case study presented by a Big 4World economy charts case study presented by a Big 4World economy charts case study presented by a Big 4World economy charts case study presented by a Big 4World economy charts case study presented by a Big 4study presented by a Big 4
MUTUAL FUNDS (ICICI Prudential Mutual Fund) BY JAMES RODRIGUESWilliamRodrigues148
Mutual funds are investment vehicles that pool money from multiple investors to purchase a diversified portfolio of stocks, bonds, or other securities. They are managed by professional portfolio managers or investment companies who make investment decisions on behalf of the fund's investors.
2. Newmont Mining Corporation I Nevada Site Tour I Slide 2September 2017
Cautionary statement
Cautionary statement regarding forward looking statements:
This presentation contains “forward-looking statements” within the meaning of Section 27A of the Securities Act of 1933, as amended, and
Section 21E of the Securities Exchange Act of 1934, as amended, which are intended to be covered by the safe harbor created by such
sections and other applicable laws. Such forward-looking statements may include, without limitation: (i) estimates of future production and
sales; (ii) estimates of future costs applicable to sales and All-in sustaining costs; (iii) estimates of future capital expenditures; (iv) estimates
of future cost reductions and efficiencies; (v) expectations regarding the development, growth and potential of the Company’s operations,
projects and investments, including, without limitation, returns, IRR, schedule, decision dates, mine life, commercial start, first production,
capital average production, average AISC and upside potential; (vi) expectations regarding future debt repayments and reductions; (vii)
expectations regarding future Free Cash Flow generation, liquidity and balance sheet strength; (viii) estimates of future closure costs and
liabilities; and (ix) expectations of future dividends and returns to shareholders. Estimates or expectations of future events or results are
based upon certain assumptions, which may prove to be incorrect. Such assumptions, include, but are not limited to: (i) there being no
significant change to current geotechnical, metallurgical, hydrological and other physical conditions; (ii) permitting, development,
operations and expansion of the Company’s operations and projects being consistent with current expectations and mine plans; (iii)
political developments in any jurisdiction in which the Company operates being consistent with its current expectations; (iv) certain
exchange rate assumptions for the Australian dollar to the U.S. dollar, as well as other the exchange rates being approximately consistent
with current levels; (v) certain price assumptions for gold, copper and oil; (vi) prices for key supplies being approximately consistent with
current levels; (vii) the accuracy of our current mineral reserve and mineralized material estimates; and (viii) other assumptions noted
herein. Potential additional risks include other political, regulatory or legal challenges and community and labor issues. Where the
Company expresses or implies an expectation or belief as to future events or results, such expectation or belief is expressed in good faith
and believed to have a reasonable basis. However, such statements are subject to risks, uncertainties and other factors, which could
cause actual results to differ materially from future results expressed, projected or implied by the “forward-looking statements”. Other risks
relating to forward looking statements in regard to the Company’s business and future performance may include, but are not limited to, gold
and other metals price volatility, currency fluctuations, increased production costs and variances in ore grade or recovery rates from those
assumed in mining plans, political and operational risks, community relations, conflict resolution and outcome of projects or oppositions
and governmental regulation and judicial outcomes. For a more detailed discussion of such risks and other factors, see the Company’s
2016 Annual Report on Form 10-K, filed on February 21, 2017, with the Securities and Exchange Commission (SEC) as well as the
Company’s other SEC filings. The Company does not undertake any obligation to release publicly revisions to any “forward-looking
statement,” including, without limitation, outlook, to reflect events or circumstances after the date of this presentation, or to reflect the
occurrence of unanticipated events, except as may be required under applicable securities laws. Investors should not assume that any lack
of update to a previously issued “forward-looking statement” constitutes a reaffirmation of that statement. Continued reliance on “forward-
looking statements” is at investors' own risk. Investors are reminded that this presentation should be read in conjunction with Newmont’s
Form 10-Q which has been filed on July 25, 2017 with the SEC (also available at www.newmont.com).
4. Newmont Mining Corporation I Nevada Site Tour I Slide 4September 2017
Strategic imperative to improve and grow business
Long Canyon
Improve the underlying business
• Step-change in safety
• Increase value through improved integration
• Improve costs and commercial culture
• Leverage fit-for-purpose technology
Strengthen the portfolio
• Advance profitable projects and prospects
• Value accretive build of Reserve base
Enable the strategy
• Improve leadership pipeline and diversity
• Strategically leverage stakeholder relationships
Twin Creeks
5. Newmont Mining Corporation I Nevada Site Tour I Slide 5September 2017
Leading safety and sustainability performance
Total injury rates down 70% over last 9 years
• Front line leadership visibility and engagement
• Fatality Risk Management is top priority
• Deploying technology to improve safety
performance (e.g., fatigue detection)
1 1 1 1 1 1
0.00
0.40
0.80
1.20
1.60
2008
2009
2010
2011
2012
2013
2014
2015
2016
H12017
Total Recordable Injury Frequency Rate Lost Time Injury Frequency Rate
North America safety performance (injury rates per 200,000 hours worked)
Fatalities
Recognized sustainability leadership
• Mining industry leader in DJSI for last 3 years
• Superior land position and long-term access
through landmark conservation agreement
• Social focus on partnering with stakeholders to
maintain license to operate, enable growth
6. Newmont Mining Corporation I Nevada Site Tour I Slide 6September 2017
• 2017 guidance1 improved for gold production (2.1 to 2.2Moz) and AISC2 ($855 to $930/oz) on:
− Lower cost production at new operations: Long Canyon, CC&V outperforming as ramp-up continues
− Mine plan improvements at Carlin and Phoenix
− Blend management improvements at Twin Creeks
− Full Potential cost and efficiency improvements across portfolio
• Outperformance more than offsets impacts of geotechnical issues in H1
Strong operational performance and outlook
Phoenix
7. Newmont Mining Corporation I Nevada Site Tour I Slide 7September 2017
Cripple Creek & Victor
Twin Creeks
Phoenix
Carlin
Turquoise Ridge JV
Carlin Underground
Long Canyon
Cornerstone asset with significant land position
Twin Creeks
• Mines – Vista and Mega pits
• Plants – Sage and Juniper mills
• JVs – Turquoise Ridge
• Projects – Twin UG – first production in Q4
Phoenix
• Mines – Fortitude, Bonanza, Lone Tree
• Plants – Phoenix Mill, Copper Leach
Carlin
• Open pit mines
− Silverstar
− Goldstar
− Gold Quarry
− Emigrant
• Underground mines
− Exodus
− Leeville/Turf
− Pete Bajo
− Chukar
• Plants
− Mill 5
− Mill 6
− South Area Leach
− North Area Leach
− Emigrant Area Leach
• Projects
− Northwest Exodus
Cripple Creek & Victor
• Mines – Cresson and WHEX pits
• Plants – Mill, Valley Leach Facility 1,
Valley Leach Facility 2
Long Canyon
• Mine & plant – Phase I pit and leach
8. Newmont Mining Corporation I Nevada Site Tour I Slide 8September 2017
Full Potential drives significant 2017 improvement
• Global FP Program has delivered >$1B3 in cost and efficiency improvements since 2012
• North America FP on track to deliver substantial savings in 2017; improvement is exceeding budget;
year to date >$85M FP savings delivered from 94 initiatives, including:
− >$35M from surface mining optimization (haulage, maintenance, mine plan, ore control).
Example: improvements in Carlin ore control routing logic to optimize recovery through
improved sampling of blast-hole data
− >$25M in processing improvement (down time, recovery & circuit optimization). Example:
reducing cycle time in the CC&V filter press by optimizing circuit
− >$10M in underground operation savings (payload & haulage, fleet productivity, contract
services). Example: in-sourcing mine development and production at Leeville
− ~$10M in supply chain and capital. Example: renegotiated contract for grinding media
combined with lower consumption
• FP historic focus was site-based; now FP focuses on unlocking value regionally (and globally) and
shifting gears in terms of value delivery
9. Newmont Mining Corporation I Nevada Site Tour I Slide 9September 2017
Going forward: Improving costs and margin outlook
Full Potential, assisted by technology, on track to deliver major improvements:
• Continuing to optimize costs and apply capital discipline
− Examples: improving TSF planning & construction methods across Carlin and Phoenix; improved
vendor agreements and regional rebuild criteria
• Redesigning the way we work
− Examples: deploying new technologies including automation & drones; improved assay processes
Strategic game changers being assessed:
• Leveraging ‘big data’ and technology adoption
• Driving regional and global synergies
Examples: regional asset health center,
mobile fleet asset strategies
• Asset and resource optimization
• Processing and logistics
11. Newmont Mining Corporation I Nevada Site Tour I Slide 11September 2017
Centralized Asset Management - Purpose
The purpose of the Regional Asset Management Team is to
maximize the life cycle value of the North American Asset Base
• Providing Centralized Planning support to sites
- Common work instructions
- Common and accurate Bill of Materials
- Common and accurate labor and skills estimations
• Provide Centralized Asset Health Monitoring
- Analysts generate recommended actions via Dingo/SAP integration
- Analysts determine major component replacements based on condition
- Provides SME support to sites for critical decision making
• Optimizing/Aligning Asset Strategies throughout organization
- Reliability Engineering/Modeling
- Life Cycle Cost Modeling
12. Newmont Mining Corporation I Nevada Site Tour I Slide 12September 2017
Centralized Asset Management – Value Proposition
Sustain and improve the asset performance by developing
people, process and systems that lock-in value
Integrate asset strategy optimization through centralized
planning on a Regional basis with site involvement
Reduce replication of activities being executed site-by-site
Develop maintenance planners into mature asset management
practitioners supporting a commercial culture
Focus on the condition and performance of our assets, moving
toward a higher level of planned and scheduled work
Evaluate the strategies currently in place at different sites and
align on “one best approach” throughout our asset base
“One common
approach to
managing our
asset base”
13. Newmont Mining Corporation I Nevada Site Tour I Slide 13September 2017
Asset Health Center – rapid resolutions
Condition
Intelligence
Planners
Historic
trends and
correlations
Real-time
data from
multiple
assets
ISSUE
IDENTIFIED
Sample
analysis
(eg fluids)
Conditioning
monitoring
experience
Work
order
generated
(SAP)
Trouble-
shooting
guidance
received
Real-time
updates
Remedial
action
Providing next-generation asset health management
• Rapid identification of potential issues
• Diagnosis in correlation with historic trends (site-region-global)
• Integrated within existing systems (eg SAP)
• Timely actions avoid higher-cost damage and downtime
Asset Health
Center at region
Planners at site
INTERVENTION
High confidence
recommendation
provided
14. Newmont Mining Corporation I Nevada Site Tour I Slide 14September 2017
Scenario
• On Thursday 08/31, haul truck HT929 at Carlin was monitored by the AHC as showing a high L to
R exhaust gas temperature differential
• When combined with oil sample analysis data such as soot and iron levels as well as oil
viscosity, this combination exhibited typical tell-tale signs of a potential cylinder top-ring issue
• In the past this scenario has resulted in major damage to haul truck engines when left
unchecked
• With detailed analysis and timely intervention, high-cost damage and unscheduled downtime can
be minimized and avoided
• The key to this is having the time, data sources, and experience to analyze data and make
recommendations and interventions; site based resources do not always have these readily
available
Images: damage to HT929 top ring identified prior to engine failure
16. Newmont Mining Corporation I Nevada Site Tour I Slide 16September 2017
Pursuing prospects across broader region
Yukon
Greenfields exploration
Near-mine exploration
Carlin UG
Twin UG
CC&V OP & UG
Long Canyon
Eastern Great Basin
Arizona
Under assessment
• Progressing projects: NW Exodus,
Twin Underground and Long Canyon Phase 2
• Near-mine exploration strategy
focuses on developing underground
resources
19. Newmont Mining Corporation I Nevada Site Tour I Slide 19September 2017
Background on North America regional leadership
Andrew Woodley, Regional Senior Vice President – North America
Mr. Woodley joined Newmont in January, 2017 as the Regional Senior Vice President for our
North America operations. He brings more than 20 years of mining sector experience across a
diverse array of commodities including gold, copper, silver, molybdenum, coal and aluminum.
He spent the past 19 years with Rio Tinto, where he held a variety of leadership roles, most
recently as CEO of their Oyu Tolgoi copper business in Mongolia.
Prior to Rio Tinto he worked in exploration in Canada, as well as management consulting in
the mining and manufacturing industries. He holds a Bachelors degree in Mining Engineering
from the University of New South Wales in Australia, as well as a Masters in Business
Administration from Wilfred Laurier University in Canada.
Wayne Trudel, Regional Group Executive, Exploration – North America
Mr. Trudel was named Group Executive Exploration North America in 2010. He served
previously as the Director of Geology for North America and as the Carlin Trend Geology
Manager for both Surface and Underground operations. Mr. Trudel first joined Newmont as a
Staff Geologist for the Bluestar Subdistrict in May 1995. For 10 years prior he worked for
Amax Gold, where he held several geology positions, including Senior Mine Geologist for the
Sleeper Mine in Northeastern Nevada.
Mr. Trudel’s mining and exploration experience spans more than three decades, with many of
those years spent in the Great Basin region of the U.S. and in South America. He received a
Bachelor of Arts degree in Geology from the University of Montana, and is a Certified
Professional Geologist through AIPG.
20. Newmont Mining Corporation I Nevada Site Tour I Slide 20September 2017
Background on North America regional leadership
Gary Dowdle, General Manager Operations Services – North America
Mr. Dowdle has worked in various operational roles during his 22 years with Newmont. He joined the
company in 1994 as a General Foreman for Carlin Surface Operations and progressed through various
leadership roles including Mine Superintendent, Maintenance Superintendent, Mine Manager Operations,
General Manager Operations, and Vice President of Operations. In his current role as General Manager
Operations Services, he has primary responsibility for Health, Safety, and Loss Prevention; Security; Asset
Management; Energy; and Capital Projects. Prior to Newmont, Mr. Dowdle worked in numerous surface
and underground operations throughout the Western United States including Selland Construction and
Mining Company, Gilbert Western Mining Corporation, and Harrison Western Corporation. He began his
mining career in 1977 at the Colorado School of Mines when he had the opportunity to work for the Earth
Mechanics Institute.
Daniel Janney, General Manager, Integration & Optimization
Mr. Janney joined Newmont in May, 2017 as the General Manager Integration and Optimization for the
North America region. He brings more than 25 years of international mining sector experience across
a diverse array of commodities including gold, copper, molybdenum, uranium and coal. The bulk of his
career was spent with Rio Tinto where he held a variety of roles, most recently as the Head of
Productivity Delivery for the global business based in Canada. Prior to joining Newmont he worked as
a consultant for a gold operation in Turkey. He holds a Bachelors degree in Metallurgical Engineering
from the Montana College of Mineral Science and Technology along with a Masters in Business
Administration from the University of Utah.
Jason Hill, Regional Asset Management Director
Mr. Hill joined Newmont in February, 1991 as a diesel mechanic at our Twin Creeks mine. He moved
into maintenance planning in 1998 and progressed to Superintendent in 2001. Over the next 15 years,
he has served in various mine operations and maintenance leadership roles throughout the North
America Region. In 2015, he was named Director of Asset Management for North American
Operations. He has since built a highly capable centralized team of Asset Management professionals
with the primary goal of increasing the region’s Asset Management maturity, skills, processes and
systems to deliver sustainable asset cost performance and reliability improvements.
21. Newmont Mining Corporation I Nevada Site Tour I Slide 21September 2017
Gordon Mountford, General Manager
• Time in position – 1.5 years
• Total tenure at Newmont – 24.5 years
• Bachelor of Science, Mine Engineering from Montana Tech
Randy Walund, Mine Manager
• Time in position – 5 years
• Total tenure at Newmont – 25 years
• Bachelor of Science, Mine Engineering from Montana Tech
Clayton Prothro, Process Manager
• Time in position – 6 years
• Total tenure at Newmont – 21 years
• 31 years in the Mining industry
Temby Lawrence, Manager, Health, Safety and Loss Prevention
• Time in position – 2 years
• Total tenure at Newmont – 14 years
• Bachelor of Fine Arts in Graphic Design from Montana State University; Masters in Occupational
Health and Safety currently in progress from Columbia Southern University
Background on Long Canyon leadership
22. Newmont Mining Corporation I Nevada Site Tour I Slide 22September 2017
Mike Schaffner, General Manager, Carlin
• Time in position – 2 years
• Total tenure at Newmont – 12.5 years
• Bachelor of Science, Geological Engineering from Montana Tech
Nathan Bennett, Chief Engineer, Carlin
• Time in position – 4.5 years
• Total tenure at Newmont – 12 years
• Bachelor of Science, Mining Engineering from Colorado School of Mines; MBA from Weber State
University
Background on Carlin leadership
Dave Thornton, General Manager, Underground Operations
• Time in position – 4 months
• Total tenure at Newmont – 1.5 years
• Bachelor of Science, Mine Engineering from Western Australia School of Mines
William Newman, Engineer, Chief Mine, UG – Portal Mines
• Time in position – 2 years
• Total tenure at Newmont – 10.5 years
• Bachelor of Science, Mine Engineering from University of Nevada Reno
23. Newmont Mining Corporation I Nevada Site Tour I Slide 23September 2017
Background on Carlin leadership
Clinton Van Der Westhuizen, Manager, Carlin Process Operations
• Time in position – 2 years
• Total tenure at Newmont – 7.5 years
• Bachelor of Science, Chemical Engineering from the University of the Witwatersrand
Mike McGlynn, Chief Metallurgist, Carlin
• Time in position – 3 years
• Total tenure at Newmont – 6 years
• Bachelor of Metallurgical and Materials Engineering from Colorado School of Mines
Graden Colby, Mining Manager, Leeville
• Time in position – 3 months
• Total tenure at Newmont – 11 years
• Bachelor of Science, Mine Engineering from Colorado School of Mines
Tim Webber, Chief Engineer, Leeville
• Time in position – 1.5 years
• Total tenure at Newmont – 13 years
• Bachelor of Science, Mining Engineering from Colorado School of Mines; Master of Science,
Engineering & Technology Management
24. Newmont Mining Corporation I Nevada Site Tour I Slide 24September 2017
Strong operational performance and outlook
Phoenix
2015 2016 H1 2017 2017 Guidance1
Gold Production (Koz) 1,643 2,024 1,082 2,080 – 2,240
Gold CAS ($/oz) 758 702 688 675 – 725
Gold AISC2 ($/oz) 979 869 869 855 – 930
Copper Production (Kt) 21 19 9 10 – 20
Copper CAS ($/lb) 1.97 2.48 1.70 1.75 – 1.95
Copper AISC2 ($/lb) 2.30 2.88 2.05 2.20 – 2.40
Capital Expenditures* ($M) 545 419 141 280 – 360
* Capital Expenditures presented on an accrual basis
25. Newmont Mining Corporation I Nevada Site Tour I Slide 25September 2017
Carlin site details
Ownership: 100%
Located: West of Elko on the Carlin Trend
Operations: Four open pits and four underground mines
Process: High grade refractory ore processed through a roaster
(Mill 6); high grade oxide and transitional ore processed through
conventional milling, flotation and cyanide leaching at Mill 5, with
concentrates further treated at Mill 6 and Twin Creek’s Sage mill;
low grade material of suitable cyanide solubility treated by heap
leach
2016 Reserves5:
15.0 Moz Gold
2016 Resources*:
5.5 Moz Gold
Key statistics4
2015 2016 H1 2017 2017 Outlook1
Gold production (Koz) 886 944 432 935-1,000
Gold CAS ($/oz) $891 $844 $844 $775 - $825
Gold AISC ($/oz) $1,134 $1,048 $1,093 $980 - $1,040
Capex ($M) $270 $173 $96 $165 - $185
*Resource as used on the page includes measured and indicated (4.3Moz) and inferred (1.2Moz), and may not sum due to rounding. See Endnote 5 and slides 35 – 37.
26. Newmont Mining Corporation I Nevada Site Tour I Slide 26September 2017
Phoenix site details
Ownership: 100%
Located: Near the town of Battle Mountain
Operations: Phoenix open pit and Lone Tree
Process: Mill produces gravity gold concentrate and copper/gold
flotation concentrate, additional gold recovered from cyanide
leaching of flotation tails; copper leaching and solvent extraction
electro-winning (SXEW) facilities produce copper cathode; Lone
Tree consists of residual leaching operations and ongoing
reclamation
2016 Reserves:
4.4 Moz Gold
572 Ktonnes Copper
2016 Resources*:
3.5 Moz Gold
415 Ktonnes Copper
Key statistics 2015 2016 H1 2017 2017 Outlook1
Gold production (Koz) 205 209 111 200 – 220
Gold CAS ($/oz) $821 $802 $881 $875 - $925
Gold AISC ($/oz) $980 $937 $1,069 $1,070 - $1,130
Copper production (Kt) 21 19 9 10 – 20
Copper CAS ($/lb) $1.97 $2.48 $1.70 $1.75 - $1.95
Copper AISC ($/lb) $2.30 $2.88 $2.05 $2.20 - $2.40
Capex ($M) $25 $22 $10 $25 - $35
*Gold Resource as used on the page includes measured and indicated (2.7Moz) and inferred (0.8Moz), and may not sum due to rounding. Copper Resource as used on this page
includes measured and indicated (303Ktonnes) and inferred (113Ktonnes), and may not sum due to rounding. See Endnote 5 and slides 35 – 37.
27. Newmont Mining Corporation I Nevada Site Tour I Slide 27September 2017
Twin Creeks site details
Ownership: 100% Twin Creeks; 25% TRJV
Located: Located 35 miles northeast of Winnemucca
Operations: Open pit and Turquoise Ridge underground mine
Process: High grade refractory ore processed through the Sage
autoclaves; high grade oxide ore processed through conventional
milling and cyanide leaching at the Juniper mill; low grade
material of suitable cyanide solubility treated on heap leach pads
2016 Reserves:
4.9 Moz Gold
2016 Resources*:
4.1 Moz Gold
Key statistics 2015 2016 H1 2017 2017 Outlook1
Gold production (Koz) 471 453 205 370 – 400
Gold CAS ($/oz) $521 $514 $537 $560 - $610
Gold AISC ($/oz) $653 $613 $657 $675 - $725
Capex ($M) $48 $37 $17 $45 - $55
*Resource as used on the page includes measured and indicated (3.1Moz) and inferred (1.0Moz), and may not sum due to rounding. See Endnote 5 and slides 35 – 37.
28. Newmont Mining Corporation I Nevada Site Tour I Slide 28September 2017
Long Canyon site details
Ownership: 100%
Located: Located along the eastern flank of the Pequop
mountains in NE Nevada, Elko County
Operations: Surface
Process: Heap leach
2016 Reserves:
1.2 Moz Gold
2016 Resources*:
2.0 Moz Gold
Key statistics 2015 2016 H1 2017 2017 Outlook
Gold production (Koz) - 22 77 130 – 170
Gold CAS ($/oz) - $186 $325 $380 - $430
Gold AISC ($/oz) - $227 $351 $405 - $455
Capex ($M) $128 $119 $7 $10 - $20
*Resource as used on the page includes measured and indicated (1.6Moz) and inferred (0.4Moz), and may not sum due to rounding. See Endnote 5 and slides 35 – 37..
29. Newmont Mining Corporation I Nevada Site Tour I Slide 29September 2017
CC&V site details
Ownership: 100%
Located: Near the towns of Cripple Creek and Victor
Operations: 4 open pits
Process: Historically a valley leach facility; new 2Mtpa mill and
second valley leach commissioned
2016 Reserves:
3.4 Moz Gold
2016 Resources*:
2.5 Moz Gold
Key statistics 2015 2016 H1 2017 2017 Outlook1
Gold production (Koz) 81 396 257 420 – 470
Gold CAS ($/oz) $532 $553 $574 $560 - $610
Gold AISC ($/oz) $683 $621 $645 $680 - $730
Capex ($M) $66 $59 $8 $30 - $40
*Resource as used on the page includes measured and indicated (2.2Moz) and inferred (0.4Moz), and may not sum due to rounding. See Endnote 5 and slides 35 – 37.
30. Newmont Mining Corporation I Nevada Site Tour I Slide 30September 2017
Reserves and Resource base (R&R)
• Reserves: 0.2 Moz (1 Mt @ 6.6 g/t Au)
• Resource: 0.04 Moz (0.3 Mt @ 5.0g/t Au)
Upside Potential
• 60% of Inventory converted to R&R
• Mineralization over 2.3km strike length
Highlights
• 0.1 Moz Reserves additions in 2016
• Completion of successful test stoping
• Provides sulfide sulfur feed to Twin Creeks autoclave bringing forward high carbonate stockpile material
For graphics and mineralization representations please refer to Endnote 6. Resource as used on the page includes primarily inferred.
Twin Creeks develops Twin Underground
31. Newmont Mining Corporation I Nevada Site Tour I Slide 31September 2017
Reserves and Resource base (R&R)
• Reserves: 0.8 Moz (3 Mt @ 8.1 g/t Au)
• Resource: 0.3 Moz (2 Mt @ 6.1 g/t Au)
Upside Potential
• 45% of Inventory converted to R&R
• Half of +4.0km target drill tested
Highlights
• 0.1 Moz Reserves and 0.2 Moz Resource additions in 2016
• Larger than expected footwall intercepts
• First footwall stopes successfully mined
For graphics and mineralization representations please refer to Endnote 6. Resource base includes Exodus. Resource as used on the page includes measured and indicated (0.2 Moz) and
inferred (0.2 Moz), and may not sum due to rounding.
NW Exodus – growing into major high grade deposit
32. Newmont Mining Corporation I Nevada Site Tour I Slide 32September 2017
Reserves and Resource base (R&R)
• Reserves: 0.4 Moz (1.5 Mt at 7.9 g/t)
• Resource: 0.5 Moz (2.1 Mt at 7.4 g/t)
Upside Potential
• 20% of Inventory converted to R&R
• 3.0km by 1.0km corridor only partially drill tested
Highlights
• 0.2 Moz Reserves and 0.2 Moz Resource additions in 2016
• Extended mineralization around Rita K, Full House, Fence and Pete Bajo
• Drilling confirm mineralization on the Full House Deep Sensing Geochemistry NE trend 1.0 km to the N
For graphics and mineralization representations please refer to Endnote 6. Resource as used on the page includes measured and indicated. R&R base includes Pete Bajo, Full House and
Fence. Resource in the R&R base includes measured and indicated (0.2 Moz) and inferred (0.3 Moz).
Developing Carlin’s multimillion-ounce underground
33. Newmont Mining Corporation I Nevada Site Tour I Slide 33September 2017
CC&V – building long term value
Reserves and Resource base (R&R)
• Reserves: 3.4 Moz (129 Mt @ 0.8 g/t Au)
• Resource: 2.5 Moz (137 Mt @ 0.6 g/t Au)
Upside Potential
• Along vertical contacts and hydrothermal pipes
• Below current pits
Highlights
• 2016 drilling focused on Inventory: Mineralized zones below WHEX pit (up to 29m @ 2.6 g/t Au)
• Mineralization extended in the NE portion of WHEX pit (13.7m @ 5.5 g/t Au)
• Mineralization at favourable horizon between Globe Hill and WHEX pits (85m @ 1.2 g/t Au)
For graphics and mineralization representations please refer to Endnote 6. Resource as used on the page includes measured and indicated (2.2 Moz) and inferred (0.3 Moz).
34. Newmont Mining Corporation I Nevada Site Tour I Slide 34September 2017
Long Canyon – promising potential
Reserves and Resource base (R&R)
• Reserves: 1.2 Moz (17 Mt @ 2.1 g/t Au)
• Resource: 2.0 Moz (21 Mt @ 3.0 g/t Au)
Upside Potential
• 75% of Inventory converted to R&R
• Mineralization over 5.0km strike length
Highlights
• Reserves and Resource additions expected by 2018
• Additional Deep Sensing Geochemistry (DSG) providing guidance on the largely untested Eastern Zone
• Access to the Eastern zone in 2017
For graphics and mineralization representations please refer to Endnote 6. Resource as used on the page includes measured and indicated (1.6 Moz) and inferred (0.4 Moz).
35. Newmont Mining Corporation I Nevada Site Tour I Slide 35September 2017
North America Gold Reserves
1) See cautionary statement regarding reserves and resources on slide 42 hereof. 2016 reserves were calculated at a gold price of $1,200 or A$1,600 per ounce unless
otherwise noted. 2015 reserves were calculated at a gold price of $1,200 or A$1,500 per ounce unless otherwise noted.
2) Tonnages include allowances for losses resulting from mining methods. Tonnages are rounded to the nearest 100,000.
3) Ounces are estimates of metal contained in ore tonnages and do not include allowances for processing losses. Metallurgical recovery rates represent the estimated amount of
metal to be recovered through metallurgical extraction processes. Ounces are rounded to the nearest 10,000.
4) Cut-off grades utilized in 2016 reserves were as follows: oxide leach material not less than 0.21 grams per tonne; oxide mill material not less than 0.51 grams per tonne;
flotation material not less than 0.55 grams per tonne; and refractory mill material not less than 2.74 grams per tonne.
5) Stockpiles are comprised primarily of material that has been set aside to allow processing of higher grade material in the mills. Stockpiles increase or decrease depending on
current mine plans. Stockpile reserves are reported separately where ounces exceed 100,000 and are greater than 5% of the total site-reported reserves.
6) Cut-off grade utilized in 2016 reserves not less than 1.51 grams per tonne.
7) Gold cut-off grade varies with level of copper and silver credits.
8) Cut-off grade utilized in 2016 reserves not less than 0.21 grams per tonne.
9) Reserve estimates provided by Barrick, the operator of the Turquoise Ridge joint venture.
10) Cut-off grades utilized in 2016 reserves were as follows: oxide leach material not less than 0.21 grams per tonne; oxide mill material not less than 0.51 grams per tonne; and
refractory mill material not less than 1.17 grams per tonne.
11) Cut-off grade utilized in 2016 reserves not less than 0.24 grams per tonne.
12) Cut-off grades utilized in 2016 reserves were as follows: oxide mill material not less than 1.71 grams per tonne and leach material not less than 0.17 grams per tonne.
13) Leach pad material is the material on leach pads at the end of the year from which gold remains to be recovered. In-process reserves are reported separately where ounces
exceed 100,000 and are greater than 5% of the total site-reported reserves.
Attributable Proven, Probable, and Combined Gold Reserves(1), Metric Units
December 31, 2016 December 31, 2015
Proven Reserves Probable Reserves Proven and Probable Reserves
Metallurgical
Recovery(3) Proven + Probable Reserves
Deposits/Districts by Reporting
Unit Newmont Tonnage(2) Grade Gold(3) Tonnage(2) Grade Gold(3) Tonnage(2) Grade Gold(3) Tonnage(2) Grade Gold(3)
Share (x1000 tonnes) (g/tonne) (x1000 ozs)(x1000 tonnes) (g/tonne) (x1000 ozs)(x1000 tonnes) (g/tonne) (x1000 ozs) (x1000 tonnes) (g/tonne) (x1000 ozs)
North America
Carlin Open Pits(4) 100% 61,600 2.00 3,960 170,000 0.83 4,540 231,600 1.14 8,500 63% 234,300 1.24 9,350
Carlin Stockpiles (5) 100% 19,200 2.14 1,330 - - - 19,200 2.14 1,330 81% 20,700 2.01 1,330
Carlin Underground (6) 100% 10,900 10.25 3,580 6,000 8.24 1,590 16,900 9.53 5,170 85% 20,800 9.10 6,100
Total Carlin, Nevada 91,700 3.01 8,870 176,000 1.08 6,130 267,700 1.74 15,000 72% 275,800 1.89 16,780
Phoenix (7) 100% 4,400 0.86 120 228,400 0.57 4,220 232,800 0.58 4,340 76% 262,600 0.60 5,060
Lone Tree (8) 100% 2,300 0.25 20 1,100 0.68 20 3,400 0.39 40 57% 5,100 0.38 70
Total Phoenix, Nevada 6,700 0.65 140 229,500 0.57 4,240 236,200 0.58 4,380 76% 267,700 0.60 5,130
Turquoise Ridge (9) 25% 1,500 15.55 710 1,200 15.70 630 2,700 15.62 1,340 92% 2,900 15.31 1,400
Twin Creeks (10) 100% 3,300 1.57 180 23,800 1.85 1,410 27,100 1.82 1,590 77% 29,000 1.86 1,740
Twin Creeks Stockpiles (5) 100% 29,000 2.15 2,000 - - - 29,000 2.15 2,000 74% 32,300 2.19 2,280
Total Twin Creeks, Nevada 33,800 2.66 2,890 25,000 2.54 2,040 58,800 2.61 4,930 80% 64,200 2.62 5,420
Long Canyon, Nevada (11) 100% - - - 17,500 2.09 1,170 17,500 2.09 1,170 76% 16,300 2.28 1,200
CC&V (12) 100% 65,700 0.74 1,560 16,300 0.58 310 82,000 0.71 1,870 62% 91,500 0.83 2,440
CC&V Stockpiles (5) 100% 2,500 3.83 310 - - - 2,500 3.83 310 70% 2,500 2.88 230
CC&V Leach Pad (13) 100% - - - 44,000 0.86 1,210 44,000 0.86 1,210 57% 41,700 0.86 1,160
Total CC&V, Colorado 68,200 0.85 1,870 60,300 0.78 1,520 128,500 0.82 3,390 61% 135,700 0.88 3,830
TOTAL NORTH AMERICA 200,400 2.14 13,770 508,300 0.92 15,100 708,700 1.27 28,870 73% 759,700 1.32 32,360
36. Newmont Mining Corporation I Nevada Site Tour I Slide 36September 2017
North America Gold Resources
1) Resources are reported exclusive of reserves.
2) Resources are calculated at a gold price of $1,400 or A$1,750 per ounce for 2016. Tonnage amounts have been rounded to the nearest 100,000, and ounces have been
rounded to the nearest 10,000.
3) Measured and Indicated Resources (combined) are equivalent to Mineralized Material disclosed in Newmont’s 10-K filing.
4) Stockpiles are comprised primarily of mineralized material that has been set aside during mining activities. Stockpiles can increase or decrease depending on changes in
metal prices and other mining and processing cost and recovery factors. Stockpile reserves are reported separately where tonnage exceeds 100,000 and is greater than 5%
of the total site-reported resources.
5) Resource estimates provided by Barrick, the operator of the Turquoise Ridge Joint Venture.
Attributable Gold Mineral Resources(1)(2) - December 31, 2016, Metric units
Gold Measured Resource Gold Indicated Resource
Gold Measured + Indicated
Resource(3) Gold Inferred Resource
Deposits/Districts by Reporting Unit
Newmont
Share Tonnage Grade Au Tonnage Grade Au Tonnage Grade Au Tonnage Grade Au
(x1000 tonnes)(g/tonne)(x1000 ozs)(x1000 tonnes) (g/tonne)(x1000 ozs) (x1000 tonnes) (g/tonne) (x1000 ozs) (x1000 tonnes) (g/tonne)(x1000 ozs)
North America
Carlin Trend Open Pit 100% 30,700 1.69 1,670 60,300 1.01 1,950 91,000 1.24 3,620 12,600 0.93 380
Carlin Trend Underground 100% 800 6.90 180 2,100 7.93 540 2,900 7.64 720 3,000 8.05 780
Total Carlin, Nevada 31,500 1.82 1,850 62,400 1.24 2,490 93,900 1.44 4,340 15,600 2.29 1,160
Phoenix 100% 700 0.52 10 160,900 0.47 2,410 161,600 0.47 2,420 53,000 0.39 680
Phoenix Stockpiles (4) 100% - - - - - - - - - 2,100 1.48 100
Lone Tree Complex 100% - - - - - - - - - - - -
Buffalo Valley 70% - - - 14,100 0.65 290 14,100 0.65 290 400 0.38 -
Total Phoenix, Nevada 700 0.52 10 175,000 0.48 2,700 175,700 0.48 2,710 55,500 0.44 780
Twin Creeks 100% 1,000 2.48 80 27,600 2.12 1,890 28,600 2.14 1,970 15,100 1.49 720
Twin Creeks Stockpiles (4) 100% 7,000 2.02 460 - - - 7,000 2.02 460 - - -
Sandman 100% - - - 1,200 1.23 50 1,200 1.23 50 1,000 1.85 60
Turquoise Ridge (5) 25% 800 16.43 420 500 14.90 220 1,300 15.86 640 400 16.68 230
Total Twin Creeks, Nevada 8,800 3.37 960 29,300 2.29 2,160 38,100 2.54 3,120 16,500 1.91 1,010
Long Canyon, Nevada 100% 500 3.84 60 14,000 3.50 1,580 14,500 3.52 1,640 6,400 1.86 380
CC&V, Colorado 100% 76,100 0.60 1,470 39,200 0.56 710 115,300 0.59 2,180 21,600 0.50 350
TOTAL NORTH AMERICA 117,600 1.15 4,350 319,900 0.94 9,640 437,500 0.99 13,990 115,600 0.99 3,680
37. Newmont Mining Corporation I Nevada Site Tour I Slide 37September 2017
North America Copper Reserves and Resources
1) See footnote (1) to the Gold Reserves table above. Copper reserves for 2016 were calculated at a copper price of $2.50 or A$3.35 per pound. Copper reserves for 2015 were
calculated at a copper price of $2.75 or A$3.45 per pound unless otherwise noted.
2) See footnote (2) to the Gold Reserves table above. Tonnages are rounded to nearest 100,000.
3) See footnote (3) to the Gold Reserves table above.
4) Copper cut-off grade varies with level of gold and silver credits.
Attributable Copper Reserves(1) Metric Units
December 31, 2016 December 31, 2015
Proven Reserves Probable Reserves Proven + Probable Reserves Proven + Probable Reserve
Deposits/Districts by Reporting Unit
Newmont
Share Tonnage (2) Grade Copper (3) Tonnage (2) Grade Copper (3) Tonnage (2) Grade Copper (3) Metallurgical Tonnage (2) Grade Copper (3)
(x1000 tonnes) (Cu%) (Tonnes) (x1000 tonnes) (Cu%) (Tonnes) (x1000 tonnes) (Cu%) (Tonnes) Recovery (x1000 tonnes) (Cu%) (Tonnes)
North America
Phoenix, Nevada(4) 100% 17,200 0.21% 36,980 341,500 0.16% 535,480 358,700 0.16% 572,460 62% 478,400 0.17% 796,480
TOTAL NORTH AMERICA 17,200 0.21% 36,980 341,500 0.16% 535,480 358,700 0.16% 572,460 62% 478,400 0.17% 796,480
Attributable Copper Mineral Resources(1)(2) Metric Units
December 31, 2016
Measured Resources Indicated Resources Measured + Indicated Resources Inferred Resources
Deposits/Districts by Reporting Unit
Newmont
Share
Tonnage Grade Copper Tonnage Grade Copper Tonnage Grade Copper Tonnage Grade Copper
(x1000 tonnes) (Cu%) (tonnes) (x1000 tonnes) (Cu%) (tonnes) (x1000 tonnes) (Cu%) (tonnes) (x1000 tonnes) (Cu%) (tonnes)
North America
Phoenix, Nevada 100% 600 0.10% 680 232,500 0.13% 301,880 233,100 0.13% 302,560 79,000 0.14% 112,560
TOTAL NORTH AMERICA 600 0.10% 680 232,500 0.13% 301,880 233,100 0.13% 302,560 79,000 0.14% 112,560
1) Resources are reported exclusive of reserves. Measured and Indicated Resources (combined) are equivalent to Mineralized Material disclosed in Newmont’s Form 10-K filing.
2) Resources are calculated at a copper price of $3.00 or A$3.75 per pound for 2016 unless otherwise noted. Tonnage amounts have been rounded to the nearest 100,000.
38. Newmont Mining Corporation I Nevada Site Tour I Slide 38September 2017
Newmont has worked to develop a metric that expands on GAAP measures, such as cost of goods sold, and non-GAAP measures, such as Costs applicable to sales per ounce, to provide visibility into the economics of
our mining operations related to expenditures, operating performance and the ability to generate cash flow from our continuing operations.
Current GAAP-measures used in the mining industry, such as cost of goods sold, do not capture all of the expenditures incurred to discover, develop and sustain production. Therefore, we believe that all-in sustaining
costs is a non-GAAP measure that provides additional information to management, investors, and analysts that aid in the understanding of the economics of our operations and performance compared to other
producers and in the investor’s visibility by better defining the total costs associated with production.
All-in sustaining cost (“AISC”) amounts are intended to provide additional information only and do not have any standardized meaning prescribed by GAAP and should not be considered in isolation or as a substitute for
measures of performance prepared in accordance with GAAP. The measures are not necessarily indicative of operating profit or cash flow from operations as determined under GAAP. Other companies may calculate
these measures differently as a result of differences in the underlying accounting principles, policies applied and in accounting frameworks such as in International Financial Reporting Standards (“IFRS”), or by
reflecting the benefit from selling non-gold metals as a reduction to AISC. Differences may also arise related to definitional differences of sustaining versus development capital activities based upon each company’s
internal policies.
The following disclosure provides information regarding the adjustments made in determining the all-in sustaining costs measure:
Costs applicable to sales. Includes all direct and indirect costs related to current production incurred to execute the current mine plan. We exclude certain exceptional or unusual amounts from Costs applicable to
sales (“CAS”), such as significant revisions to recovery amounts. CAS includes by-product credits from certain metals obtained during the process of extracting and processing the primary ore-body. CAS is accounted
for on an accrual basis and excludes Depreciation and amortization and Reclamation and remediation, which is consistent with our presentation of CAS on the Condensed Consolidated Statements of Operations. In
determining AISC, only the CAS associated with producing and selling an ounce of gold is included in the measure. Therefore, the amount of gold CAS included in AISC is derived from the CAS presented in the
Company’s Condensed Consolidated Statements of Operations less the amount of CAS attributable to the production of copper at our Phoenix and Boddington mines. The copper CAS at those mine sites is disclosed
in Note 4 to the Condensed Consolidated Financial Statements. The allocation of CAS between gold and copper at the Phoenix and Boddington mines is based upon the relative sales value of gold and copper
produced during the period.
Reclamation costs. Includes accretion expense related to Asset Retirement Obligation (“ARO”) and the amortization of the related Asset Retirement Cost (“ARC”) for the Company’s operating properties. Accretion
related to the ARO and the amortization of the ARC assets for reclamation does not reflect annual cash outflows but are calculated in accordance with GAAP. The accretion and amortization reflect the periodic costs of
reclamation associated with current production and are therefore included in the measure. The allocation of these costs to gold and copper is determined using the same allocation used in the allocation of CAS
between gold and copper at the Phoenix and Boddington mines.
Advanced projects, research and development and exploration. Includes incurred expenses related to projects that are designed to increase or enhance current production and exploration. We note that as current
resources are depleted, exploration and advanced projects are necessary for us to replace the depleting reserves or enhance the recovery and processing of the current reserves. As this relates to sustaining our
production, and is considered a continuing cost of a mining company, these costs are included in the AISC measure. These costs are derived from the Advanced projects, research and
development and Exploration amounts presented in the Condensed Consolidated Statements of Operations less the amount attributable to the production of copper at our Phoenix and Boddington mines. The allocation
of these costs to gold and copper is determined using the same allocation used in the allocation of CAS between gold and copper at the Phoenix and Boddington mines.
General and administrative. Includes costs related to administrative tasks not directly related to current production, but rather related to support our corporate structure and fulfill our obligations to operate as a public
company. Including these expenses in the AISC metric provides visibility of the impact that general and administrative activities have on current operations and profitability on a per ounce basis.
Other expense, net. Includes certain administrative costs to support current gold production. We exclude certain exceptional or unusual expenses from Other expense, net, such as restructuring, as these are not
indicative to sustaining our current operations. Furthermore, this adjustment to Other expense, net is also consistent with the nature of the adjustments made to Net income (loss) attributable to Newmont stockholders
as disclosed in the Company’s non-GAAP financial measure Adjusted net income (loss). The allocation of these costs to gold and copper is determined using the same allocation used in the allocation of CAS between
gold and copper at the Phoenix and Boddington mines.
Treatment and refining costs. Includes costs paid to smelters for treatment and refining of our concentrates to produce the salable metal. These costs are presented net as a reduction of Sales on our Condensed
Consolidated Statements of Operations.
Sustaining capital. We determined sustaining capital as those capital expenditures that are necessary to maintain current production and execute the current mine plan. Capital expenditures to develop new operations,
or related to projects at existing operations where these projects will enhance production or reserves, are generally considered development. We determined the classification of sustaining and development capital
projects based on a systematic review of our project portfolio in light of the nature of each project. Sustaining capital costs are relevant to the AISC metric as these are needed to maintain the Company’s current
operations and provide improved transparency related to our ability to finance these expenditures from current operations. The allocation of these costs to gold and copper is determined using the same allocation used
in the allocation of CAS between gold and copper at the Phoenix and Boddington mines.
All-in sustaining costs
39. Newmont Mining Corporation I Nevada Site Tour I Slide 39September 2017
1) Excludes Depreciation and
amortization and Reclamation and
remediation.
2) Includes by-product credits of $29.
3) Includes stockpile and leach pad
inventory adjustments of $27 at
Carlin, $11 at Twin Creeks, $30 at
Yanacocha, $13 at Ahafo and $5 at
Akyem.
4) Reclamation costs include operating
accretion of $42 and amortization of
asset retirement costs of $17.
5) Advanced projects, research and
development and Exploration of $10
at Long Canyon, $5 at Ahafo, $8 at
Tanami, $5 at Yanacocha and $5 at
Akyem are recorded in “Other” of
the respective region for
development projects.
6) Other expense, net is adjusted for
restructuring and other costs of $8,
acquisition costs of $5 and write-
downs of $3.
7) Excludes development capital
expenditures, capitalized interest
and changes in accrued capital,
totaling $106. The following are
major development projects:
Merian, Long Canyon, Tanami
expansions, Subika Underground
and Ahafo mill expansion.
All-in sustaining costs
Advanced
Projects,
Research and Treatment All-In
Costs Development General Other and All-In Ounces Sustaining
Six Months Ended Applicable Reclamation and and Expense, Refining Sustaining Sustaining (000)/Pounds Costs per
June 30, 2017 to Sales (1)(2)(3)
Costs (4)
Exploration(5)
Administrative Net (6)
Costs Capital (7)
Costs (millions) Sold oz/lb
Gold
Carlin $ 363 $ 3 $ 8 $ 1 $ — $ — $ 95 $ 470 430 $ 1,093
Phoenix 89 3 4 — — 6 6 108 101 1,069
Twin Creeks 108 2 4 1 — — 17 132 201 657
Long Canyon 25 1 — — — — 1 27 77 351
CC&V 144 2 7 1 — — 8 162 251 645
Other North America — — 17 — 3 — 2 22 — —
North America 729 11 40 3 3 6 129 921 1,060 869
Yanacocha 253 32 7 2 3 — 20 317 268 1,183
Merian 112 — 8 — — — 8 128 228 561
Other South America — — 24 6 1 — — 31 — —
South America 365 32 39 8 4 — 28 476 496 960
Boddington 269 3 1 — — 9 26 308 395 780
Tanami 108 1 1 — — — 24 134 174 770
Kalgoorlie 107 1 3 — — — 8 119 174 684
Other Australia — — 11 4 — — 2 17 — —
Australia 484 5 16 4 — 9 60 578 743 778
Ahafo 136 3 11 — 2 — 19 171 183 934
Akyem 135 6 1 — 1 — 10 153 258 593
Other Africa — — 12 5 — — — 17 — —
Africa 271 9 24 5 3 — 29 341 441 773
Corporate and Other — — 26 93 5 — 3 127 — —
Total Gold $ 1,849 $ 57 $ 145 $ 113 $ 15 $ 15 $ 249 $ 2,443 2,740 $ 892
Copper
Phoenix $ 34 $ 1 $ — $ — $ — $ 1 $ 5 $ 41 20 $ 2.05
Boddington 49 1 — — — 6 3 59 38 1.55
Total Copper $ 83 $ 2 $ — $ — $ — $ 7 $ 8 $ 100 58 $ 1.72
Consolidated $ 1,932 $ 59 $ 145 $ 113 $ 15 $ 22 $ 257 $ 2,543
40. Newmont Mining Corporation I Nevada Site Tour I Slide 40September 2017
All-in sustaining costs
1) Excludes Depreciation and amortization and
Reclamation and remediation.
2) Includes by-product credits of $50.
3) Includes stockpile and leach pad inventory
adjustments of $117 at Yanacocha, $77 at
Carlin, $71 at Ahafo and $18 at Twin
Creeks. Total stockpile and leach pad
inventory adjustments at Yanacocha of $151
were adjusted above by $32 related to a
significant write-down of recoverable ounces
at the La Quinua Leach Pad in the third
quarter of 2016.
4) Reclamation costs include operating
accretion of $75 and amortization of asset
retirement costs of $31.
5) Other expense, net is adjusted for
restructuring and other costs of $32 and
acquisition costs of $10.
6) Excludes development capital expenditures,
capitalized interest, and the increase in
accrued capital, totaling $555. The following
are major development projects during the
period: Merian, Long Canyon and the CC&V
and Tanami expansions.
7) Advanced Projects, Research and
Development and Exploration incurred at
Long Canyon prior to reaching commercial
production in November 2016 of $20 is
included in Other North America.
8) Advanced Projects, Research and
Development and Exploration incurred at
Merian prior to reaching commercial
production in October 2016 of $21 is
included in Other South America.
Advanced
Projects,
Research and Treatment All-In
Costs Development General Other and All-In Ounces Sustaining
Years Ended Applicable Reclamation and and Expense, Refining Sustaining Sustaining (000)/Pounds Costs per
December 31, 2016 to Sales (1)(2)(3)
Costs (4)
Exploration Administrative Net (5)
Costs Capital (6)
Costs (millions) Sold oz/lb
Gold
Carlin $ 797 $ 5 $ 19 $ 5 $ — $ — $ 163 $ 989 944 $ 1,048
Phoenix 164 5 1 1 1 8 12 192 205 937
Twin Creeks 234 3 8 1 — — 33 279 455 613
Long Canyon (7)
4 — — — — — 1 5 22 227
CC&V 216 4 11 2 — — 10 243 391 621
Other North America — — 32 — 5 — 7 44 — —
North America 1,415 17 71 9 6 8 226 1,752 2,017 869
Yanacocha 493 57 35 7 — — 82 674 637 1,058
Merian (8)
34 — 3 — — — — 37 99 374
Other South America — — 57 6 — — — 63 — —
South America 527 57 95 13 — — 82 774 736 1,052
Boddington 530 6 1 — — 22 51 610 787 775
Tanami 238 3 13 — — — 85 339 459 739
Kalgoorlie 257 5 5 — — 7 19 293 378 775
Other Asia Pacific — — 8 15 5 — 6 34 — —
Asia Pacific 1,025 14 27 15 5 29 161 1,276 1,624 786
Ahafo 313 6 28 — 1 — 54 402 349 1,152
Akyem 235 8 8 — 1 — 24 276 473 584
Other Africa — — 2 5 — — — 7 — —
Africa 548 14 38 5 2 — 78 685 822 833
Corporate and Other — — 51 190 3 — 10 254 — —
Total Gold $ 3,515 $ 102 $ 282 $ 232 $ 16 $ 37 $ 557 $ 4,741 5,199 $ 912
Copper
Phoenix $ 99 $ 3 $ — $ 1 $ — $ 3 $ 9 $ 115 40 $ 2.88
Boddington 126 1 — — — 13 12 152 76 2.00
Total Copper $ 225 $ 4 $ — $ 1 $ — $ 16 $ 21 $ 267 116 $ 2.30
Consolidated $ 3,740 $ 106 $ 282 $ 233 $ 16 $ 53 $ 578 $ 5,008
41. Newmont Mining Corporation I Nevada Site Tour I Slide 41September 2017
All-in sustaining costs
1) Excludes Depreciation and amortization and
Reclamation and remediation.
2) Includes by-product credits of $45.
3) Includes stockpile and leach pad inventory
adjustments of $116 at Carlin, $14 at Twin
Creeks, $77 at Yanacocha and $19 at
Boddington.
4) Reclamation costs include operating
accretion of $74 and amortization of asset
retirement costs of $74.
5) Other expense, net is adjusted for
restructuring costs and other of $34, the
Ghana Investment Agreement payment of
$27 and acquisition costs of $19.
6) Excludes development capital expenditures,
capitalized interest, and the decrease in
accrued capital, totaling $663. The following
are major development projects during the
period: Turf Vent Shaft, Merian, Long
Canyon and the CC&V expansion project.
7) The Company acquired the CC&V gold
mining business on August 3, 2015.
8) Advanced Projects, Research and
Development and Exploration incurred at
Long Canyon of $22 is included in Other
North America.
9) Advanced Projects, Research and
Development and Exploration incurred at
Merian of $12 were previously included in
Corporate and Other is included in Other
South America.
10) On October 29, 2015, the Company sold the
Waihi mine.
Advanced
Projects,
Research and Treatment All-In
Costs Development General Other and All-In Ounces Sustaining
Years Ended Applicable Reclamation and and Expense, Refining Sustaining Sustaining (000)/Pounds Costs per
December 31, 2015 to Sales (1)(2)(3)
Costs (4)
Exploration Administrative Net (5)
Costs Capital (6)
Costs (millions) Sold oz/lb
Gold
Carlin $ 790 $ 4 $ 16 $ 7 $ — $ — $ 188 $ 1,005 886 $ 1,134
Phoenix 163 4 2 2 1 8 15 195 199 980
Twin Creeks 246 4 8 2 2 — 47 309 473 653
CC&V (7)
44 2 3 — — — 7 56 82 683
Other North America (8)
— — 30 — 3 — 8 41 — —
North America 1,243 14 59 11 6 8 265 1,606 1,640 979
Yanacocha 564 97 37 15 3 — 97 813 924 880
Other South America (9)
— — 58 4 2 — — 64 — —
South America 564 97 95 19 5 — 97 877 924 949
Boddington 570 9 2 — — 24 47 652 816 799
Tanami 225 3 7 1 — — 78 314 434 724
Waihi (10)
55 2 3 — — — 3 63 116 543
Kalgoorlie 272 5 3 1 — 5 21 307 318 965
Other Asia Pacific — — 5 17 14 — 6 42 — —
Asia Pacific 1,122 19 20 19 14 29 155 1,378 1,684 818
Ahafo 206 7 24 1 1 — 57 296 332 892
Akyem 212 6 8 — — — 44 270 472 572
Other Africa — — 2 9 — — — 11 — —
Africa 418 13 34 10 1 — 101 577 804 718
Corporate and Other — — 72 181 10 — 10 273 — —
Total Gold $ 3,347 $ 143 $ 280 $ 240 $ 36 $ 37 $ 628 $ 4,711 5,052 $ 933
Copper
Phoenix $ 91 $ 3 $ 1 $ 1 $ — $ 3 $ 9 $ 108 47 $ 2.30
Boddington 140 2 1 — — 15 11 169 82 2.06
Total Copper $ 231 $ 5 $ 2 $ 1 $ — $ 18 $ 20 $ 277 129 $ 2.15
Consolidated $ 3,578 $ 148 $ 282 $ 241 $ 36 $ 55 $ 648 $ 4,988
42. Newmont Mining Corporation I Nevada Site Tour I Slide 42September 2017
Endnotes
Investors are encouraged to read the information contained in this presentation in conjunction with the following notes, the Cautionary Statement on slide 2 and the factors described under the
“Risk Factors” section of the Company’s Form 10-K, filed with the SEC on or about February 21, 2017, and Form 10-Q filed with the SEC on July 25, 2017, and disclosure in the Company’s
other recent SEC filings.
1. Outlook projections used in this presentation are considered forward-looking statements and represent management’s good faith estimates or expectations of future production results as
of July 25, 2017. Outlook is based upon certain assumptions, including, but not limited to, metal prices, oil prices, certain exchange rates and other assumptions. For example, 2017
Outlook assumes $1,200/oz Au, $2.50/lb Cu, $0.75 USD/AUD exchange rate and $55/barrel WTI; AISC and CAS estimates do not include inflation, for the remainder of the year.
Production, AISC and capital estimates exclude projects that have not yet been approved. The potential impact on inventory valuation as a result of lower prices, input costs, and project
decisions are not included as part of this Outlook. Assumptions used for purposes of Outlook may prove to be incorrect and actual results may differ materially from those anticipated.
Consequently, Outlook cannot be guaranteed. As such, investors are cautioned not to place undue reliance upon Outlook and forward-looking statements as there can be no assurance
that the plans, assumptions or expectations upon which they are placed will occur.
2. Historical AISC or All-in sustaining cost is a non-GAAP metric. See slides 38 to 41 for more information and a reconciliation to the nearest GAAP metric. All-in sustaining cost (“AISC”) as
used in the Company’s Outlook is a non-GAAP metric defined as the sum of cost applicable to sales (including all direct and indirect costs related to current gold production incurred to
execute on the current mine plan), reclamation costs (including operating accretion and amortization of asset retirement costs), G&A, exploration expense, advanced projects and R&D,
treatment and refining costs, other expense, net of one-time adjustments and sustaining capital. See also note 1 above.
3. Full Potential cost savings or Full Potential improvements as used in this presentation are considered operating measures provided for illustrative purposes, and should not be considered
GAAP or non-GAAP financial measures. Global Full Potential savings/improvements amounts are estimates utilized by management that represent estimated cumulative incremental
value realized as a result of Full Potential projects implemented and are based upon both cost savings and efficiencies that have been monetized for purposes of the estimation. Because
Full Potential savings/improvements estimates reflect differences between certain actual costs incurred and management estimates of costs that would have been incurred in the absence
of the Full Potential program, such estimates are necessarily imprecise and are based on numerous judgments and assumptions.
4. Key statistics included on slides 25-29 in the Appendix represent attributable production, consolidated unit CAS and AISC, and consolidated total capital expenditures on an accrual basis.
5. Reserves and Resources included on slides 25-29 in the Appendix represent Proven and Probable Reserves, Measured and Indicated and Inferred Resources. See also note 6 below.
6. U.S. investors are reminded that reserves were prepared in compliance with Industry Guide 7 published by the SEC. Whereas, the term resource, measured resource, indicated
resources and inferred resources are not SEC recognized terms. Newmont has determined that such resources would be substantively the same as those prepared using the Guidelines
established by the Society of Mining, Metallurgy and Exploration and defined as Mineral Resource. Estimates of resources are subject to further exploration and development, are subject
to additional risks, and no assurance can be given that they will eventually convert to future reserves. Inferred resources, in particular, have a great amount of uncertainty as to their
existence and their economic and legal feasibility. Investors are cautioned not to assume that any part or all of the inferred resource exists, or is economically or legally mineable.
Inventory and upside potential have a greater amount of uncertainty. Investors are cautioned that drill results illustrated in certain graphics in this presentation are not necessarily
indicative of future results or future production. Even if significant mineralization is discovered and converted to reserves, during the time necessary to ultimately move such mineralization
to production the economic and legal feasibility of production may change. As such, investors are cautioned against relying upon those estimates. For more information regarding the
Company’s reserves, see the Company’s Annual Report filed with the SEC on February 21, 2017 for the Proven and Probable reserve tables prepared in compliance with the SEC’s
Industry Guide 7, which is available at www.sec.gov or on the Company’s website. Investors are further reminded that the reserve and resource estimates used in this presentation are
estimates as of December 31, 2016. See slides 35 – 37 for Reserves and Resource tables.
Tour participants are reminded that the cautionary note on slide 2 and the endnotes listed above on this slide should also be considered in connection with the poster board presentation at the
tour stops, which follows.
44. Newmont Mining Corporation I Nevada Site TourSeptember 2017
North America overview
Clear strategic priorities set to safely improve value
• Step change in underlying safety culture and performance
• Arresting unit cost increases and improving commercial culture
• Harnessing fit-for-purpose technology to enhance productivity & sustainability
• Delivering efficiencies by operating assets as an integrated business
• Adding value-accretive reserves to secure a robust long-term profile
• Improving leadership effectiveness, succession planning and diversity
• Leveraging stakeholder relationships to benefit value and risk management
45. Newmont Mining Corporation I Nevada Site TourSeptember 2017
Long Canyon Phase 1
Delivered on time and below budget – value exceeds business case
How we got started
• Business case ~17% IRR*
• Feb 2015 – funding approved
• May 2016 – first ore on heap leach
• Nov 2016 – commercial production
Where we are now
• Current case >26% IRR*
• Zero harm to date
• Exceeding cost and production targets
• Strong sustainability performance
Waste Rock Facility
Long Canyon Pit
Pit Overview
Carbon in Column Plant
Truck Shop
Administration
Building
Geo/
Exploration
Leach Pad
Opportunities
• Full Potential improvements progressing on several fronts
− Mine: reduced sample, haulage optimization, pit re-sequencing
− Plant: lime and cyanide optimization, leach pad modeling software
* IRRs stated at $1200/oz gold
46. Newmont Mining Corporation I Nevada Site TourSeptember 2017
Long Canyon Phase 2
Next phase develops deeper extensions and reaches below water table
Stage 1 – scoping:
• Open pit (OP) expansion
• Start of underground (UG)
• Continued heap leaching
• Potential for small oxide mill
• Power supply options
• Phase 2 production split
between open pit and
underground
• Development in early 2020s
Phase 1 Pit
Phase 2 Pit
Phase 2 UG Stopes
UG gold shapes not in plan
Sustainability considerations
• Managing regional water impacts
• Optimizing power supply
• Protecting native fish species
• Strong stakeholder engagement
• Positive permitting track record
Opportunities
• Optimizing the business case – capital,
schedule, production, costs
• Leveraging existing personnel and
infrastructure
• Accelerating Reserve & Resource
addition via UG drilling platforms
47. Newmont Mining Corporation I Nevada Site TourSeptember 2017
Long Canyon district potential
Realizing the investment case
• Reserves and Resources of 3.2*Moz - with strong exploration upside
• Numerous district targets; active exploration focused on most prospective
• Phase 2 surface/UG; East Zone; additional NE UG zones
• Mineralization open in all directions
• Phase 2 surface/UG allows transition to Phase 3/4 UG
*Comprising 1.17 Moz Proven & Probable Reserves of 17.5 Mt at 2.09 g/t; Resources are 1.64 Moz Measured &
Indicated of 14.5 Mt at 3.52 g/t and 0.38 Moz Inferred of 6.4 Mt at 1.86 g/t; Please refer to Endnote 6
48. Newmont Mining Corporation I Nevada Site TourSeptember 2017
Long Canyon district potential
Leveraging Newmont’s exploration expertise
• Targeting leverages expertise in geophysics, geochemistry and geologic modeling
• Drilling in-progress or planned for all perimeter and outboard targets
• Current mineralization over 5 km with additional drilling planned for NE extensions
Phase 2 – the bridge to the future
Developing regional targets
49. Newmont Mining Corporation I Nevada Site TourSeptember 2017
Mining overview
Vital Statistics
Phase 1 pit bottom (meters) 1,737
Permitted area (acres) 3,380
Employees 250
Current mine life 2021
Current process life 2024
Concurrent reclamation ongoing
CAT Minestar fleet dispatch
DSS fatigue monitoring
Equipment condition monitoring
12 CAT 793 haul trucks
2 Hitachi EX3600 shovels
4 Atlas Copco DML drills
Equipment
Mining H1-2017
Total open pit (Mtonnes) 15.9
Leach (Mtonnes) 2.3
Waste (Mtonnes) 13.7
Production (Koz) 77
LOM grade (g/t) 2.09
LOM strip ratio 7.5:1
52. Newmont Mining Corporation I Nevada Site TourSeptember 2017
Carlin overview
Region’s largest operating complex operating profitably since 1965
Overview
• 3 open pit (OP) mines
• 4 underground (UG) mines
• Mill 5 – medium grade and transitional ore
• Mill 6 – high grade refractory ore
• Heap leach – lower grade ore
• Superior land position – 250k acres
• Innovative ground control solutions
Opportunities
• Ongoing Full Potential improvements
− Mine planning and ore control
− Processing efficiency and CC&V cons
− Autonomous/remote operations
− Centralized asset health monitoring
• Profitable growth
− UG (e.g., NW Exodus) and laybacks
53. Newmont Mining Corporation I Nevada Site TourSeptember 2017
Mining overview
Vital Statistics
Permitted area (acres) 33,554
Employees 2,028
Current mine life 2028
Current process life 2035
Concurrent reclamation ongoing
CAT Minestar fleet dispatch
DSS fatigue monitoring
3 Loaders
53 Haul trucks
6 Shovels
9 Drills
Equipment
Mining H1-2017
Total (Mtonnes) 39.2
Leach (Mtonnes) 12.5
Waste (Mtonnes) 25.2
Production (Koz) 432
LOM grade (g/t) 1.12
LOM strip ratio 3:1
54. Newmont Mining Corporation I Nevada Site TourSeptember 2017
Processing overview
Refractory
(Surface/UG)
FlotationOxide
Oxide Flotation
Refractory
(Surface/UG)
Mill 5 Mill 6
Sage
Mill
(Twin
Creeks)
North
Area
Leach
South
Area
Leach
Concentrates
Oxide
Emigrant
Leach
CARLIN NORTH AREA
(Star Complex, East Carlin, Leeville, Exodus, Pete Bajo)
CARLIN SOUTH AREA
(Gold Quarry, Chukar)
EMIGRANT
~20%
~20%~60%
Leach Mill 5 Mill 6
Production by process (Koz)
Vital Statistics H1 2017 Mill 5 Mill 6
Leach ore to pad (Mtonnes)
Mill throughput (Mtonnes) 2.1 1.5
Feed grade (g/t) 1.5 7.1
Recovery 49% 86%
Plant availability 94% 85%
12.5
55. Newmont Mining Corporation I Nevada Site TourSeptember 2017
Mill 5 concentrate production
Mill 5 is a flotation plant which produces gold-containing sulfide-sulfur
concentrate, which is fuel for the roaster (Mill 6) and the autoclave (Twin
Creeks)
Flotation plant improvement
• Flotation plant commissioned in 2005
• Plant output reached a ceiling in 2008-09; more concentrate was needed
• Filter Plant Expansion was completed in Q1/2011
• Concentrate production has steadily increased
Current Full Potential projects
• Upgrade Visiofroth Flotation Control
• Inert Gas Flotation
– Based on Newmont’s N2TEC flotation technology
– Plant trials showing promising results with N2/CO2 blend
– Determining business case for future implementation
Nine years of continuous improvement
56. Newmont Mining Corporation I Nevada Site TourSeptember 2017
Mill 6 continues to outperform
History
• Plant Design: 2.4 Mtonnes
• 2016 Production: 3.0 Mtonnes
Ongoing Improvements
• Grinding Improvements
• Crushing (Size Camera –
Equipment)
• Grit chute
• Fan
Future Full Potential Projects
• Calcine Coolers throughput
• Resolve quench system scaling
• Increase oxygen plant capacity
• Modify permits for throughput and
fan capacity
A history of continuous improvement since start-up
0.0
0.5
1.0
1.5
2.0
2.5
3.0
3.5
1995
1996
1997
1998
1999
2000
2001
2002
2003
2004
2005
2006
2007
2008
2009
2010
2011
2012
2013
2014
2015
2016
MTonnes
Mill 6 Throughput
58. Newmont Mining Corporation I Nevada Site TourSeptember 2017
Mining overview – underground
PITRAM dispatch system
18 Loaders (total)
4 Semi-autonomous loaders
24 Haul trucks
7 Production drills
17 Bolters
7 Jumbos
Equipment
Vital Statistics FY 2016
Total Employees 800
Mine Life 2028
UG drift (Km) 229
FY 2016 H1 2017
Ore (Mtonnes) 2.4 1.2
Waste (Mtonnes) 1.2 0.7
Production (Koz) 540 276
Average grade (g/t) 8.5 8.7
Development (Km) 25 13
Backfill (Mtonnes) 2.0 1.0
59. Newmont Mining Corporation I Nevada Site TourSeptember 2017
Full Potential – Carlin UG
Example – Leeville used Full Potential to focus on underground
development and contract mining spending
• In the last 12 months (Sep 2016 to Aug 2017), Newmont increased self-
performed development rates by 33%
• Reduction in contractor development and associated spending
• Expected 2017 total annual savings ~$20 million
60. Newmont Mining Corporation I Nevada Site TourSeptember 2017
Northwest Exodus progressing on track
Key to growth strategy
• Extends mine life by 7+ years
• Improves Carlin AISC
• ~90% complete by end of 2017
• Revision to mine plan advances ore
into 2017 and improves Mill 6 feed
Opportunities
• Expansion in multiple directions
• Drifting and drilling planned for 2018
Fans commissioned – designed for autonomous equipment
Ventilation
shaft complete
February 2017
NW Exodus
decline
Exodus
decline
mineralized
footprint
61. Newmont Mining Corporation I Nevada Site TourSeptember 2017
Mine monitoring & control – Carlin UG
Semi–autonomous equipment
• Significant safety, ergonomics, and health improvements
• 10-20% productivity gains
• Reduction in equipment & drift damage
Loading
Technology – looking forward
• Semi-autonomous drilling
• Fleet / Task Management Systems
• Assisted-Guidance Haulage
• Ventilation-on-Demand
• Underground Asset Health
• Centralized control stations
Successful Pilot trials
• NW Exodus designed & setup to
accommodate semi-autonomous
operations
• Successfully operated from the surface
• Successfully operated two machines
with one operator
• Transitioning Leeville to Semi-
Autonomous stope production
62. Newmont Mining Corporation I Nevada Site TourSeptember 2017
Leeville rehabilitation nearly complete
Predictive approach to challenging geotechnical issues
• Drilling data reinterpreted to better predict conditions, requirements
• Updated mining methods, designs, and sequence
• Installed micro seismic monitoring system
Leading in innovation
• Designed and implemented long-term ground support systems
• Designed and developed new Nevada bolts (Newmont patent)
• New coating developed for inflatable bolts
• Cable bolts and mechanized cable bolter
• Developing new resin injection system; next step – mechanization
• SchoGun Head (Newmont patent)
What’s next
• ~14 miles of rehabilitation completed; backlog complete in Q3 2017
• New structural geology models under development
• Ongoing monitoring and maintenance
63. Newmont Mining Corporation I Nevada Site TourSeptember 2017
Carlin Trend potential
Developing the next generation of underground operations
Rita-K /Pete Bajo
• Carlin’s next multi-million ounce underground
Northwest Exodus
• Developing a major high grade deposit
Leeville
• Mineralization remains open
64. Newmont Mining Corporation I Nevada Site TourSeptember 2017
• **Reserves: 0.8 Moz (3.2 Mt @ 8.1 g/t Au); Resource: 0.3 Moz (1.7 Mt @ 6.1 g/t Au)
• 0.1 Moz Reserves and 0.2 Moz Resource additions in 2016
• 45% of Inventory converted to R&R; half of +4.0km target drill tested
NW Exodus – growing into major high grade deposit
Next generation UG resource
Developing the next multimillion-ounce underground
• *Reserves: 0.4 Moz (1.5 Mt at 7.9 g/t); Resource: 0.5 Moz (2.1 Mt at 7.4 g/t)
• 0.2 Moz Reserves and 0.2 Moz Resource additions in 2016
• Extended mineralization around Rita K, Full House, Fence and Pete Bajo
For graphics and mineralization representations please refer to Endnote 6
*Reserves & Resources for Pete Bajo, Full House and Fence. Resource represents measured & indicated (0.2Moz) and inferred (0.3Moz)
**Represents Reserves & Resources for Exodus complexder