Download to read offline

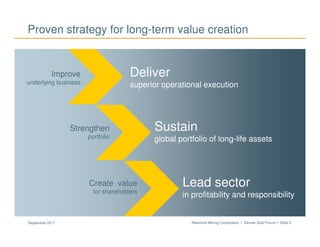
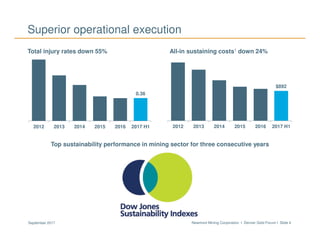
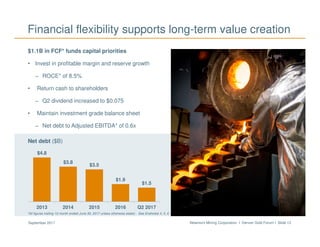
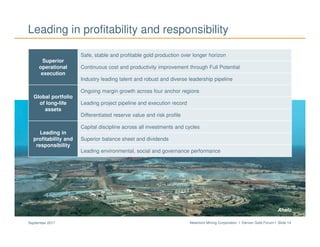
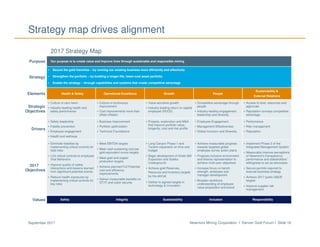

Gary Goldberg, President and CEO of Newmont Mining Corporation, presented at the Denver Gold Forum in September 2017. The presentation covered Newmont's strategy of improving its underlying business through superior operational execution, strengthening its global portfolio of long-life assets, and creating value for shareholders by leading the sector in profitability and responsibility. It highlighted Newmont's industry-leading safety and cost improvement performance, profitable growth projects, top-tier reserves, and financial flexibility.


