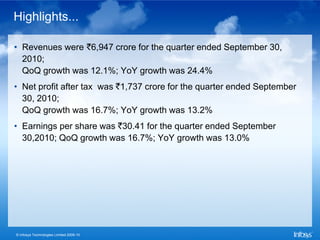
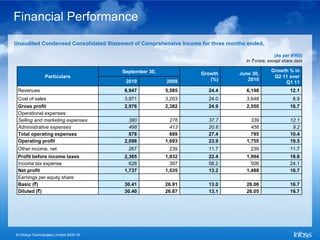
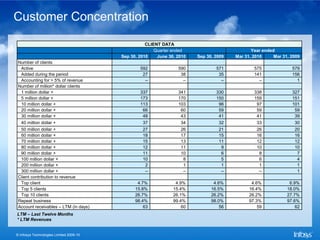
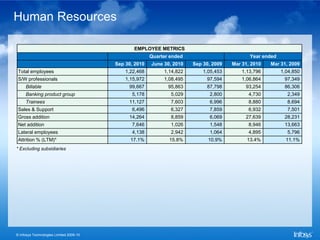
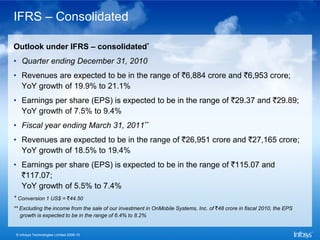
Performance for the
                                         Second Quarter ended
                                          September 30, 2010
                                           S. Gopalakrishnan              S. D. Shibulal
                                           Chief Executive Officer and   Chief Operating Officer
                                               Managing Director              and Director


© Infosys Technologies Limited 2009-10
Safe Harbour

Certain statements in this release concerning our future growth prospects are forward-looking
statements, which involve a number of risks and uncertainties that could cause actual results to
differ materially from those in such forward-looking statements. The risks and uncertainties relating
to these statements include, but are not limited to, risks and uncertainties regarding fluctuations in
earnings, our ability to manage growth, intense competition in IT services including those factors
which may affect our cost advantage, wage increases in India, our ability to attract and retain
highly skilled professionals, time and cost overruns on fixed-price, fixed-time frame contracts, client
concentration, restrictions on immigration, industry segment concentration, our ability to manage
our international operations, reduced demand for technology in our key focus areas, disruptions in
telecommunication networks or system failures, our ability to successfully complete and integrate
potential acquisitions, liability for damages on our service contracts, the success of the companies
in which Infosys has made strategic investments, withdrawal of governmental fiscal incentives,
political instability and regional conflicts, legal restrictions on raising capital or acquiring companies
outside India, and unauthorized use of our intellectual property and general economic conditions
affecting our industry. Additional risks that could affect our future operating results are more fully
described in our United States Securities and Exchange Commission filings including our Annual
Report on Form 20-F for the fiscal year ended March 31, 2010 and on Form 6-K for the quarter
ended June 30, 2010.These filings are available at www.sec.gov. Infosys may, from time to time,
make additional written and oral forward-looking statements, including statements contained in the
company's filings with the Securities and Exchange Commission and our reports to shareholders.
The company does not undertake to update any forward-looking statements that may be made
from time to time by or on behalf of the company.

© Infosys Technologies Limited 2009-10
Agenda

• Financial Performance
• Operational Performance
• Client Acquisition & Expansion of Services
• Products and Platforms
• Infosys BPO
• Human Resources
• Infrastructure
• Outlook
• Summary


© Infosys Technologies Limited 2009-10
Financial Performance


© Infosys Technologies Limited 2009-10
Highlights...

• Revenues were `6,947 crore for the quarter ended September 30,
  2010;
  QoQ growth was 12.1%; YoY growth was 24.4%
• Net profit after tax was `1,737 crore for the quarter ended September
  30, 2010;
  QoQ growth was 16.7%; YoY growth was 13.2%
• Earnings per share was `30.41 for the quarter ended September
  30,2010; QoQ growth was 16.7%; YoY growth was 13.0%


© Infosys Technologies Limited 2009-10
...Highlights

• 27 clients were added during the quarter by Infosys and its subsidiaries
• Gross addition of 14,264 employees (net addition of 7,646) for the
  quarter by Infosys and its subsidiaries
• 1,22,468 employees as on September 30, 2010 for Infosys and its
  subsidiaries
• Declared an interim dividend of `10 per share and a 30th year special
  dividend of `30 per share (Previous year interim dividend of `10 per
  share). The record date for the payment of dividend is
  October 22, 2010.


© Infosys Technologies Limited 2009-10
Financial Performance
Unaudited Condensed Consolidated Statement of Comprehensive Income for three months ended,

                                                                                                  (As per IFRS)
                                                                                   In ` crore, except share data

                                         September 30,                                         Growth % in
                                                                   Growth        June 30,
                 Particulars                                                                    Q2 11 over
                                          2010           2009         (%)           2010
                                                                                                    Q1 11
 Revenues                                6,947           5,585        24.4         6,198                 12.1
 Cost of sales                           3,971           3,203        24.0         3,648                   8.9
 Gross profit                            2,976           2,382        24.9         2,550                 16.7
 Operational expenses:
 Selling and marketing expenses            380             276        37.7           339                 12.1
 Administrative expenses                   498             413        20.6           456                  9.2
 Total operating expenses                  878             689        27.4           795                 10.4
 Operating profit                        2,098           1,693        23.9         1,755                 19.5
 Other income, net                         267            239         11.7           239                 11.7
 Profit before income taxes              2,365           1,932        22.4         1,994                 18.6
 Income tax expense                        628             397        58.2           506                 24.1
 Net profit                              1,737           1,535        13.2         1,488                 16.7
 Earnings per equity share
 Basic (`)                               30.41           26.91        13.0         26.06                 16.7
 Diluted (`)                             30.40           26.87        13.1         26.05                 16.7


© Infosys Technologies Limited 2009-10
Operational Performance


© Infosys Technologies Limited 2009-10
Region wise Revenue

                                         REVENUE BY GEOGRAPHICAL SEGMENT

                                                        Quarter ended                             LTM
                                         Sep 30, 2010    June 30, 2010   Sep 30, 2009   Sep 30, 2010    Sep 30, 2009
                                                   %                %              %              %               %
 North America                                   65.8             67.3           65.9           66.4            64.9
 Europe                                          21.8             20.3           23.2           21.6            24.4
 India                                            2.1              1.7            1.2            1.6             1.2
 Rest of the world                               10.3             10.7            9.7           10.4             9.5
 Total                                         100.0            100.0          100.0          100.0           100.0


© Infosys Technologies Limited 2009-10
Effort and Utilization

                                                   EFFORT AND UTILIZATION
                                                      Quarter ended                              LTM
                                         Sep 30, 2010   June 30, 2010   Sep 30, 2009   Sep 30, 2010    Sep 30, 2009
                                                   %               %              %              %               %
 Effort
   Onsite                                        24.5            22.9           22.6           23.2            22.9
  Offshore                                       75.5            77.1           77.4           76.8            77.1
 Utilization
   Including trainees                            74.3            73.0           67.3           71.4            67.6
   Excluding trainees                            81.2            78.7           73.2           78.4            73.2


© Infosys Technologies Limited 2009-10
Revenues by Project type

                                               REVENUE BY PROJECT TYPE*
                                                        Quarter ended                             LTM
                                         Sep 30, 2010    June 30, 2010   Sep 30, 2009   Sep 30, 2010    Sep 30, 2009
                                                   %                %              %              %               %
 Fixed price                                     39.9             39.0           38.0           39.2            37.7
 Time & materials                                60.1             61.0           62.0           60.8            62.3
 Total                                         100.0            100.0          100.0          100.0           100.0

* Excluding products


© Infosys Technologies Limited 2009-10
Onsite-Offshore Revenue split

                                                        Quarter ended                             LTM
                                         Sep 30, 2010    June 30, 2010   Sep 30, 2009   Sep 30, 2010    Sep 30, 2009
                                                   %                %              %              %               %
 Revenue
   Onsite                                        50.2             48.0           46.0           47.7            46.1
   Offshore                                      49.8             52.0           54.0           52.3            53.9


© Infosys Technologies Limited 2009-10
Customer Concentration

                                                    CLIENT DATA
                                                        Quarter ended                          Year ended
                                         Sep 30, 2010    June 30, 2010   Sep 30, 2009   Mar 31, 2010     Mar 31, 2009
 Number of clients
  Active                                         592              590            571            575              579
  Added during the period                         27               38             35            141              156
  Accounting for > 5% of revenue                   –                –              –              –                1
 Number of million* dollar clients
  1 million dollar +                             337              341            330            338              327
  5 million dollar +                             173              170            150            159              151
  10 million dollar +                            113              103             96             97              101
  20 million dollar +                             66               60             59             59               59
  30 million dollar +                             48               43             41             41               39
   40 million dollar +                            37               34             32             33               30
  50 million dollar +                             27               26             21             26               20
  60 million dollar +                             18               17             15             16               16
  70 million dollar +                             15               13             11             12               12
  80 million dollar +                             12               11              9             10               10
  90 million dollar +                             11               10              6              8                7
  100 million dollar +                            10                8              5              6                4
  200 million dollar +                             2                1              1              1                1
  300 million dollar +                             –                –              –              –                1
 Client contribution to revenue
  Top client                                    4.7%             4.9%           4.6%           4.6%             6.9%
  Top 5 clients                                15.8%            15.4%          16.5%          16.4%            18.0%
  Top 10 clients                               26.7%            26.1%          26.2%          26.2%            27.7%
 Repeat business                               98.4%            99.4%          98.0%          97.3%            97.6%
 Account receivables – LTM (in days)               63               60             56             59               62
LTM – Last Twelve Months
* LTM Revenues


© Infosys Technologies Limited 2009-10
Awards and Recognitions

• In recognition of our management and strategic planning practice, we were given the 2010
  Force of Ideas award by the Corporate Executive Board, Washington D.C.
• We won the North America Oracle Titan Award for ‘Outstanding Customer Solutions by a
  Leading Partner’ during Oracle® OpenWorld 2010.
• We received another Titan Award for the successful implementation of Oracle Warehouse
  Management System (WMS) for Cummins Inc.
• The award for the Best ITSM (IT Service Management) Project of the Year was awarded
  to Telstra and Infosys by itSMF Australia.
•       Infosys BPO won the CMO Asia Award for Excellence in Branding and Marketing for its
       initiative to promote thought leadership and its relationship with analysts, media and other
       key influencers.


    © Infosys Technologies Limited 2009-10
Client Acquisition &
                                         Expansion of Services


© Infosys Technologies Limited 2009-10
Client Acquisition & Expansion of Services

• Our solutions have been driving transformation for our existing and new clients, helping
  them streamline and diversify their businesses.
• We are working with a global food and beverage major to enhance systems in their
  Product Lifecycle Management and Laboratory Information Management System
  applications.
• We are also supporting the global product creation systems for a US-based sportswear
  and equipment major to help the client build next generation Product Lifecycle
  Management platforms.
• We are working with a major oilfield service provider, to develop and support technology
  products that will help oil and gas operators optimize production.
• We were selected by an international power company to work on its global financial
  consolidation project.
• We are working with a publication house to transform its order management value chain
  to increase revenues and improve customer engagement.
• A global financial services company selected us to roll out a new broker / dealer platform
  for its client and advisor base.

© Infosys Technologies Limited 2009-10
Products and Platforms


© Infosys Technologies Limited 2009-10
FinacleTM

• Gartner Inc. positioned Infosys in the Leaders Quadrant of the recently
  released ‘Magic Quadrant for International Retail Core Banking (IRCB)
  2010’ report for its Finacle™ core banking solution. Finacle™ continued
  its business momentum, adding 11 wins this quarter. Of these, four
  were from the Europe, Middle East and Africa (EMEA) region and seven
  from the Asia Pacific region. Eleven client projects went live on Finacle
  during the quarter.
• We crossed another milestone as Innovation Partner to banks with the
  launch of Finacle analyz™, a comprehensive analytics solution that
  empowers bank staff to make faster, insight-based decisions to
  strengthen customer relationships and improve profitability.


© Infosys Technologies Limited 2009-10
Flypp™

• Flypp™, the smart mobile application platform from Infosys, went live
  with Aircel, powering its PocketApps application store. The Aircel store
  offers over 2,000 mobile applications across seven different categories
  – Everyday Convenience, Education & Career, Finance, Health &
  Living, Games, Music & Fun and Socially Connected. Powered by
  Flypp™, Aircel PocketApps is accessible on more than 3,800 different
  handsets.


© Infosys Technologies Limited 2009-10
Infosys iEngage™

• The Infosys iEngage™ digital consumer platform has been selected by
  one of the world’s leading semiconductor companies to deliver next
  generation eCommerce for its direct-to-consumer division servicing
  North America and four countries across Europe.
• We also announced a strategic partnership with Jive Social Business
  Software for the Infosys iEngage™ digital consumer platform. This
  relationship will enhance the customer and employee engagement
  functionalities in Infosys iEngage™. Infosys will work closely with Jive in
  three areas – product roadmap, platform expertise, and best practice
  sharing.


© Infosys Technologies Limited 2009-10
Infosys BPO


© Infosys Technologies Limited 2009-10
Infosys BPO

Infosys BPO’s services continue to be in demand. A leading European life
insurance company engaged us to assess cost reductions through back
office policy servicing. We were engaged by a leading pharmaceutical
company to provide multilingual support across 16 European countries.
A large global bank opted for our services to identify and improve process
efficiency in its wholesale banking operations. We are harmonizing all
processes for a global player in the healthcare, lifestyle and lighting space.
We were selected by a leading software company to execute editorial
review and fraud process work for one of its key operations.


 © Infosys Technologies Limited 2009-10
Process innovation

During the second quarter, Infosys applied for 18 patent applications in
India and the US. With this, Infosys has an aggregate of 256 patent
applications (pending) in India and the US and has been granted 15
patents by the United States Patent and Trademark Office.


© Infosys Technologies Limited 2009-10
Human Resources


© Infosys Technologies Limited 2009-10
Human Resources

                                                EMPLOYEE METRICS
                                                        Quarter ended                         Year ended
                                         Sep 30, 2010   June 30, 2010   Sep 30, 2009   Mar 31, 2010   Mar 31, 2009
 Total employees                             1,22,468        1,14,822       1,05,453       1,13,796        1,04,850
 S/W professionals                           1,15,972        1,08,495        97,594        1,06,864         97,349
     Billable                                 99,667           95,863        87,798         93,254          86,306
     Banking product group                     5,178            5,029         2,800          4,730           2,349
     Trainees                                 11,127            7,603         6,996          8,880           8,694
 Sales & Support                               6,496            6,327         7,859          6,932           7,501
 Gross addition                               14,264            8,859         6,069         27,639          28,231
 Net addition                                  7,646            1,026         1,548          8,946          13,663
 Lateral employees                             4,138            2,942         1,064          4,895           5,796
 Attrition % (LTM)*                            17.1%           15.8%          10.9%          13.4%           11.1%
* Excluding subsidiaries


© Infosys Technologies Limited 2009-10
Infrastructure


© Infosys Technologies Limited 2009-10
Infrastructure

• As on September 30, 2010, the company had 26,578,158 sq. ft of space
  capable of accommodating 112,931 employees and 2,685,715 sq. ft
  under completion capable of accommodating 21,125 employees


© Infosys Technologies Limited 2009-10
Outlook


© Infosys Technologies Limited 2009-10
IFRS – Consolidated

Outlook under IFRS – consolidated*
• Quarter ending December 31, 2010
• Revenues are expected to be in the range of `6,884 crore and `6,953 crore;
  YoY growth of 19.9% to 21.1%
• Earnings per share (EPS) is expected to be in the range of `29.37 and `29.89;
  YoY growth of 7.5% to 9.4%
• Fiscal year ending March 31, 2011**
• Revenues are expected to be in the range of `26,951 crore and `27,165 crore;
  YoY growth of 18.5% to 19.4%
• Earnings per share (EPS) is expected to be in the range of `115.07 and
  `117.07;
  YoY growth of 5.5% to 7.4%
* Conversion 1 US$ = `44.50
** Excluding the income from the sale of our investment in OnMobile Systems, Inc. of `48 crore in fiscal 2010, the EPS
   growth is expected to be in the range of 6.4% to 8.2%


 © Infosys Technologies Limited 2009-10
Summary


© Infosys Technologies Limited 2009-10
Summary

• Though the economic environment continues to be challenging, we have leveraged our
  client relationships, solutions and investments to grow faster in this quarter, There are
  significant drivers for investment in Information Technology since any transformation
  program to ‘build tomorrow’s enterprises requires these investments to be made. We are
  partnering with our clients on these initiatives.
• We continue to successfully manage and meet our clients operational requirements,
  delivering higher returns on their investments.
• Our innovative prowess continues to gain favor with clients.
• Our portfolio of services and our enhanced focus on solutions as well as new engagement
  models are providing a compelling value proposition to our clients, We continue to see
  stronger volume growth with greater traction in financial services and retail.
• Our operating margins improved during the quarter while our liquidity position was further
  strengthened with cash and cash equivalents reaching US $3.9 billion, However, the
  continued global economic uncertainty, coupled with extreme currency volatility, is a
  concern for the industry.
• We have seen record hiring this quarter and attrition has decreased, Our new career
  architecture is showing positive results.

© Infosys Technologies Limited 2009-10
Thank You
                                         www.infosys.com


© Infosys Technologies Limited 2009-10

Q2 Results

  • 1.
    Performance for the Second Quarter ended September 30, 2010 S. Gopalakrishnan S. D. Shibulal Chief Executive Officer and Chief Operating Officer Managing Director and Director © Infosys Technologies Limited 2009-10
  • 2.
    Safe Harbour Certain statementsin this release concerning our future growth prospects are forward-looking statements, which involve a number of risks and uncertainties that could cause actual results to differ materially from those in such forward-looking statements. The risks and uncertainties relating to these statements include, but are not limited to, risks and uncertainties regarding fluctuations in earnings, our ability to manage growth, intense competition in IT services including those factors which may affect our cost advantage, wage increases in India, our ability to attract and retain highly skilled professionals, time and cost overruns on fixed-price, fixed-time frame contracts, client concentration, restrictions on immigration, industry segment concentration, our ability to manage our international operations, reduced demand for technology in our key focus areas, disruptions in telecommunication networks or system failures, our ability to successfully complete and integrate potential acquisitions, liability for damages on our service contracts, the success of the companies in which Infosys has made strategic investments, withdrawal of governmental fiscal incentives, political instability and regional conflicts, legal restrictions on raising capital or acquiring companies outside India, and unauthorized use of our intellectual property and general economic conditions affecting our industry. Additional risks that could affect our future operating results are more fully described in our United States Securities and Exchange Commission filings including our Annual Report on Form 20-F for the fiscal year ended March 31, 2010 and on Form 6-K for the quarter ended June 30, 2010.These filings are available at www.sec.gov. Infosys may, from time to time, make additional written and oral forward-looking statements, including statements contained in the company's filings with the Securities and Exchange Commission and our reports to shareholders. The company does not undertake to update any forward-looking statements that may be made from time to time by or on behalf of the company. © Infosys Technologies Limited 2009-10
  • 3.
    Agenda • Financial Performance •Operational Performance • Client Acquisition & Expansion of Services • Products and Platforms • Infosys BPO • Human Resources • Infrastructure • Outlook • Summary © Infosys Technologies Limited 2009-10
  • 4.
    Financial Performance © InfosysTechnologies Limited 2009-10
  • 5.
    Highlights... • Revenues were`6,947 crore for the quarter ended September 30, 2010; QoQ growth was 12.1%; YoY growth was 24.4% • Net profit after tax was `1,737 crore for the quarter ended September 30, 2010; QoQ growth was 16.7%; YoY growth was 13.2% • Earnings per share was `30.41 for the quarter ended September 30,2010; QoQ growth was 16.7%; YoY growth was 13.0% © Infosys Technologies Limited 2009-10
  • 6.
    ...Highlights • 27 clientswere added during the quarter by Infosys and its subsidiaries • Gross addition of 14,264 employees (net addition of 7,646) for the quarter by Infosys and its subsidiaries • 1,22,468 employees as on September 30, 2010 for Infosys and its subsidiaries • Declared an interim dividend of `10 per share and a 30th year special dividend of `30 per share (Previous year interim dividend of `10 per share). The record date for the payment of dividend is October 22, 2010. © Infosys Technologies Limited 2009-10
  • 7.
    Financial Performance Unaudited CondensedConsolidated Statement of Comprehensive Income for three months ended, (As per IFRS) In ` crore, except share data September 30, Growth % in Growth June 30, Particulars Q2 11 over 2010 2009 (%) 2010 Q1 11 Revenues 6,947 5,585 24.4 6,198 12.1 Cost of sales 3,971 3,203 24.0 3,648 8.9 Gross profit 2,976 2,382 24.9 2,550 16.7 Operational expenses: Selling and marketing expenses 380 276 37.7 339 12.1 Administrative expenses 498 413 20.6 456 9.2 Total operating expenses 878 689 27.4 795 10.4 Operating profit 2,098 1,693 23.9 1,755 19.5 Other income, net 267 239 11.7 239 11.7 Profit before income taxes 2,365 1,932 22.4 1,994 18.6 Income tax expense 628 397 58.2 506 24.1 Net profit 1,737 1,535 13.2 1,488 16.7 Earnings per equity share Basic (`) 30.41 26.91 13.0 26.06 16.7 Diluted (`) 30.40 26.87 13.1 26.05 16.7 © Infosys Technologies Limited 2009-10
  • 8.
    Operational Performance © InfosysTechnologies Limited 2009-10
  • 9.
    Region wise Revenue REVENUE BY GEOGRAPHICAL SEGMENT Quarter ended LTM Sep 30, 2010 June 30, 2010 Sep 30, 2009 Sep 30, 2010 Sep 30, 2009 % % % % % North America 65.8 67.3 65.9 66.4 64.9 Europe 21.8 20.3 23.2 21.6 24.4 India 2.1 1.7 1.2 1.6 1.2 Rest of the world 10.3 10.7 9.7 10.4 9.5 Total 100.0 100.0 100.0 100.0 100.0 © Infosys Technologies Limited 2009-10
  • 10.
    Effort and Utilization EFFORT AND UTILIZATION Quarter ended LTM Sep 30, 2010 June 30, 2010 Sep 30, 2009 Sep 30, 2010 Sep 30, 2009 % % % % % Effort Onsite 24.5 22.9 22.6 23.2 22.9 Offshore 75.5 77.1 77.4 76.8 77.1 Utilization Including trainees 74.3 73.0 67.3 71.4 67.6 Excluding trainees 81.2 78.7 73.2 78.4 73.2 © Infosys Technologies Limited 2009-10
  • 11.
    Revenues by Projecttype REVENUE BY PROJECT TYPE* Quarter ended LTM Sep 30, 2010 June 30, 2010 Sep 30, 2009 Sep 30, 2010 Sep 30, 2009 % % % % % Fixed price 39.9 39.0 38.0 39.2 37.7 Time & materials 60.1 61.0 62.0 60.8 62.3 Total 100.0 100.0 100.0 100.0 100.0 * Excluding products © Infosys Technologies Limited 2009-10
  • 12.
    Onsite-Offshore Revenue split Quarter ended LTM Sep 30, 2010 June 30, 2010 Sep 30, 2009 Sep 30, 2010 Sep 30, 2009 % % % % % Revenue Onsite 50.2 48.0 46.0 47.7 46.1 Offshore 49.8 52.0 54.0 52.3 53.9 © Infosys Technologies Limited 2009-10
  • 13.
    Customer Concentration CLIENT DATA Quarter ended Year ended Sep 30, 2010 June 30, 2010 Sep 30, 2009 Mar 31, 2010 Mar 31, 2009 Number of clients Active 592 590 571 575 579 Added during the period 27 38 35 141 156 Accounting for > 5% of revenue – – – – 1 Number of million* dollar clients 1 million dollar + 337 341 330 338 327 5 million dollar + 173 170 150 159 151 10 million dollar + 113 103 96 97 101 20 million dollar + 66 60 59 59 59 30 million dollar + 48 43 41 41 39 40 million dollar + 37 34 32 33 30 50 million dollar + 27 26 21 26 20 60 million dollar + 18 17 15 16 16 70 million dollar + 15 13 11 12 12 80 million dollar + 12 11 9 10 10 90 million dollar + 11 10 6 8 7 100 million dollar + 10 8 5 6 4 200 million dollar + 2 1 1 1 1 300 million dollar + – – – – 1 Client contribution to revenue Top client 4.7% 4.9% 4.6% 4.6% 6.9% Top 5 clients 15.8% 15.4% 16.5% 16.4% 18.0% Top 10 clients 26.7% 26.1% 26.2% 26.2% 27.7% Repeat business 98.4% 99.4% 98.0% 97.3% 97.6% Account receivables – LTM (in days) 63 60 56 59 62 LTM – Last Twelve Months * LTM Revenues © Infosys Technologies Limited 2009-10
  • 14.
    Awards and Recognitions •In recognition of our management and strategic planning practice, we were given the 2010 Force of Ideas award by the Corporate Executive Board, Washington D.C. • We won the North America Oracle Titan Award for ‘Outstanding Customer Solutions by a Leading Partner’ during Oracle® OpenWorld 2010. • We received another Titan Award for the successful implementation of Oracle Warehouse Management System (WMS) for Cummins Inc. • The award for the Best ITSM (IT Service Management) Project of the Year was awarded to Telstra and Infosys by itSMF Australia. • Infosys BPO won the CMO Asia Award for Excellence in Branding and Marketing for its initiative to promote thought leadership and its relationship with analysts, media and other key influencers. © Infosys Technologies Limited 2009-10
  • 15.
    Client Acquisition & Expansion of Services © Infosys Technologies Limited 2009-10
  • 16.
    Client Acquisition &Expansion of Services • Our solutions have been driving transformation for our existing and new clients, helping them streamline and diversify their businesses. • We are working with a global food and beverage major to enhance systems in their Product Lifecycle Management and Laboratory Information Management System applications. • We are also supporting the global product creation systems for a US-based sportswear and equipment major to help the client build next generation Product Lifecycle Management platforms. • We are working with a major oilfield service provider, to develop and support technology products that will help oil and gas operators optimize production. • We were selected by an international power company to work on its global financial consolidation project. • We are working with a publication house to transform its order management value chain to increase revenues and improve customer engagement. • A global financial services company selected us to roll out a new broker / dealer platform for its client and advisor base. © Infosys Technologies Limited 2009-10
  • 17.
    Products and Platforms ©Infosys Technologies Limited 2009-10
  • 18.
    FinacleTM • Gartner Inc.positioned Infosys in the Leaders Quadrant of the recently released ‘Magic Quadrant for International Retail Core Banking (IRCB) 2010’ report for its Finacle™ core banking solution. Finacle™ continued its business momentum, adding 11 wins this quarter. Of these, four were from the Europe, Middle East and Africa (EMEA) region and seven from the Asia Pacific region. Eleven client projects went live on Finacle during the quarter. • We crossed another milestone as Innovation Partner to banks with the launch of Finacle analyz™, a comprehensive analytics solution that empowers bank staff to make faster, insight-based decisions to strengthen customer relationships and improve profitability. © Infosys Technologies Limited 2009-10
  • 19.
    Flypp™ • Flypp™, thesmart mobile application platform from Infosys, went live with Aircel, powering its PocketApps application store. The Aircel store offers over 2,000 mobile applications across seven different categories – Everyday Convenience, Education & Career, Finance, Health & Living, Games, Music & Fun and Socially Connected. Powered by Flypp™, Aircel PocketApps is accessible on more than 3,800 different handsets. © Infosys Technologies Limited 2009-10
  • 20.
    Infosys iEngage™ • TheInfosys iEngage™ digital consumer platform has been selected by one of the world’s leading semiconductor companies to deliver next generation eCommerce for its direct-to-consumer division servicing North America and four countries across Europe. • We also announced a strategic partnership with Jive Social Business Software for the Infosys iEngage™ digital consumer platform. This relationship will enhance the customer and employee engagement functionalities in Infosys iEngage™. Infosys will work closely with Jive in three areas – product roadmap, platform expertise, and best practice sharing. © Infosys Technologies Limited 2009-10
  • 21.
    Infosys BPO © InfosysTechnologies Limited 2009-10
  • 22.
    Infosys BPO Infosys BPO’sservices continue to be in demand. A leading European life insurance company engaged us to assess cost reductions through back office policy servicing. We were engaged by a leading pharmaceutical company to provide multilingual support across 16 European countries. A large global bank opted for our services to identify and improve process efficiency in its wholesale banking operations. We are harmonizing all processes for a global player in the healthcare, lifestyle and lighting space. We were selected by a leading software company to execute editorial review and fraud process work for one of its key operations. © Infosys Technologies Limited 2009-10
  • 23.
    Process innovation During thesecond quarter, Infosys applied for 18 patent applications in India and the US. With this, Infosys has an aggregate of 256 patent applications (pending) in India and the US and has been granted 15 patents by the United States Patent and Trademark Office. © Infosys Technologies Limited 2009-10
  • 24.
    Human Resources © InfosysTechnologies Limited 2009-10
  • 25.
    Human Resources EMPLOYEE METRICS Quarter ended Year ended Sep 30, 2010 June 30, 2010 Sep 30, 2009 Mar 31, 2010 Mar 31, 2009 Total employees 1,22,468 1,14,822 1,05,453 1,13,796 1,04,850 S/W professionals 1,15,972 1,08,495 97,594 1,06,864 97,349 Billable 99,667 95,863 87,798 93,254 86,306 Banking product group 5,178 5,029 2,800 4,730 2,349 Trainees 11,127 7,603 6,996 8,880 8,694 Sales & Support 6,496 6,327 7,859 6,932 7,501 Gross addition 14,264 8,859 6,069 27,639 28,231 Net addition 7,646 1,026 1,548 8,946 13,663 Lateral employees 4,138 2,942 1,064 4,895 5,796 Attrition % (LTM)* 17.1% 15.8% 10.9% 13.4% 11.1% * Excluding subsidiaries © Infosys Technologies Limited 2009-10
  • 26.
  • 27.
    Infrastructure • As onSeptember 30, 2010, the company had 26,578,158 sq. ft of space capable of accommodating 112,931 employees and 2,685,715 sq. ft under completion capable of accommodating 21,125 employees © Infosys Technologies Limited 2009-10
  • 28.
  • 29.
    IFRS – Consolidated Outlookunder IFRS – consolidated* • Quarter ending December 31, 2010 • Revenues are expected to be in the range of `6,884 crore and `6,953 crore; YoY growth of 19.9% to 21.1% • Earnings per share (EPS) is expected to be in the range of `29.37 and `29.89; YoY growth of 7.5% to 9.4% • Fiscal year ending March 31, 2011** • Revenues are expected to be in the range of `26,951 crore and `27,165 crore; YoY growth of 18.5% to 19.4% • Earnings per share (EPS) is expected to be in the range of `115.07 and `117.07; YoY growth of 5.5% to 7.4% * Conversion 1 US$ = `44.50 ** Excluding the income from the sale of our investment in OnMobile Systems, Inc. of `48 crore in fiscal 2010, the EPS growth is expected to be in the range of 6.4% to 8.2% © Infosys Technologies Limited 2009-10
  • 30.
  • 31.
    Summary • Though theeconomic environment continues to be challenging, we have leveraged our client relationships, solutions and investments to grow faster in this quarter, There are significant drivers for investment in Information Technology since any transformation program to ‘build tomorrow’s enterprises requires these investments to be made. We are partnering with our clients on these initiatives. • We continue to successfully manage and meet our clients operational requirements, delivering higher returns on their investments. • Our innovative prowess continues to gain favor with clients. • Our portfolio of services and our enhanced focus on solutions as well as new engagement models are providing a compelling value proposition to our clients, We continue to see stronger volume growth with greater traction in financial services and retail. • Our operating margins improved during the quarter while our liquidity position was further strengthened with cash and cash equivalents reaching US $3.9 billion, However, the continued global economic uncertainty, coupled with extreme currency volatility, is a concern for the industry. • We have seen record hiring this quarter and attrition has decreased, Our new career architecture is showing positive results. © Infosys Technologies Limited 2009-10
  • 32.
    Thank You www.infosys.com © Infosys Technologies Limited 2009-10