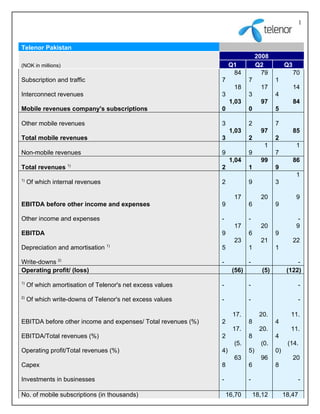
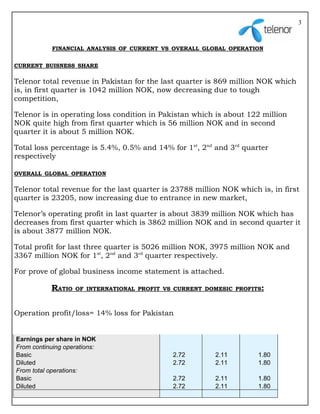
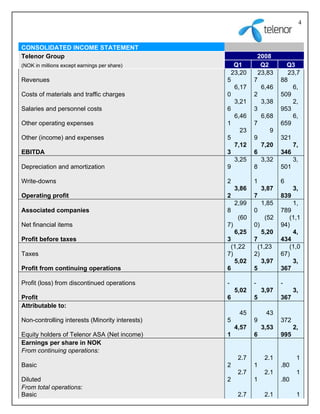
SlideShare a Scribd company logo
1 of 5
1


Telenor Pakistan
                                                                                2008
(NOK in millions)                                                  Q1           Q2           Q3
                                                                    84            79              70
Subscription and traffic                                      7            7            1
                                                                    18           17               14
Interconnect revenues                                         3            3            4
                                                                   1,03          97               84
Mobile revenues company's subscriptions                       0            0            5

Other mobile revenues                                         3            2            7
                                                                   1,03          97               85
Total mobile revenues                                         3            2            2
                                                                                  1               1
Non-mobile revenues                                           9            9            7
                                                                   1,04          99               86
Total revenues 1)                                             2            1            9
                                                                                                  1
1)
     Of which internal revenues                               2            9            3

                                                                    17           20               9
EBITDA before other income and expenses                       9            6            9

Other income and expenses                                     -            -                       -
                                                                    17           20               9
EBITDA                                                        9            6            9
                                                                    23           21               22
                                  1)
Depreciation and amortisation                                 5            1            1

Write-downs 2)                                                -            -                      -
Operating profit/ (loss)                                            (56)          (5)         (122)
1)
     Of which amortisation of Telenor's net excess values     -            -                         -
2)
     Of which write-downs of Telenor's net excess values      -            -                         -

                                                                    17.          20.           11.
EBITDA before other income and expenses/ Total revenues (%)   2            8            4
                                                                    17.          20.           11.
EBITDA/Total revenues (%)                                     2            8            4
                                                                    (5.          (0.          (14.
Operating profit/Total revenues (%)                           4)           5)           0)
                                                                    63           96               20
Capex                                                         8            6            8

Investments in businesses                                     -            -                         -

No. of mobile subscriptions (in thousands)                        16,70        18,12         18,47
2


                                                                   2           5           2
                                                                       16,56       17,97       18,30
- of which prepaid                                                 1           0           7
Average traffic minutes per subscription per month (AMPU) in the         16          16           14
quarter                                                            3           5           6
                                                                          2           1            1
Average revenue per subscription per month (ARPU) in the quarter   2           9           5
                                                                          5           4            3
- of which contract                                                1           1           5
                                                                          2           1            1
- of which prepaid                                                 2           8           5
3


            FINANCIAL ANALYSIS OF CURRENT VS OVERALL GLOBAL OPERATION


CURRENT BUISNESS SHARE

Telenor total revenue in Pakistan for the last quarter is 869 million NOK which
is, in first quarter is 1042 million NOK, now decreasing due to tough
competition,

Telenor is in operating loss condition in Pakistan which is about 122 million
NOK quite high from first quarter which is 56 million NOK and in second
quarter it is about 5 million NOK.

Total loss percentage is 5.4%, 0.5% and 14% for 1st, 2nd and 3rd quarter
respectively

OVERALL GLOBAL OPERATION

Telenor total revenue for the last quarter is 23788 million NOK which is, in first
quarter is 23205, now increasing due to entrance in new market,

Telenor’s operating profit in last quarter is about 3839 million NOK which has
decreases from first quarter which is 3862 million NOK and in second quarter it
is about 3877 million NOK.

Total profit for last three quarter is 5026 million NOK, 3975 million NOK and
3367 million NOK for 1st, 2nd and 3rd quarter respectively.

For prove of global business income statement is attached.

           RATIO    OF INTERNATIONAL PROFIT VS CURRENT DOMESIC PROFITS:


Operation profit/loss= 14% loss for Pakistan


Earnings per share in NOK
From continuing operations:
Basic                                         2.72       2.11         1.80
Diluted                                       2.72       2.11         1.80
From total operations:
Basic                                         2.72       2.11         1.80
Diluted                                       2.72       2.11         1.80
4


CONSOLIDATED INCOME STATEMENT
Telenor Group                                                 2008
(NOK in millions except earnings per share)        Q1          Q2          Q3
                                                  23,20       23,83         23,7
Revenues                                         5           7           88
                                                   6,17        6,46          6,
Costs of materials and traffic charges           0           2           509
                                                   3,21        3,38          2,
Salaries and personnel costs                     6           3           953
                                                   6,46        6,68          6,
Other operating expenses                         1           7           659
                                                     23           9
Other (income) and expenses                      5           9           321
                                                   7,12        7,20            7,
EBITDA                                           3           6           346
                                                   3,25        3,32            3,
Depreciation and amortization                    9           8           501

Write-downs                                      2           1           6
                                                      3,86        3,87         3,
Operating profit                                 2           7           839
                                                      2,99        1,85       1,
Associated companies                             8           0           789
                                                       (60         (52      (1,1
Net financial items                              7)          0)          94)
                                                      6,25        5,20       4,
Profit before taxes                              3           7           434
                                                  (1,22       (1,23         (1,0
Taxes                                            7)          2)          67)
                                                    5,02        3,97         3,
Profit from continuing operations                6           5           367

Profit (loss) from discontinued operations       -           -           -
                                                      5,02        3,97         3,
Profit                                           6           5           367
Attributable to:
                                                       45          43
Non-controlling interests (Minority interests)   5           9           372
                                                      4,57        3,53         2,
Equity holders of Telenor ASA (Net income)       1           6           995
Earnings per share in NOK
From continuing operations:
                                                       2.7         2.1          1
Basic                                            2           1           .80
                                                       2.7         2.1          1
Diluted                                          2           1           .80
From total operations:
Basic                                                  2.7         2.1          1
5


          2         1         .80
              2.7       2.1         1
Diluted   2         1         .80

More Related Content

What's hot

viacom Q208%20Web%20Deck%20FINAL%207.29
viacom Q208%20Web%20Deck%20FINAL%207.29viacom Q208%20Web%20Deck%20FINAL%207.29
viacom Q208%20Web%20Deck%20FINAL%207.29finance20
 
Presentation 1Q12 | Locamerica
Presentation 1Q12 | LocamericaPresentation 1Q12 | Locamerica
Presentation 1Q12 | Locamericalocamerica
 
danaher 06-3Q-REL
danaher 06-3Q-RELdanaher 06-3Q-REL
danaher 06-3Q-RELfinance24
 
el paso 22758BEF-CBE8-4368-BDC6-D02434EE5C13_EP_4Q08OpStatsFinal
el paso 22758BEF-CBE8-4368-BDC6-D02434EE5C13_EP_4Q08OpStatsFinalel paso 22758BEF-CBE8-4368-BDC6-D02434EE5C13_EP_4Q08OpStatsFinal
el paso 22758BEF-CBE8-4368-BDC6-D02434EE5C13_EP_4Q08OpStatsFinalfinance49
 
ameriprise 4Q05_Supplement
ameriprise 4Q05_Supplementameriprise 4Q05_Supplement
ameriprise 4Q05_Supplementfinance43
 
plains all american pipeline Annual Reports 2000
plains all american pipeline  Annual Reports 2000plains all american pipeline  Annual Reports 2000
plains all american pipeline Annual Reports 2000finance13
 
tribune earnings_q3_06_tables
tribune  earnings_q3_06_tablestribune  earnings_q3_06_tables
tribune earnings_q3_06_tablesfinance47
 
2Q08_Op_Stats_Final
2Q08_Op_Stats_Final2Q08_Op_Stats_Final
2Q08_Op_Stats_Finalfinance49
 

What's hot (13)

viacom Q208%20Web%20Deck%20FINAL%207.29
viacom Q208%20Web%20Deck%20FINAL%207.29viacom Q208%20Web%20Deck%20FINAL%207.29
viacom Q208%20Web%20Deck%20FINAL%207.29
 
citigroup Qer084s
citigroup Qer084scitigroup Qer084s
citigroup Qer084s
 
Presentation 1Q12 | Locamerica
Presentation 1Q12 | LocamericaPresentation 1Q12 | Locamerica
Presentation 1Q12 | Locamerica
 
citigroup Qer084s
citigroup Qer084scitigroup Qer084s
citigroup Qer084s
 
9M 2008 Results
9M 2008 Results9M 2008 Results
9M 2008 Results
 
danaher 06-3Q-REL
danaher 06-3Q-RELdanaher 06-3Q-REL
danaher 06-3Q-REL
 
Amd Q408 Financials
Amd Q408 FinancialsAmd Q408 Financials
Amd Q408 Financials
 
el paso 22758BEF-CBE8-4368-BDC6-D02434EE5C13_EP_4Q08OpStatsFinal
el paso 22758BEF-CBE8-4368-BDC6-D02434EE5C13_EP_4Q08OpStatsFinalel paso 22758BEF-CBE8-4368-BDC6-D02434EE5C13_EP_4Q08OpStatsFinal
el paso 22758BEF-CBE8-4368-BDC6-D02434EE5C13_EP_4Q08OpStatsFinal
 
ameriprise 4Q05_Supplement
ameriprise 4Q05_Supplementameriprise 4Q05_Supplement
ameriprise 4Q05_Supplement
 
Second Quarter 2007 Earnings Presentation
Second Quarter 2007 Earnings PresentationSecond Quarter 2007 Earnings Presentation
Second Quarter 2007 Earnings Presentation
 
plains all american pipeline Annual Reports 2000
plains all american pipeline  Annual Reports 2000plains all american pipeline  Annual Reports 2000
plains all american pipeline Annual Reports 2000
 
tribune earnings_q3_06_tables
tribune  earnings_q3_06_tablestribune  earnings_q3_06_tables
tribune earnings_q3_06_tables
 
2Q08_Op_Stats_Final
2Q08_Op_Stats_Final2Q08_Op_Stats_Final
2Q08_Op_Stats_Final
 

Similar to Telenor Financial Statement Ratios

coca cola Reconciliation of Q2 and YTD 2008 Non-GAAP Financial Measures
coca cola  	Reconciliation of Q2 and YTD 2008 Non-GAAP Financial Measurescoca cola  	Reconciliation of Q2 and YTD 2008 Non-GAAP Financial Measures
coca cola Reconciliation of Q2 and YTD 2008 Non-GAAP Financial Measuresfinance9
 
credit-suisse Annual Report Part 1 Performance of Credit Suisse Group shares
credit-suisse Annual Report Part 1 Performance of Credit Suisse Group sharescredit-suisse Annual Report Part 1 Performance of Credit Suisse Group shares
credit-suisse Annual Report Part 1 Performance of Credit Suisse Group sharesQuarterlyEarningsReports2
 
dte_q403supp
dte_q403suppdte_q403supp
dte_q403suppfinance41
 
dte_q403supp
dte_q403suppdte_q403supp
dte_q403suppfinance41
 
ecolab 2_DscrptBusnFinHighlight
ecolab  2_DscrptBusnFinHighlightecolab  2_DscrptBusnFinHighlight
ecolab 2_DscrptBusnFinHighlightfinance37
 
Vodaphone 2008 Half-Yearly Results
Vodaphone 2008 Half-Yearly ResultsVodaphone 2008 Half-Yearly Results
Vodaphone 2008 Half-Yearly Resultsearningsreport
 
CLOrox fy05_q2_pl
CLOrox   fy05_q2_plCLOrox   fy05_q2_pl
CLOrox fy05_q2_plfinance48
 
Q32003_supplemental
Q32003_supplementalQ32003_supplemental
Q32003_supplementalfinance41
 
Q32003_supplemental
Q32003_supplementalQ32003_supplemental
Q32003_supplementalfinance41
 
coca cola Reconciliation of Q1 2008 Non-GAAP Financial Measures
coca cola Reconciliation of Q1 2008 Non-GAAP Financial Measurescoca cola Reconciliation of Q1 2008 Non-GAAP Financial Measures
coca cola Reconciliation of Q1 2008 Non-GAAP Financial Measuresfinance9
 
Duke_Energy_2005_Annual_Report
Duke_Energy_2005_Annual_ReportDuke_Energy_2005_Annual_Report
Duke_Energy_2005_Annual_Reportfinance21
 
Fonterra Interim Results
Fonterra Interim ResultsFonterra Interim Results
Fonterra Interim ResultsBryan Spondre
 
CLOrox fy05_q3_pl
CLOrox   fy05_q3_plCLOrox   fy05_q3_pl
CLOrox fy05_q3_plfinance48
 
TI FY 2009 - 2009 Results and the 2010-2012 Strategic Plan Update
TI FY 2009 - 2009 Results and the 2010-2012 Strategic Plan UpdateTI FY 2009 - 2009 Results and the 2010-2012 Strategic Plan Update
TI FY 2009 - 2009 Results and the 2010-2012 Strategic Plan UpdateGruppo TIM
 
Consolidated Financial Statements 2010
Consolidated Financial Statements 2010Consolidated Financial Statements 2010
Consolidated Financial Statements 2010Edison S.p.A.
 
FirstEnergy Consolidated_Statements_of_Income
FirstEnergy Consolidated_Statements_of_IncomeFirstEnergy Consolidated_Statements_of_Income
FirstEnergy Consolidated_Statements_of_Incomefinance21
 

Similar to Telenor Financial Statement Ratios (20)

coca cola Reconciliation of Q2 and YTD 2008 Non-GAAP Financial Measures
coca cola  	Reconciliation of Q2 and YTD 2008 Non-GAAP Financial Measurescoca cola  	Reconciliation of Q2 and YTD 2008 Non-GAAP Financial Measures
coca cola Reconciliation of Q2 and YTD 2008 Non-GAAP Financial Measures
 
credit-suisse Annual Report Part 1 Performance of Credit Suisse Group shares
credit-suisse Annual Report Part 1 Performance of Credit Suisse Group sharescredit-suisse Annual Report Part 1 Performance of Credit Suisse Group shares
credit-suisse Annual Report Part 1 Performance of Credit Suisse Group shares
 
.credit Presentation slidessuiss
.credit Presentation slidessuiss.credit Presentation slidessuiss
.credit Presentation slidessuiss
 
credit-suisse Presentation slides
credit-suisse Presentation slidescredit-suisse Presentation slides
credit-suisse Presentation slides
 
dte_q403supp
dte_q403suppdte_q403supp
dte_q403supp
 
dte_q403supp
dte_q403suppdte_q403supp
dte_q403supp
 
ecolab 2_DscrptBusnFinHighlight
ecolab  2_DscrptBusnFinHighlightecolab  2_DscrptBusnFinHighlight
ecolab 2_DscrptBusnFinHighlight
 
Q1 2009 Earning Report of Covanta Holdings
Q1 2009 Earning Report of Covanta HoldingsQ1 2009 Earning Report of Covanta Holdings
Q1 2009 Earning Report of Covanta Holdings
 
Vodaphone 2008 Half-Yearly Results
Vodaphone 2008 Half-Yearly ResultsVodaphone 2008 Half-Yearly Results
Vodaphone 2008 Half-Yearly Results
 
CLOrox fy05_q2_pl
CLOrox   fy05_q2_plCLOrox   fy05_q2_pl
CLOrox fy05_q2_pl
 
Q32003_supplemental
Q32003_supplementalQ32003_supplemental
Q32003_supplemental
 
Q32003_supplemental
Q32003_supplementalQ32003_supplemental
Q32003_supplemental
 
coca cola Reconciliation of Q1 2008 Non-GAAP Financial Measures
coca cola Reconciliation of Q1 2008 Non-GAAP Financial Measurescoca cola Reconciliation of Q1 2008 Non-GAAP Financial Measures
coca cola Reconciliation of Q1 2008 Non-GAAP Financial Measures
 
Duke_Energy_2005_Annual_Report
Duke_Energy_2005_Annual_ReportDuke_Energy_2005_Annual_Report
Duke_Energy_2005_Annual_Report
 
Fonterra Interim Results
Fonterra Interim ResultsFonterra Interim Results
Fonterra Interim Results
 
Pirelli 1 H09 Financial Results
Pirelli 1 H09 Financial ResultsPirelli 1 H09 Financial Results
Pirelli 1 H09 Financial Results
 
CLOrox fy05_q3_pl
CLOrox   fy05_q3_plCLOrox   fy05_q3_pl
CLOrox fy05_q3_pl
 
TI FY 2009 - 2009 Results and the 2010-2012 Strategic Plan Update
TI FY 2009 - 2009 Results and the 2010-2012 Strategic Plan UpdateTI FY 2009 - 2009 Results and the 2010-2012 Strategic Plan Update
TI FY 2009 - 2009 Results and the 2010-2012 Strategic Plan Update
 
Consolidated Financial Statements 2010
Consolidated Financial Statements 2010Consolidated Financial Statements 2010
Consolidated Financial Statements 2010
 
FirstEnergy Consolidated_Statements_of_Income
FirstEnergy Consolidated_Statements_of_IncomeFirstEnergy Consolidated_Statements_of_Income
FirstEnergy Consolidated_Statements_of_Income
 

Telenor Financial Statement Ratios

  • 1. 1 Telenor Pakistan 2008 (NOK in millions) Q1 Q2 Q3 84 79 70 Subscription and traffic 7 7 1 18 17 14 Interconnect revenues 3 3 4 1,03 97 84 Mobile revenues company's subscriptions 0 0 5 Other mobile revenues 3 2 7 1,03 97 85 Total mobile revenues 3 2 2 1 1 Non-mobile revenues 9 9 7 1,04 99 86 Total revenues 1) 2 1 9 1 1) Of which internal revenues 2 9 3 17 20 9 EBITDA before other income and expenses 9 6 9 Other income and expenses - - - 17 20 9 EBITDA 9 6 9 23 21 22 1) Depreciation and amortisation 5 1 1 Write-downs 2) - - - Operating profit/ (loss) (56) (5) (122) 1) Of which amortisation of Telenor's net excess values - - - 2) Of which write-downs of Telenor's net excess values - - - 17. 20. 11. EBITDA before other income and expenses/ Total revenues (%) 2 8 4 17. 20. 11. EBITDA/Total revenues (%) 2 8 4 (5. (0. (14. Operating profit/Total revenues (%) 4) 5) 0) 63 96 20 Capex 8 6 8 Investments in businesses - - - No. of mobile subscriptions (in thousands) 16,70 18,12 18,47
  • 2. 2 2 5 2 16,56 17,97 18,30 - of which prepaid 1 0 7 Average traffic minutes per subscription per month (AMPU) in the 16 16 14 quarter 3 5 6 2 1 1 Average revenue per subscription per month (ARPU) in the quarter 2 9 5 5 4 3 - of which contract 1 1 5 2 1 1 - of which prepaid 2 8 5
  • 3. 3 FINANCIAL ANALYSIS OF CURRENT VS OVERALL GLOBAL OPERATION CURRENT BUISNESS SHARE Telenor total revenue in Pakistan for the last quarter is 869 million NOK which is, in first quarter is 1042 million NOK, now decreasing due to tough competition, Telenor is in operating loss condition in Pakistan which is about 122 million NOK quite high from first quarter which is 56 million NOK and in second quarter it is about 5 million NOK. Total loss percentage is 5.4%, 0.5% and 14% for 1st, 2nd and 3rd quarter respectively OVERALL GLOBAL OPERATION Telenor total revenue for the last quarter is 23788 million NOK which is, in first quarter is 23205, now increasing due to entrance in new market, Telenor’s operating profit in last quarter is about 3839 million NOK which has decreases from first quarter which is 3862 million NOK and in second quarter it is about 3877 million NOK. Total profit for last three quarter is 5026 million NOK, 3975 million NOK and 3367 million NOK for 1st, 2nd and 3rd quarter respectively. For prove of global business income statement is attached. RATIO OF INTERNATIONAL PROFIT VS CURRENT DOMESIC PROFITS: Operation profit/loss= 14% loss for Pakistan Earnings per share in NOK From continuing operations: Basic 2.72 2.11 1.80 Diluted 2.72 2.11 1.80 From total operations: Basic 2.72 2.11 1.80 Diluted 2.72 2.11 1.80
  • 4. 4 CONSOLIDATED INCOME STATEMENT Telenor Group 2008 (NOK in millions except earnings per share) Q1 Q2 Q3 23,20 23,83 23,7 Revenues 5 7 88 6,17 6,46 6, Costs of materials and traffic charges 0 2 509 3,21 3,38 2, Salaries and personnel costs 6 3 953 6,46 6,68 6, Other operating expenses 1 7 659 23 9 Other (income) and expenses 5 9 321 7,12 7,20 7, EBITDA 3 6 346 3,25 3,32 3, Depreciation and amortization 9 8 501 Write-downs 2 1 6 3,86 3,87 3, Operating profit 2 7 839 2,99 1,85 1, Associated companies 8 0 789 (60 (52 (1,1 Net financial items 7) 0) 94) 6,25 5,20 4, Profit before taxes 3 7 434 (1,22 (1,23 (1,0 Taxes 7) 2) 67) 5,02 3,97 3, Profit from continuing operations 6 5 367 Profit (loss) from discontinued operations - - - 5,02 3,97 3, Profit 6 5 367 Attributable to: 45 43 Non-controlling interests (Minority interests) 5 9 372 4,57 3,53 2, Equity holders of Telenor ASA (Net income) 1 6 995 Earnings per share in NOK From continuing operations: 2.7 2.1 1 Basic 2 1 .80 2.7 2.1 1 Diluted 2 1 .80 From total operations: Basic 2.7 2.1 1
  • 5. 5 2 1 .80 2.7 2.1 1 Diluted 2 1 .80