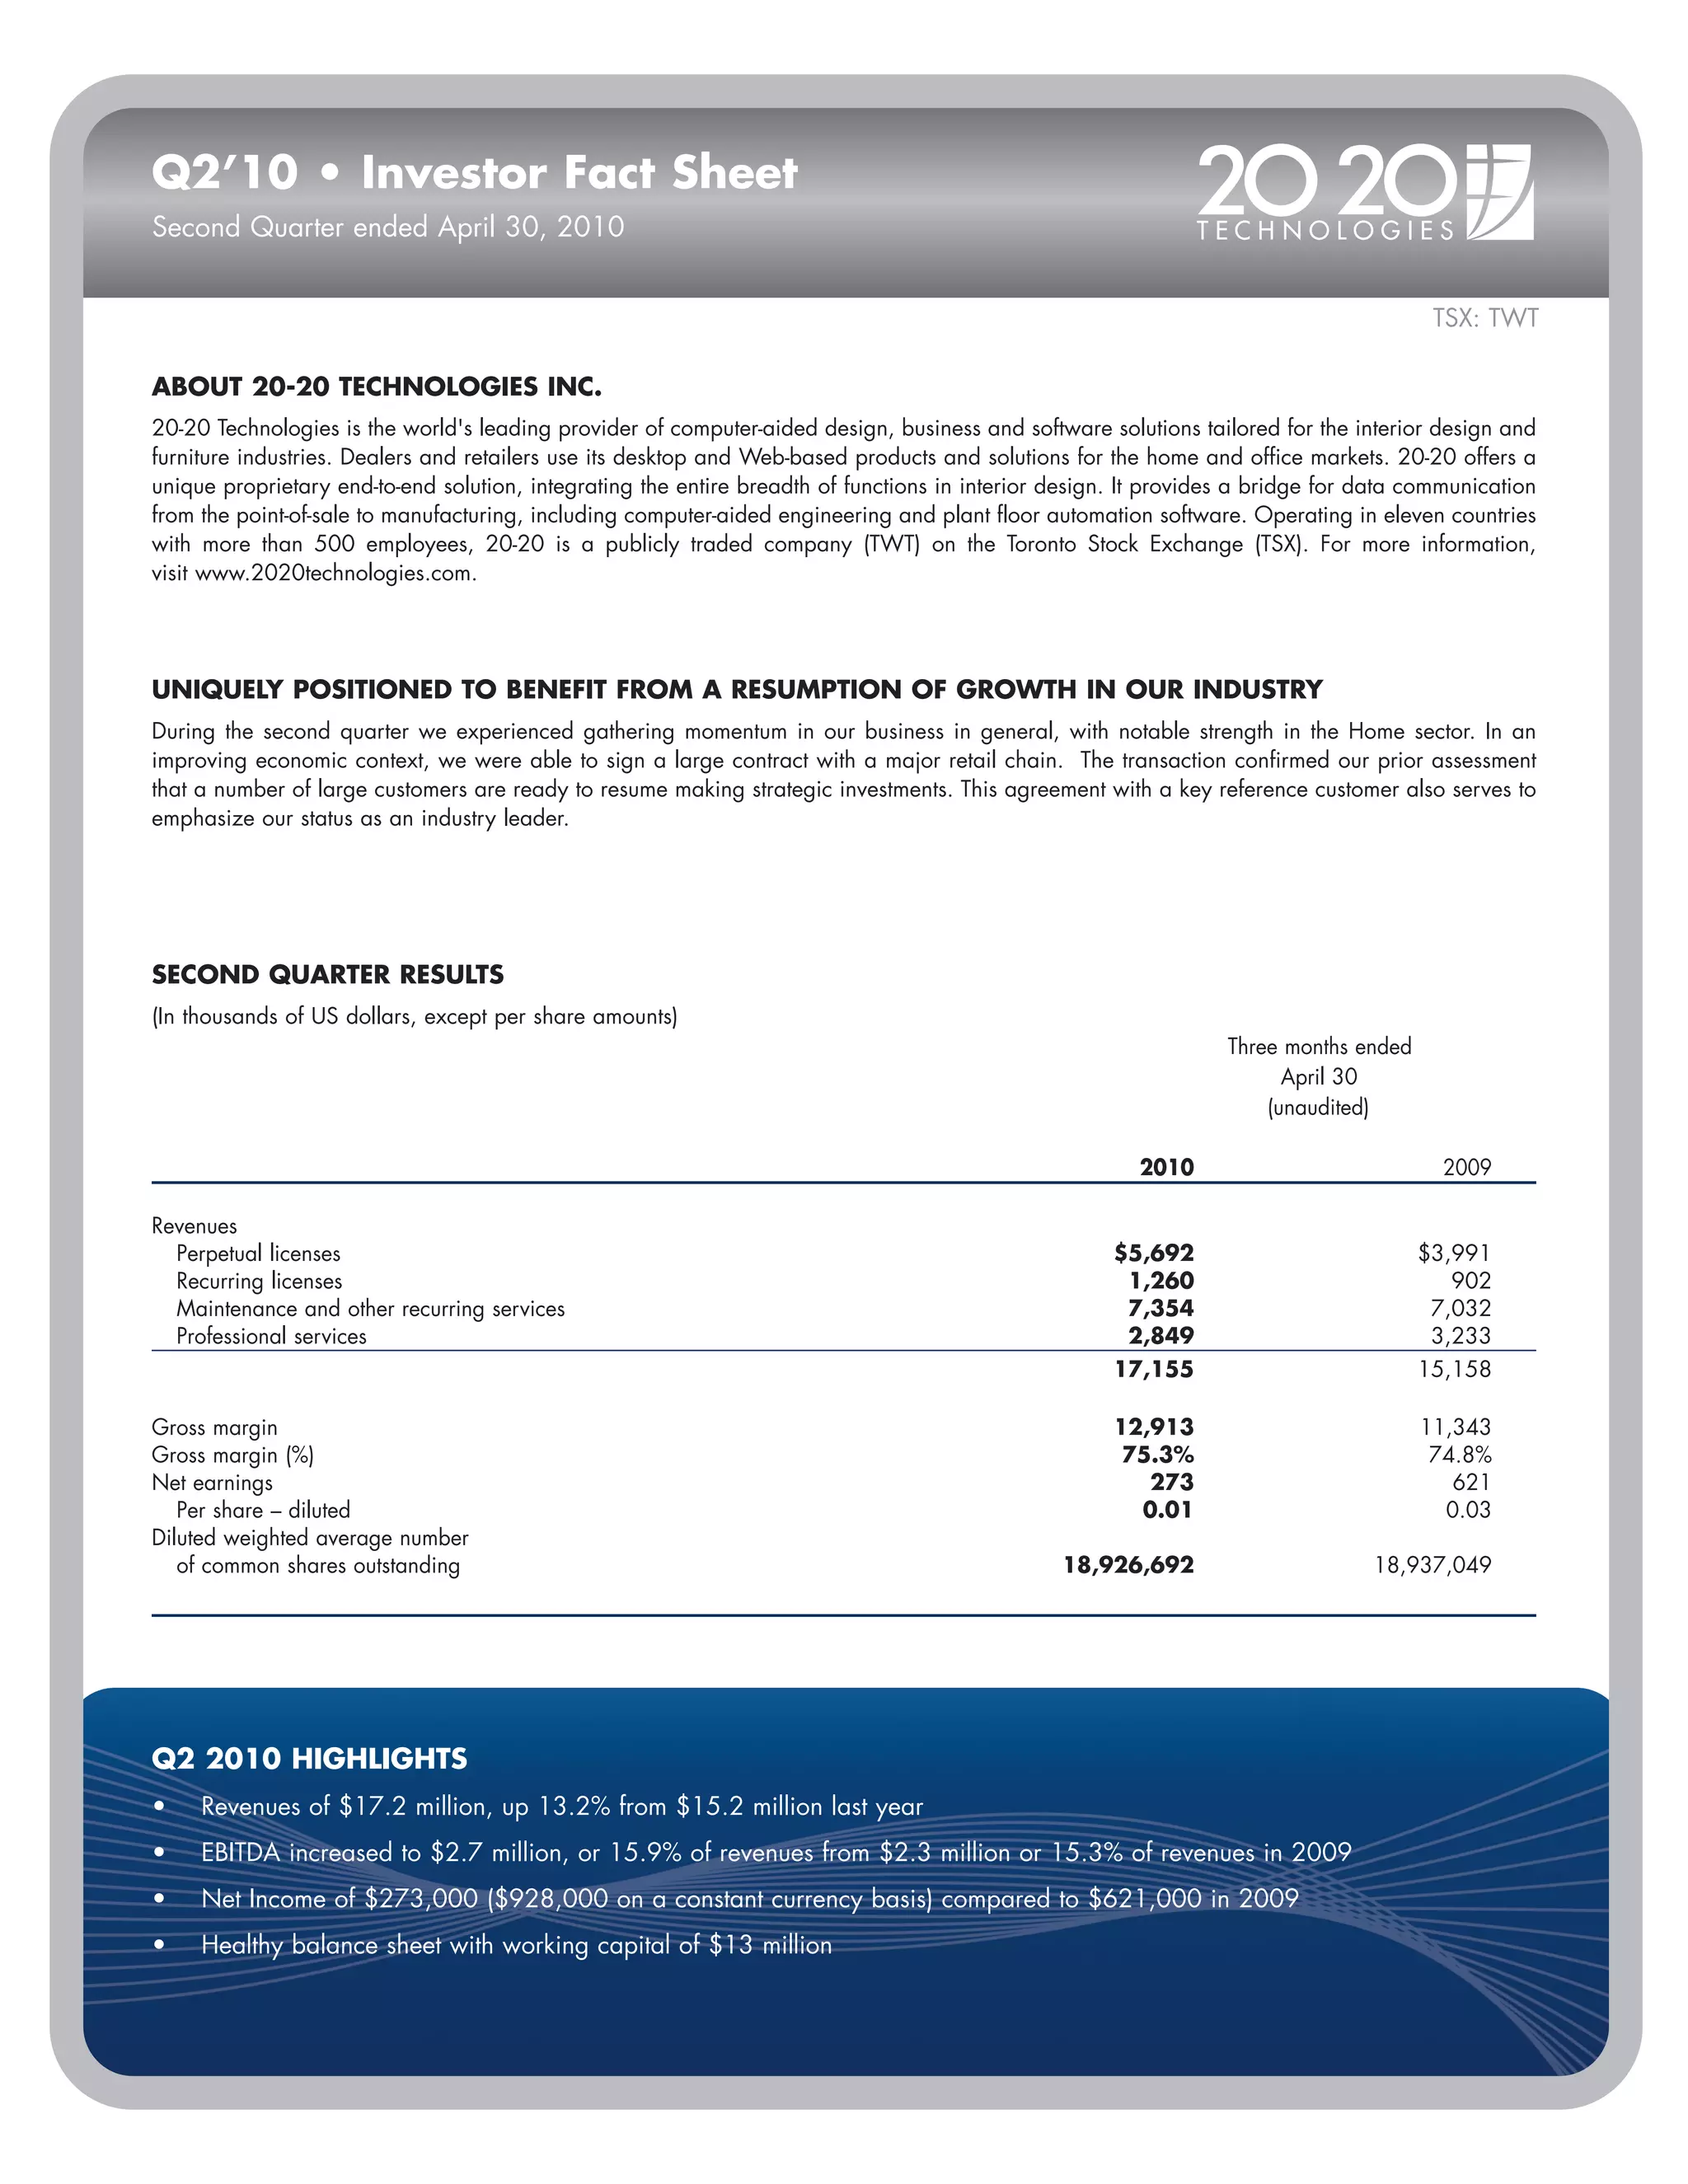
Q2’10 • Investor Fact Sheet
Second Quarter ended April 30, 2010


                                                                                                                                        TSX: TWT

ABOUT 20-20 TECHNOLOGIES INC.
20-20 Technologies is the world's leading provider of computer-aided design, business and software solutions tailored for the interior design and
furniture industries. Dealers and retailers use its desktop and Web-based products and solutions for the home and office markets. 20-20 offers a
unique proprietary end-to-end solution, integrating the entire breadth of functions in interior design. It provides a bridge for data communication
from the point-of-sale to manufacturing, including computer-aided engineering and plant floor automation software. Operating in eleven countries
with more than 500 employees, 20-20 is a publicly traded company (TWT) on the Toronto Stock Exchange (TSX). For more information,
visit www.2020technologies.com.


UNIQUELY POSITIONED TO BENEFIT FROM A RESUMPTION OF GROWTH IN OUR INDUSTRY
During the second quarter we experienced gathering momentum in our business in general, with notable strength in the Home sector. In an
improving economic context, we were able to sign a large contract with a major retail chain. The transaction confirmed our prior assessment
that a number of large customers are ready to resume making strategic investments. This agreement with a key reference customer also serves to
emphasize our status as an industry leader.


SECOND QUARTER RESULTS
(In thousands of US dollars, except per share amounts)
                                                                                                                  Three months ended
                                                                                                                        April 30
                                                                                                                      (unaudited)

                                                                                                        2010                             2009

Revenues
  Perpetual licenses                                                                                  $5,692                           $3,991
  Recurring licenses                                                                                   1,260                              902
  Maintenance and other recurring services                                                             7,354                            7,032
  Professional services                                                                                2,849                            3,233
                                                                                                      17,155                           15,158

Gross margin                                                                                          12,913                           11,343
Gross margin (%)                                                                                       75.3%                            74.8%
Net earnings                                                                                             273                              621
   Per share – diluted                                                                                  0.01                             0.03
Diluted weighted average number
   of common shares outstanding                                                                 18,926,692                       18,937,049


Q2 2010 HIGHLIGHTS
•    Revenues of $17.2 million, up 13.2% from $15.2 million last year
•    EBITDA increased to $2.7 million, or 15.9% of revenues from $2.3 million or 15.3% of revenues in 2009
•    Net Income of $273,000 ($928,000 on a constant currency basis) compared to $621,000 in 2009
•    Healthy balance sheet with working capital of $13 million
Geographic Distribution of Sales                                                                                         Revenues (in millions of US$)
                                                                                                                               Q1’09    Q2’09    Q3’09    Q4’09    Q1’10     Q2’10
                                                Q2’2010                     Q2’2009                                     25

                                                    3.1%                        2.4%                                    20
                   North America
                                                                                                                        15                                         16.6      17.2
                                                                                                                              15.6               16.1     16.2
                                                                                                                                        15.1
                   Europe                     37.4%                      40.8%
                                                           59.5%                      56.8%
                                                                                                                        10
                   Rest of the World
                                                                                                                         5


SECOND QUARTER REVIEW
Second quarter revenues increased 13.2% to $17.2 million compared with $15.2 million a year ago. The improvement was due to constant dollar
growth (11.0%) mainly related to improving market conditions in the U.S., particularly in the Home sector, and to a lesser extent from favorable
currency exchange rates (2.2%). For the quarter, all geographic sectors reported higher revenues, led by North America and International markets
with increases of 18.7% and 42.7%, respectively. The increase in European revenues of 3.7% was more modest considering the slow pace
of the European recovery.

Home sector revenues reached $10.7 million accounting for 62.2% of total revenues, up 33.4% over the previous year, fuelled by improving
economic conditions in the U.S. market, which was a key factor in helping secure a major contract with a leading retailer.

Manufacturing sector revenues accounting for 22.7% of total revenue, declined by 8.3% to $3.9 million and were down 20.4% sequentially over
good first quarter 2010 results. Customers in this sector generally remain cautious on long-term investments, which in turn impacts 20-20’s business
on a short term basis.

The Office sector remained soft reflecting continuing weak economic conditions with revenues reaching $2.6 million, down 10.9% over the previous
year and essentially flat on a sequential basis. As previously disclosed, the Company believes that this sector will lag the others in terms of recovery.

For the quarter, EBITDA increased to $2.7 million (15.9% of revenues) from $2.3 million (15.3% of revenues) a year ago. The negative impact
of currency exchange rates on operating income was significant and totaled $0.9 million. In constant dollars, the EBITDA margin for the quarter
would have exceeded 20%. Net earnings of $273,000 for the second quarter, or $0.01 per share, compared with net earnings of $621,000,
or $0.03 per share, a year ago. Earnings were negatively impacted by exchange losses of $975,000 ($243,000 in 2009) essentially attributable
to the translation of financial statements of our subsidiaries, which are denominated in European currencies.


A WORD FROM THE CEO
While solid second quarter licensing growth and many positive leading indicators are encouraging for our prospects in coming quarters, we
remain cautiously optimistic in view of the current situation in Europe. Our caution is also informed by the fact that revenues are mainly being
derived from large customers, with smaller clients largely remaining on the side lines.

Jean-François Grou
Chief Executive Officer
June 14, 2010


400 Armand Frappier Blvd, Suite 2020,
Laval, Quebec H7V 4B4, Tel: (514) 332-4110                      INVESTOR RELATIONS                                               STOCK INFORMATION
                                                                20-20 Technologies Inc.                                          as at June 14, 2010, in Canadian dollars)
MANAGEMENT                                                      Steve Perrone
Executive Chairman and                                          Tel.: (514) 332-4110                                             Share Price (TSX: TWT)               $3.25
Chief of Strategic Direction      Jean Mignault                 Email: steve.perrone@2020.net                                    52 Week High/Low             $3.90 - $1.52
Chief Executive Officer      Jean-François Grou                                                                                  Number of Shares Outstanding
Chief Financial Officer            Steve Perrone                MaisonBrison Communications                                      (as at June 14, 2010)          18.9 million
                                                                Pierre Boucher                                                   Market Capitalization         $61.4 million
                                                                Tel. : (514) 731-0000 ext.237                                    IPO Date                        Dec. 2004
ANALYST COVERAGE                                                Email: pierre@maisonbrison.com
Thanos Moschopoulos             BMO Capital Markets                                                                              For more information, please visit
Scott Penner                          TD Newcrest
                                                                                                                                 www.2020technologies.com

Certain statements contained in this fact sheet constitute forward-looking information within the meaning of securities laws. Implicit in this information, particularly in respect of future
operating results and economic performance of the Company are assumptions regarding projected revenue and expenses. These assumptions, although considered reasonable by the
Company at the time of preparation, may prove to be incorrect. Readers are cautioned that actual future operating results and economic performance of the Company are subject to a
number of risks and uncertainties, including general economic, market and business conditions and could differ materially from what is currently expected. For more exhaustive information
on these risks and uncertainties you should refer to our most recently filed annual information form which is available at www.sedar.com. Forward-looking information contained in this
document is based on management's current estimates, expectations and projections, which management believes are reasonable as of the current date. You should not place undue
importance on forward-looking information and should not rely upon this information as of any other date. While we may elect to, we are under no obligation and do not undertake to update
this information at any particular time, unless required by securities law.

Q2’ 2010 • investor fact sheet

  • 1.
    Q2’10 • InvestorFact Sheet Second Quarter ended April 30, 2010 TSX: TWT ABOUT 20-20 TECHNOLOGIES INC. 20-20 Technologies is the world's leading provider of computer-aided design, business and software solutions tailored for the interior design and furniture industries. Dealers and retailers use its desktop and Web-based products and solutions for the home and office markets. 20-20 offers a unique proprietary end-to-end solution, integrating the entire breadth of functions in interior design. It provides a bridge for data communication from the point-of-sale to manufacturing, including computer-aided engineering and plant floor automation software. Operating in eleven countries with more than 500 employees, 20-20 is a publicly traded company (TWT) on the Toronto Stock Exchange (TSX). For more information, visit www.2020technologies.com. UNIQUELY POSITIONED TO BENEFIT FROM A RESUMPTION OF GROWTH IN OUR INDUSTRY During the second quarter we experienced gathering momentum in our business in general, with notable strength in the Home sector. In an improving economic context, we were able to sign a large contract with a major retail chain. The transaction confirmed our prior assessment that a number of large customers are ready to resume making strategic investments. This agreement with a key reference customer also serves to emphasize our status as an industry leader. SECOND QUARTER RESULTS (In thousands of US dollars, except per share amounts) Three months ended April 30 (unaudited) 2010 2009 Revenues Perpetual licenses $5,692 $3,991 Recurring licenses 1,260 902 Maintenance and other recurring services 7,354 7,032 Professional services 2,849 3,233 17,155 15,158 Gross margin 12,913 11,343 Gross margin (%) 75.3% 74.8% Net earnings 273 621 Per share – diluted 0.01 0.03 Diluted weighted average number of common shares outstanding 18,926,692 18,937,049 Q2 2010 HIGHLIGHTS • Revenues of $17.2 million, up 13.2% from $15.2 million last year • EBITDA increased to $2.7 million, or 15.9% of revenues from $2.3 million or 15.3% of revenues in 2009 • Net Income of $273,000 ($928,000 on a constant currency basis) compared to $621,000 in 2009 • Healthy balance sheet with working capital of $13 million
  • 2.
    Geographic Distribution ofSales Revenues (in millions of US$) Q1’09 Q2’09 Q3’09 Q4’09 Q1’10 Q2’10 Q2’2010 Q2’2009 25 3.1% 2.4% 20 North America 15 16.6 17.2 15.6 16.1 16.2 15.1 Europe 37.4% 40.8% 59.5% 56.8% 10 Rest of the World 5 SECOND QUARTER REVIEW Second quarter revenues increased 13.2% to $17.2 million compared with $15.2 million a year ago. The improvement was due to constant dollar growth (11.0%) mainly related to improving market conditions in the U.S., particularly in the Home sector, and to a lesser extent from favorable currency exchange rates (2.2%). For the quarter, all geographic sectors reported higher revenues, led by North America and International markets with increases of 18.7% and 42.7%, respectively. The increase in European revenues of 3.7% was more modest considering the slow pace of the European recovery. Home sector revenues reached $10.7 million accounting for 62.2% of total revenues, up 33.4% over the previous year, fuelled by improving economic conditions in the U.S. market, which was a key factor in helping secure a major contract with a leading retailer. Manufacturing sector revenues accounting for 22.7% of total revenue, declined by 8.3% to $3.9 million and were down 20.4% sequentially over good first quarter 2010 results. Customers in this sector generally remain cautious on long-term investments, which in turn impacts 20-20’s business on a short term basis. The Office sector remained soft reflecting continuing weak economic conditions with revenues reaching $2.6 million, down 10.9% over the previous year and essentially flat on a sequential basis. As previously disclosed, the Company believes that this sector will lag the others in terms of recovery. For the quarter, EBITDA increased to $2.7 million (15.9% of revenues) from $2.3 million (15.3% of revenues) a year ago. The negative impact of currency exchange rates on operating income was significant and totaled $0.9 million. In constant dollars, the EBITDA margin for the quarter would have exceeded 20%. Net earnings of $273,000 for the second quarter, or $0.01 per share, compared with net earnings of $621,000, or $0.03 per share, a year ago. Earnings were negatively impacted by exchange losses of $975,000 ($243,000 in 2009) essentially attributable to the translation of financial statements of our subsidiaries, which are denominated in European currencies. A WORD FROM THE CEO While solid second quarter licensing growth and many positive leading indicators are encouraging for our prospects in coming quarters, we remain cautiously optimistic in view of the current situation in Europe. Our caution is also informed by the fact that revenues are mainly being derived from large customers, with smaller clients largely remaining on the side lines. Jean-François Grou Chief Executive Officer June 14, 2010 400 Armand Frappier Blvd, Suite 2020, Laval, Quebec H7V 4B4, Tel: (514) 332-4110 INVESTOR RELATIONS STOCK INFORMATION 20-20 Technologies Inc. as at June 14, 2010, in Canadian dollars) MANAGEMENT Steve Perrone Executive Chairman and Tel.: (514) 332-4110 Share Price (TSX: TWT) $3.25 Chief of Strategic Direction Jean Mignault Email: steve.perrone@2020.net 52 Week High/Low $3.90 - $1.52 Chief Executive Officer Jean-François Grou Number of Shares Outstanding Chief Financial Officer Steve Perrone MaisonBrison Communications (as at June 14, 2010) 18.9 million Pierre Boucher Market Capitalization $61.4 million Tel. : (514) 731-0000 ext.237 IPO Date Dec. 2004 ANALYST COVERAGE Email: pierre@maisonbrison.com Thanos Moschopoulos BMO Capital Markets For more information, please visit Scott Penner TD Newcrest www.2020technologies.com Certain statements contained in this fact sheet constitute forward-looking information within the meaning of securities laws. Implicit in this information, particularly in respect of future operating results and economic performance of the Company are assumptions regarding projected revenue and expenses. These assumptions, although considered reasonable by the Company at the time of preparation, may prove to be incorrect. Readers are cautioned that actual future operating results and economic performance of the Company are subject to a number of risks and uncertainties, including general economic, market and business conditions and could differ materially from what is currently expected. For more exhaustive information on these risks and uncertainties you should refer to our most recently filed annual information form which is available at www.sedar.com. Forward-looking information contained in this document is based on management's current estimates, expectations and projections, which management believes are reasonable as of the current date. You should not place undue importance on forward-looking information and should not rely upon this information as of any other date. While we may elect to, we are under no obligation and do not undertake to update this information at any particular time, unless required by securities law.