Download to read offline


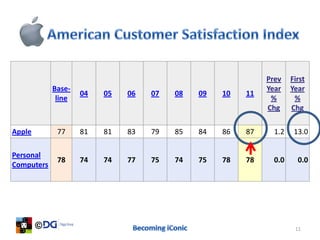
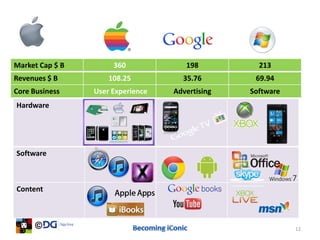
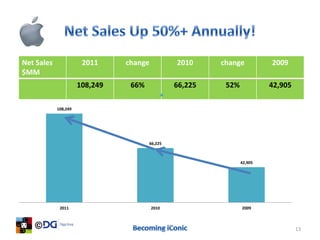
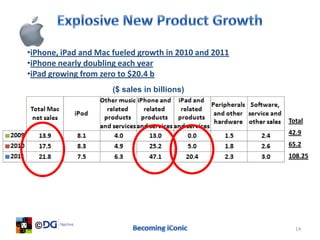
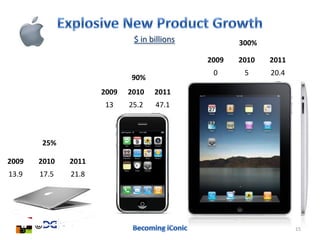
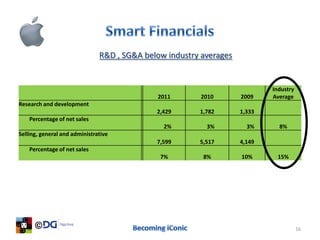
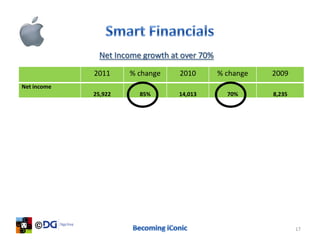
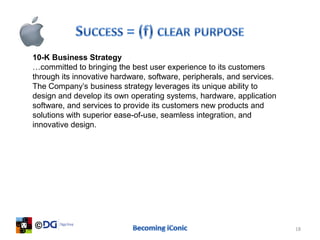


The document presents financial and operational highlights of major companies including Apple and Google from 2009 to 2011, emphasizing Apple’s significant revenue growth driven by its iPhone and iPad products. It details Apple’s competitive advantage in user experience and innovation through its integrated hardware and software design. Additionally, the document notes Apple's net income growth rate surpassing 70% in 2011 and outlines its business strategy focused on enhancing customer experience.


