More Related Content

PDF

PDF
Async design with Unity3D 
PDF

PDF

PDF
配管流路の多目的最適化OpenFOAM+OpenMDAO(第28回オープンCAE勉強会@関西) 
PDF

KEY
PyOpenCLによるGPGPU入門 Tokyo.SciPy#4 編 
PDF
ALPSチュートリアル(6) Matplotlib入門 What's hot

PDF

PDF

PDF

PDF
effective modern c++ chapeter36 
PDF

PPT

PPTX
Node.js - sleep sort algorithm 
PDF

PPTX

PDF

PDF

PDF

PDF

PPT

PDF

PDF
Continuation with Boost.Context 
PDF

PDF

PDF

PDF
Similar to Python で munin plugin を書いてみる

PDF
ソフトウェアエンジニアのための「機械学習理論」入門・ハンズオン演習ガイド 
PDF

PDF

KEY

PPTX

PDF

PDF

KEY

PPTX
Radon (Python大阪勉強会 2014.10.21) 
PDF
Introduction to Chainer and CuPy 
PDF
(Pythonで作って学ぶ) Youtube の動画リストを作るアプリの開発
第2回 
PDF
2日間Fabricを触った俺が
色々解説してみる 
PDF
Pythonによる機械学習入門〜基礎からDeep Learningまで〜 
PDF
Easy caching and logging package using annotation in Python 
PPTX
東大生向けデータ解析講座 第2回 2017/12/29 
PDF
Pythonによる並列プログラミング -GPGPUも- 
KEY
![[db analytics showcase Sapporo 2017] A15: Pythonでの分散処理再入門 by 株式会社HPCソリューションズ ...](https://cdn.slidesharecdn.com/ss_thumbnails/dbtechshowcase-sapporo-2017-iisaka-170707075724-thumbnail.jpg?width=640&height=640&fit=bounds)
PDF
[db analytics showcase Sapporo 2017] A15: Pythonでの分散処理再入門 by 株式会社HPCソリューションズ ... 
PDF
Introduction to NumPy & SciPy 
PDF
A_road_to_AMBER_simulations_ver_1.0 Python で munin plugin を書いてみる
- 1.
- 2.
自己紹介
● となか(@ftnk)
● インフラエンジニア
○ Solaris / Puppet / Nagios / munin / GrowthForecast /
serverspec etc.
○ Python はまれに運用・監視用のスクリプトを書く
■ shell script だと面倒で Ruby がない環境の時
■ まれにしか書かないので、覚えない
● 開発?
○ 最近、serverspec に Solairs 用の matcher 追加
の pull request を送ったりしてます
- 3.
agenda
1. 今回の目的
2. munin?
3. munin plugin ?
4. munin plugin の構成
5. python-munin
6. cpu 使用率の plugin を書く
(ただし、Solaris)
7. まとめ
- 4.
- 5.
munin ?
● muninはリソース監視ツール
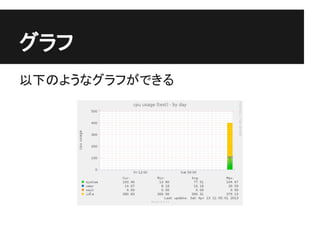
○ リソースの値を取得してグラフ化
● 類似のツール
○ mrtg / cacti / CloudForecast / GrowthForecast etc.
- 6.
- 7.
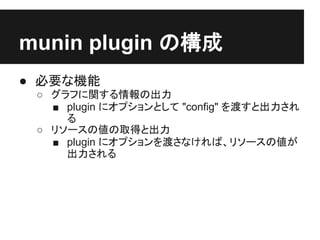
munin plugin の構成
●必要な機能
○ グラフに関する情報の出力
■ plugin にオプションとして "config" を渡すと出力され
る
○ リソースの値の取得と出力
■ plugin にオプションを渡さなければ、リソースの値が
出力される
- 8.
- 9.
- 10.
- 11.
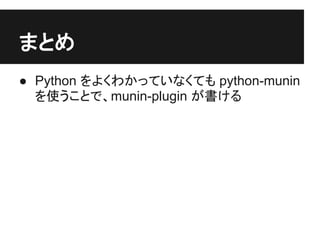
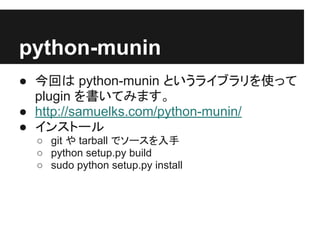
python-munin
● 今回は python-muninというライブラリを使って
plugin を書いてみます。
● http://samuelks.com/python-munin/
● インストール
○ git や tarball でソースを入手
○ python setup.py build
○ sudo python setup.py install
- 12.
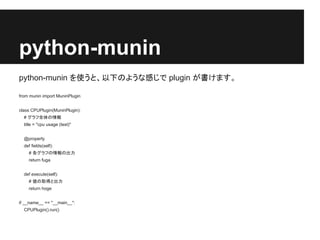
python-munin
python-munin を使うと、以下のような感じで pluginが書けます。
from munin import MuninPlugin
class CPUPlugin(MuninPlugin):
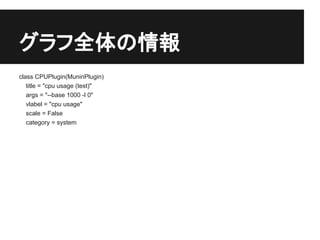
# グラフ全体の情報
title = "cpu usage (test)"
@property
def fields(self):
# 各グラフの情報の出力
return fuga
def execute(self):
# 値の取得と出力
return hoge
if __name__ == "__main__":
CPUPlugin().run()
- 13.
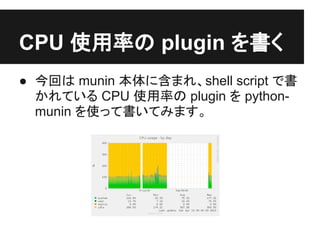
CPU 使用率の pluginを書く
● 今回は munin 本体に含まれ、shell script で書
かれている CPU 使用率の plugin を python-
munin を使って書いてみます。
- 14.
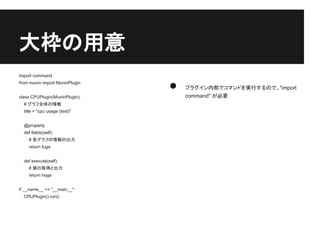
大枠の用意
import command
from muninimport MuninPlugin
● プラグイン内部でコマンドを実行するので、"import
class CPUPlugin(MuninPlugin): command" が必要
# グラフ全体の情報
title = "cpu usage (test)"
@property
def fields(self):
# 各グラフの情報の出力
return fuga
def execute(self):
# 値の取得と出力
return hoge
if __name__ == "__main__":
CPUPlugin().run()
- 15.
- 16.
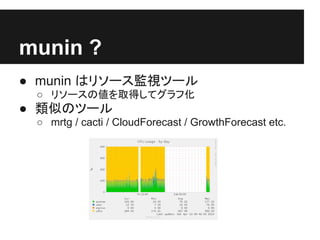
個々のグラフの情報
def fields(self):
retun [ ● 個々のグラフの情報をリストでまとめて返しま
("kernel", dict( す
label = "system",
draw = "AREA",
● 各グラフの情報は辞書にまとめます
min = "0",
type = "DERIVE",
● グラフの描画に前回取得した値との差を使う
ので、type が "DERIVE" です
)),
("user", dict(
label = "system",
● グラフは塗り潰しで積み重ねるので、 1 つ目
のグラフの draw を "AREA"、2 つ目以降の
draw = "STACK", グラフの draw を "STACK" にします
min = "0",
type = "DERIVE",
)),
(省略)
]
- 17.
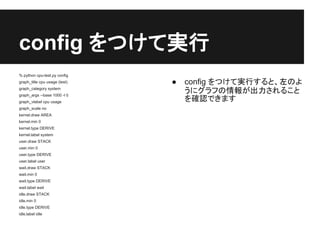
config をつけて実行
% pythoncpu-test.py config
graph_title cpu usage (test) ● config をつけて実行すると、左のよ
graph_category system
graph_args --base 1000 -l 0
うにグラフの情報が出力されること
graph_vlabel cpu usage を確認できます
graph_scale no
kernel.draw AREA
kernel.min 0
kernel.type DERIVE
kernel.label system
user.draw STACK
user.min 0
user.type DERIVE
user.label user
wait.draw STACK
wait.min 0
wait.type DERIVE
wait.label wait
idle.draw STACK
idle.min 0
idle.type DERIVE
idle.label idle
- 18.
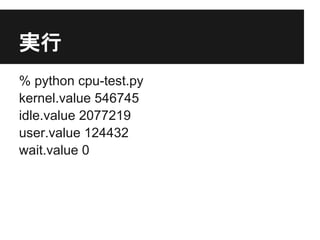
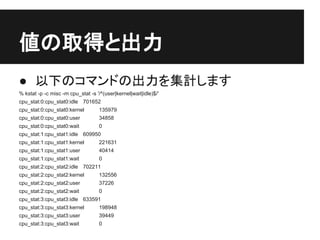
値の取得と出力
● 以下のコマンドの出力を集計します
% kstat-p -c misc -m cpu_stat -s '/^(user|kernel|wait|idle)$/'
cpu_stat:0:cpu_stat0:idle 701652
cpu_stat:0:cpu_stat0:kernel 135979
cpu_stat:0:cpu_stat0:user 34858
cpu_stat:0:cpu_stat0:wait 0
cpu_stat:1:cpu_stat1:idle 609950
cpu_stat:1:cpu_stat1:kernel 221631
cpu_stat:1:cpu_stat1:user 40414
cpu_stat:1:cpu_stat1:wait 0
cpu_stat:2:cpu_stat2:idle 702211
cpu_stat:2:cpu_stat2:kernel 132556
cpu_stat:2:cpu_stat2:user 37226
cpu_stat:2:cpu_stat2:wait 0
cpu_stat:3:cpu_stat3:idle 633591
cpu_stat:3:cpu_stat3:kernel 198948
cpu_stat:3:cpu_stat3:user 39449
cpu_stat:3:cpu_stat3:wait 0
- 19.
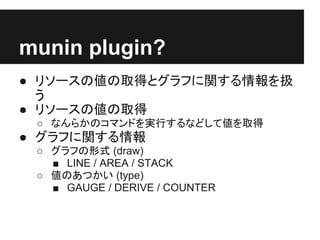
値の取得
def execute(self):
stats = commands.getoutput(
● commands.getoutput で
"kstat -p -c misc -m cpu_stat -s '/^ コマンドの実行結果を取
(user|kernel|wait|idle)$?/'" )
得
values = { 'idle':0, 'kernel':0, 'wait':0, 'idle':0 } ● 値は辞書で返す
for i in stats.splitlines():
● 集計のため 0 で初期化
key, value = i.split(':')[-1].split('t') ● コマンドの実行結果を行ご
values[key] += int(value)
とに処理して集計
return values
- 20.
- 21.
- 22.

![個々のグラフの情報
def fields(self):
retun [ ● 個々のグラフの情報をリストでまとめて返しま
("kernel", dict( す
label = "system",
draw = "AREA",
● 各グラフの情報は辞書にまとめます
min = "0",
type = "DERIVE",
● グラフの描画に前回取得した値との差を使う
ので、type が "DERIVE" です
)),
("user", dict(
label = "system",
● グラフは塗り潰しで積み重ねるので、 1 つ目
のグラフの draw を "AREA"、2 つ目以降の
draw = "STACK", グラフの draw を "STACK" にします
min = "0",
type = "DERIVE",
)),
(省略)
]](https://image.slidesharecdn.com/pythonmuninplugin-130413221901-phpapp01/85/Python-munin-plugin-16-320.jpg)
![値の取得
def execute(self):
stats = commands.getoutput(
● commands.getoutput で
"kstat -p -c misc -m cpu_stat -s '/^ コマンドの実行結果を取
(user|kernel|wait|idle)$?/'" )
得
values = { 'idle':0, 'kernel':0, 'wait':0, 'idle':0 } ● 値は辞書で返す
for i in stats.splitlines():
● 集計のため 0 で初期化
key, value = i.split(':')[-1].split('t') ● コマンドの実行結果を行ご
values[key] += int(value)
とに処理して集計
return values](https://image.slidesharecdn.com/pythonmuninplugin-130413221901-phpapp01/85/Python-munin-plugin-19-320.jpg)