More Related Content
Similar to PPF_7800_underlying_data
Similar to PPF_7800_underlying_data (20)
PPF_7800_underlying_data
- 1. PPF 7800 Data
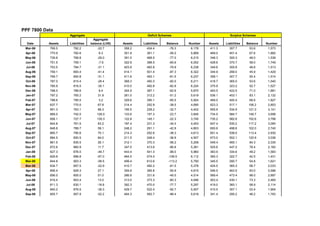
Date Assets Liabilities
Aggregate
balance (LHS) Assets Liabilities Balance Number Assets Liabilities Balance Number
Mar-06 769.5 792.2 -22.7 358.2 434.4 -76.3 6,178 411.3 357.7 53.6 1,573
Apr-06 770.9 762.6 8.3 301.9 361.1 -59.2 5,869 469.0 401.4 67.6 1,882
May-06 739.8 768.8 -29.0 391.5 468.5 -77.0 6,215 348.3 300.3 48.0 1,536
Jun-06 751.5 759.1 -7.6 322.9 388.5 -65.6 6,002 428.6 370.7 58.0 1,749
Jul-06 753.5 784.7 -31.1 403.9 483.9 -79.9 6,238 349.6 300.8 48.8 1,513
Aug-06 759.1 800.4 -41.4 414.1 501.4 -87.3 6,322 344.9 299.0 45.9 1,429
Sep-06 769.7 800.8 -31.1 411.6 493.1 -81.5 6,237 358.1 307.7 50.4 1,514
Oct-06 787.0 815.4 -28.4 368.3 450.3 -82.0 6,211 418.7 365.0 53.6 1,540
Nov-06 785.9 816.0 -30.1 410.0 492.8 -82.8 6,224 375.9 323.2 52.7 1,527
Dec-06 798.0 789.6 8.4 304.5 367.1 -62.6 5,870 493.5 422.5 71.0 1,881
Jan-07 797.2 765.2 31.9 261.0 312.2 -51.2 5,619 536.1 453.1 83.1 2,132
Feb-07 798.6 795.5 3.2 329.6 395.1 -65.5 5,924 469.0 400.4 68.6 1,827
Mar-07 837.7 770.0 67.8 214.4 252.9 -38.5 4,690 623.3 517.1 106.2 2,853
Apr-07 851.3 763.1 88.3 195.5 228.2 -32.7 4,402 655.9 534.9 121.0 3,141
May-07 868.0 742.0 126.0 133.6 157.3 -23.7 3,845 734.5 584.7 149.7 3,698
Jun-07 858.1 727.7 130.3 122.8 145.1 -22.3 3,745 735.2 582.6 152.6 3,798
Jul-07 844.8 761.5 83.2 197.4 231.3 -34.0 4,453 647.4 530.2 117.2 3,090
Aug-07 848.8 789.7 59.1 248.2 291.1 -42.9 4,803 600.6 498.6 102.0 2,740
Sep-07 865.7 790.6 75.1 214.3 252.6 -38.3 4,613 651.4 538.0 113.4 2,930
Oct-07 884.5 800.5 84.0 211.5 248.4 -36.9 4,507 673.0 552.1 120.9 3,036
Nov-07 861.5 835.5 26.1 312.1 370.3 -58.2 5,208 549.4 465.1 84.3 2,335
Dec-07 872.6 860.9 11.7 347.0 413.6 -66.6 5,361 525.6 447.2 78.4 2,182
Jan-08 827.3 876.0 -48.7 443.4 541.3 -98.0 5,960 383.9 334.6 49.2 1,583
Feb-08 829.8 896.8 -67.0 464.5 574.0 -109.5 6,112 365.3 322.7 42.5 1,431
Mar-08 844.8 903.3 -58.5 499.4 612.6 -113.2 5,790 345.5 290.7 54.8 1,621
Mar-08 834.7 857.5 -22.9 410.7 492.2 -81.5 5,378 424.0 365.3 58.7 2,033
Apr-08 856.4 829.3 27.1 309.9 365.8 -55.9 4,815 546.5 463.5 83.0 2,596
May-08 856.0 805.0 51.0 286.6 331.6 -45.0 4,514 569.4 473.4 96.0 2,897
Jun-08 816.4 803.4 13.0 313.0 373.3 -60.3 4,946 503.4 430.1 73.3 2,465
Jul-08 811.3 830.1 -18.8 392.3 470.0 -77.7 5,297 419.0 360.1 58.9 2,114
Aug-08 840.2 879.5 -39.3 429.7 522.4 -92.7 5,507 410.5 357.1 53.4 1,904
Sep-08 805.7 857.9 -52.2 464.3 562.7 -98.4 5,618 341.4 295.2 46.2 1,793
Aggregate Deficit Schemes Surplus Schemes
- 2. Oct-08 743.6 821.2 -77.6 450.6 563.1 -112.5 5,832 293.0 258.0 34.9 1,579
Nov-08 749.5 873.4 -123.9 529.2 678.2 -149.0 6,135 220.3 195.3 25.0 1,276
Dec-08 789.2 979.8 -190.6 645.9 854.7 -208.7 6,443 143.2 125.2 18.1 968
Jan-09 744.6 928.2 -183.6 607.6 807.7 -200.1 6,438 137.0 120.5 16.4 973
Feb-09 723.1 927.8 -204.7 597.4 815.3 -218.0 6,507 125.7 112.4 13.3 904
Mar-09 772.7 964.9 -192.2 620.9 829.5 -208.6 5,603 151.8 135.4 16.5 1,050
Apr-09 795.3 934.8 -139.5 607.6 770.4 -162.9 5,357 187.8 164.4 23.4 1,296
May-09 800.8 931.1 -130.2 606.9 761.8 -155.0 5,307 193.9 169.2 24.7 1,346
Jun-09 794.1 943.4 -149.2 611.8 783.4 -171.6 5,400 182.3 160.0 22.4 1,253
Jul-09 819.8 928.5 -108.7 587.8 725.8 -138.0 5,167 232.0 202.7 29.3 1,486
Aug-09 856.4 981.2 -124.8 629.0 782.8 -153.8 5,236 227.4 198.4 29.0 1,417
Sep-09 880.2 978.9 -98.8 619.7 753.1 -133.4 5,066 260.5 225.9 34.6 1,587
Oct-09 865.1 983.2 -118.1 629.9 778.6 -148.7 5,198 235.3 204.7 30.6 1,455
Oct-09 865.1 909.1 -44.0 503.5 596.7 -93.2 4,632 361.6 312.4 49.2 2,021
Nov-09 884.7 922.4 -37.7 497.7 587.6 -89.9 4,575 387.0 334.7 52.2 2,078
Dec-09 892.2 872.2 19.9 370.6 425.7 -55.1 3,991 521.6 446.5 75.0 2,662
Jan-10 880.3 879.4 0.9 397.8 462.4 -64.6 4,208 482.5 417.0 65.5 2,445
Feb-10 901.1 864.0 37.2 306.2 353.3 -47.1 3,801 594.9 510.7 84.2 2,852
Mar-10 926.2 887.9 38.3 293.3 342.4 -49.1 3,770 632.9 545.5 87.4 2,826
Apr-10 925.0 889.4 35.6 303.4 353.6 -50.2 3,808 621.6 535.8 85.8 2,788
May-10 908.9 913.3 -4.4 429.8 499.7 -69.9 4,258 479.1 413.6 65.5 2,338
Jun-10 892.7 931.2 -38.5 498.9 590.2 -91.4 4,534 393.9 341.0 52.9 2,062
Jul-10 911.7 922.2 -10.5 444.3 518.0 -73.7 4,292 467.4 404.2 63.2 2,268
Aug-10 924.4 998.2 -73.8 559.5 678.1 -118.6 4,757 364.9 320.1 44.8 1,803
Sep-10 951.7 991.9 -40.2 528.9 624.6 -95.7 4,498 422.8 367.3 55.5 2,062
Oct-10 957.1 962.2 -5.1 457.1 530.6 -73.4 4,244 500.0 431.6 68.3 2,316
Nov-10 951.1 952.1 -1.0 446.2 516.9 -70.7 4,202 504.8 435.2 69.7 2,358
Dec-10 983.4 961.7 21.7 374.7 435.7 -61.0 3,953 608.7 526.0 82.7 2,607
Jan-11 973.3 927.2 46.1 301.9 350.7 -48.8 3,696 671.5 576.5 95.0 2,864
Feb-11 986.0 937.5 48.4 307.9 356.7 -48.8 3,675 678.0 580.8 97.2 2,885
Mar-11 973.5 936.6 36.9 343.9 404.9 -61.0 3,607 629.6 531.8 97.9 2,825
Apr-11 973.5 969.7 3.8 389.0 465.5 -76.5 3,945 584.5 504.2 80.3 2,487
Apr-11 987.4 995.6 -8.2 417.1 501.3 -84.3 4,052 570.3 494.3 76.0 2,380
May-11 989.3 1,013.8 -24.5 461.0 554.6 -93.7 4,164 528.4 459.2 69.2 2,268
Jun-11 988.8 1,006.6 -17.7 455.3 545.0 -89.7 4,122 533.5 461.5 72.0 2,310
Jul-11 989.0 1,067.0 -78.0 587.1 716.7 -129.6 4,571 401.8 350.2 51.6 1,861
- 3. Aug-11 966.6 1,092.7 -126.1 646.7 811.2 -164.5 4,891 319.9 281.5 38.4 1,541
Sep-11 960.4 1,165.9 -205.5 746.5 978.2 -231.7 5,258 213.9 187.7 26.2 1,174
Oct-11 993.4 1,165.2 -171.8 748.5 953.1 -204.6 5,084 244.9 212.1 32.9 1,348
Nov-11 1001.4 1,236.0 -234.6 792.8 1,053.5 -260.8 5,305 208.6 182.4 26.1 1,127
Dec-11 1013.1 1,283.9 -270.8 820.3 1,114.1 -293.9 5,412 192.9 169.8 23.1 1,020
Jan-12 1031.2 1,296.8 -265.6 827.4 1,117.3 -289.9 5,388 203.8 179.5 24.3 1,044
Feb-12 1041.3 1,263.5 -222.2 810.6 1,062.0 -251.4 5,235 230.7 201.4 29.2 1,197
Mar-12 1026.8 1,231.1 -204.2 806.4 1,037.4 -231.0 5,022 220.5 193.7 26.8 1,294
Apr-12 1022.1 1,237.1 -215.0 817.2 1,057.5 -240.2 5,073 204.8 179.6 25.3 1,243
May-12 1024.5 1,341.5 -317.0 870.0 1,202.8 -332.9 5,404 154.6 138.7 15.9 912
Jun-12 1032.6 1,304.1 -271.6 846.9 1,138.4 -291.5 5,267 185.7 165.7 20.0 1,049
Jul-12 1048.9 1,341.5 -292.6 867.6 1,179.0 -311.4 5,314 181.3 162.6 18.7 1,002
Aug-12 1053.1 1,343.5 -290.3 869.4 1,179.0 -309.5 5,300 183.7 164.5 19.2 1,016
Sep-12 1055.5 1,294.9 -239.4 847.5 1,110.6 -263.1 5,128 208.0 184.3 23.7 1,188
Oct-12 1052.5 1,288.2 -235.7 850.3 1,110.6 -260.2 5,160 202.2 177.7 24.5 1,156
Nov-12 1063.8 1,316.0 -252.2 861.6 1,137.3 -275.7 5,205 202.2 178.7 23.5 1,111
Dec-12 1065.6 1,310.3 -244.7 861.0 1,130.1 -269.1 5,173 204.6 180.2 24.4 1,143
Jan-13 1084.3 1,295.5 -211.2 859.9 1,100.4 -240.4 5,031 224.4 195.1 29.3 1,285
Feb-13 1104.6 1,306.1 -201.5 865.5 1,098.6 -233.1 4,973 239.1 207.5 31.6 1,343
Mar-13 1118.5 1,329.2 -210.8 852.9 1,098.7 -245.8 4,806 265.6 230.6 35.0 1,344
Apr-13 1127.4 1,358.8 -231.3 878.4 1,142.7 -264.3 4,882 249.1 216.1 32.9 1,268
May-13 1126.3 1,284.7 -158.4 806.1 1,008.2 -202.1 4,570 320.1 276.5 43.7 1,580
Jun-13 1098.0 1,202.9 -104.9 692.3 850.4 -158.1 4,327 405.7 352.5 53.2 1,823
Jul-13 1126.1 1,214.4 -88.3 689.6 837.6 -147.9 4,178 436.5 376.8 59.7 1,972
Aug-13 1105.9 1,186.2 -80.3 667.0 807.8 -140.8 4,145 438.9 378.4 60.5 2,005
Sep-13 1114.0 1,199.0 -85.0 677.9 822.7 -144.8 4,173 436.1 376.3 59.8 1,977
Oct-13 1139.1 1,214.7 -75.6 677.5 817.6 -140.1 4,063 461.6 397.1 64.5 2,087
Nov-13 1132.9 1,192.5 -59.7 642.3 770.7 -128.4 3,952 490.5 421.8 68.7 2,198
Dec-13 1133.0 1,160.5 -27.6 590.5 697.4 -106.9 3,701 542.5 463.1 79.4 2,449
Jan-14 1130.4 1,206.8 -76.5 673.5 813.2 -139.7 4,108 456.9 393.7 63.2 2,042
Feb-14 1148.6 1,209.8 -61.2 647.6 778.0 -130.4 3,947 501.0 431.7 69.3 2,203
Mar-14 1137.5 1,176.8 -39.3 616.8 735.8 -119.0 3,834 520.7 441.0 79.7 2,223
Apr-14 1143.3 1,184.0 -40.8 623.4 744.1 -120.7 3,827 519.9 439.9 80.0 2,230
May-14 1159.1 1,208.3 -49.2 646.3 773.9 -127.7 3,873 512.8 434.4 78.4 2,184
May-14 1159.1 1,247.5 -88.4 704.0 855.0 -151.0 4,132 455.1 392.5 62.6 1,925
Jun-14 1155.7 1,232.5 -76.8 692.1 834.4 -142.3 4,078 463.6 398.1 65.5 1,979
- 4. Jul-14 1161.3 1254.5 -93.2 721.1 875.7 -154.6 4,178 440.2 378.8 61.5 1,879
Aug-14 1195.5 1347.0 -151.6 817.1 1019.2 -202.1 4,493 378.4 327.9 50.5 1,564
Sep-14 1186.0 1330.3 -144.3 806.0 1001.6 -195.6 4,472 380.0 328.7 51.3 1,585
Oct-14 1198.5 1363.5 -164.9 832.0 1045.0 -213.0 4,570 366.5 318.4 48.1 1,487
Nov-14 1232.9 1454.0 -221.1 895.1 1156.7 -261.6 4,781 337.8 297.3 40.4 1,276
Dec-14 1236.6 1502.9 -266.3 957.0 1257.7 -300.7 4,936 279.6 245.2 34.3 1,121
Jan-15 1273.8 1641.2 -367.5 1037.4 1430.0 -392.6 5,175 236.4 211.2 25.2 882
Feb-15 1263.4 1512.1 -248.7 958.8 1245.6 -286.8 4,849 304.5 266.5 38.1 1,208
Mar-15 1298.3 1542.5 -244.2 965.3 1250.6 -285.3 4,677 333.0 291.9 41.1 1,268
Apr-15 1258.7 1489.6 -230.8 934.5 1208.1 -273.5 4,679 324.2 281.5 42.7 1,266
May-15 1266.3 1495.4 -229.1 939.0 1211.7 -272.6 4,670 327.3 283.7 43.6 1,275
Jun-15 1232.0 1441.6 -209.6 877.3 1131.4 -254.1 4,634 354.7 310.2 44.5 1,311
Jul-15 1250.6 1487.1 -236.5 934.3 1212.4 -278.1 4,704 316.2 274.7 41.6 1,241
Aug-15 1229.0 1489.6 -260.6 937.5 1235.0 -297.5 4,809 291.5 254.6 36.9 1,136
Sep-15 1226.6 1513.9 -287.3 950.7 1271.4 -320.7 4,892 276.0 242.6 33.4 1,053
Oct-15 1242.3 1486.7 -244.4 935.4 1219.6 -284.2 4,750 306.9 267.1 39.8 1,195
Nov-15 1253.8 1503.2 -249.4 945.3 1234.8 -289.5 4,751 308.5 268.4 40.1 1,194
Dec-15 1247.5 1469.8 -222.4 894.2 1160.0 -265.8 4,679 353.2 309.8 43.4 1,266
Jan-16 1258.7 1563.6 -304.9 981.4 1319.8 -338.4 4,923 277.4 243.8 33.6 1,022
Feb-16 1272.7 1595.5 -322.8 1002.3 1357.6 -355.3 4,956 270.4 237.9 32.5 989
Mar-16 1287.9 1590.0 -302.1 1000.4 1338.4 -337.9 4,891 287.5 251.7 35.8 1,054
These figures are based on the old actuarial assumptions
These figures are based on the new actuarial assumptions effective from 31 March 2008
These figures are based on the old actuarial assumptions
These figures are based on the new actuarial assumptions effective from 31 October 2009
These figures are based on the old actuarial assumptions
These figures are based on the new actuarial assumptions effective from 1 April 2011