Download to read offline
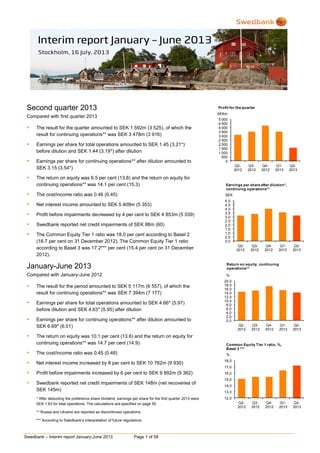


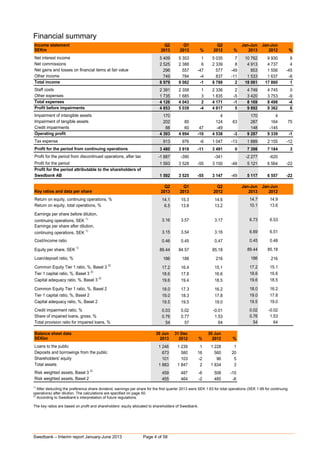


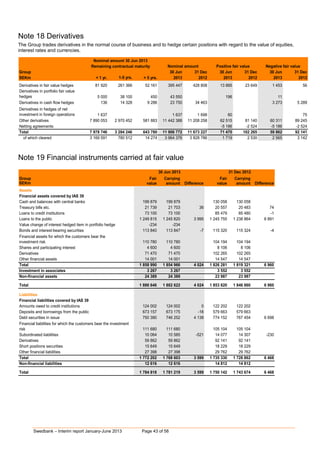


The document summarizes Swedbank's financial results for the second quarter and first half of 2013. Key points include: - Net profit for Q2 was SEK 1.6 billion, down from SEK 3.5 billion in Q2 2012, mainly due to losses from discontinued operations in Ukraine. - Net interest income increased 1% in Q2 and 8% for the first half compared to the same periods in 2012. - The Common Equity Tier 1 capital ratio strengthened to 17.2% according to Basel 3 standards at the end of Q2. - Total assets grew 3% to SEK 1,883 billion from the end of June 2012, while risk-weighted assets declined under both


