Download to read offline

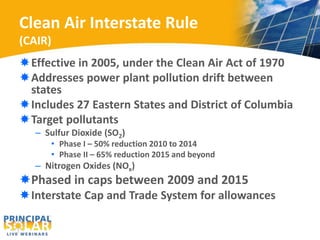
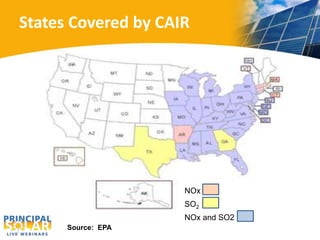
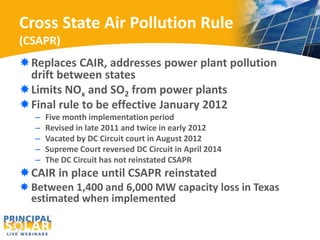
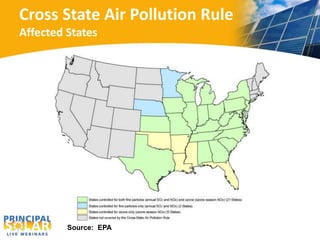
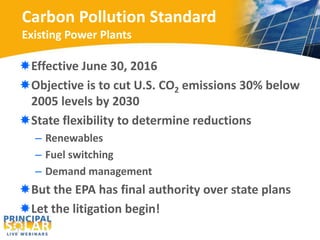
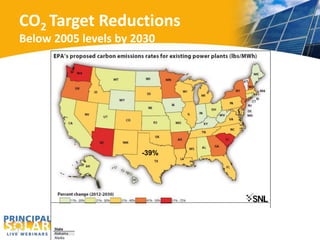
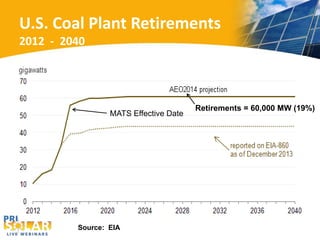
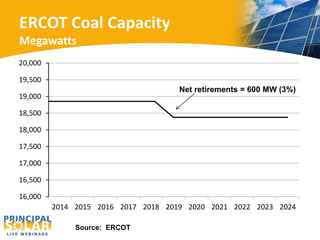
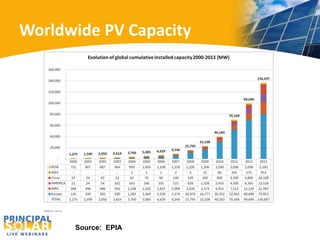
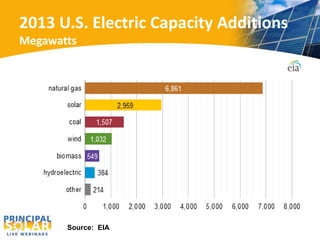
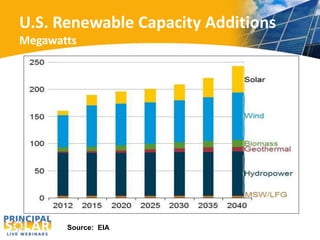
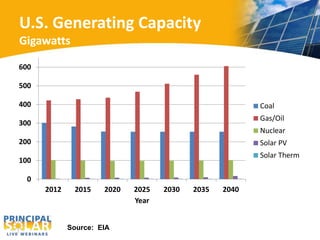
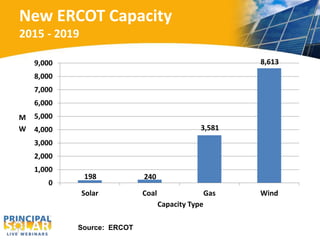
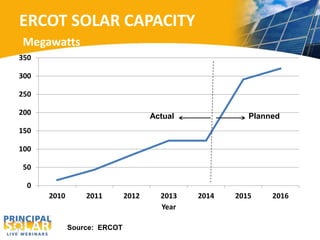
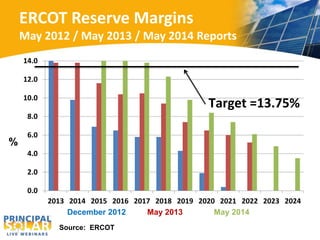
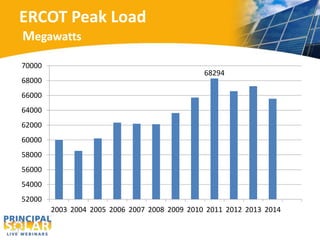
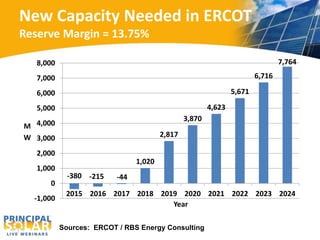
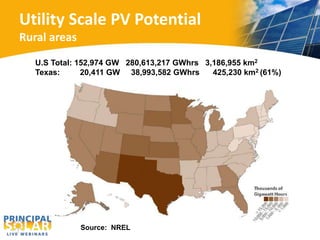
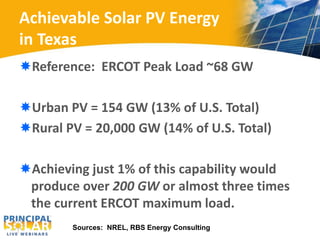


The document discusses the decline of coal power in the U.S. due to new EPA regulations and the retirement of coal plants, and explores alternative energy sources, particularly solar power's potential in the ERCOT market. It highlights various regulations such as the Clean Air Interstate Rule and Carbon Pollution Standards aimed at reducing emissions from power plants. Additionally, the document presents capacity data and projections for renewable energy growth, emphasizing the significant solar potential available in Texas.


