1
All data/information usedin the preparation of this material is dated and may or may not be relevant any time after the issuance of this material. ICICI Prudential Asset Management
Company Limited (the Portfolio Manager/ the AMC) takes no responsibility of updating any data/information in this material from time to time. The recipient of this material is solely
responsible for any action taken based on this material. The information contained herein are meant solely for the benefit of the addressee and shall not be altered in any way,
transmitted to, copied or distributed, in part or in whole, to any other person or to the media or reproduced in any form, without prior written consent of the AMC. Further, the information
contained herein should not be construed as forecast or promise. Past performance of the Portfolio Manager may not be indicative of the performance in the future. Please refer to page
22 for risk factors and disclaimers.
2.
2
Index
2
Presenting ICICI PrudentialPMS PIPE Strategy
II
III
IV
Investment Framework
I Key Drivers of Stock Price
Current Strategy Positioning & Performance
4
Drivers of StockPrice
The aforesaid factors/framework are only indicative. There may be other factors that may be relevant for determination of stock prices. P/E – Price to earnings, EPS – Earnings per share, RoE – Return on Equity
Fundamentally
Driven
Function of RoE and
Capital Allocation
Price EPS
= x P/E
Price Benefitting from Both Earnings growth & P/E rerating.
5.
5
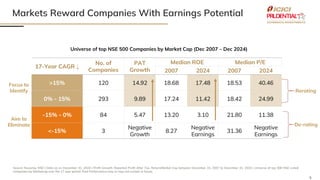
Markets Reward CompaniesWith Earnings Potential
Source: Nuvama, NSE | Data as on December 31, 2024 | Profit Growth: Reported Profit After Tax. Return/Market Cap between December 31, 2007 to December 31, 2024 | Universe of top 500 NSE Listed
companies by Marketcap over the 17 year period. Past Performance may or may not sustain in future.
17-Year CAGR ↓
No. of
Companies
PAT
Growth
Median ROE Median P/E
2007 2024 2007 2024
>15% 120 14.92 18.68 17.48 18.53 40.46
0% - 15% 293 9.89 17.24 11.42 18.42 24.99
-15% - 0% 84 5.47 13.20 3.10 21.80 11.38
<-15% 3
Negative
Growth
8.27
Negative
Earnings
31.36
Negative
Earnings
Rerating
De-rating
Universe of top NSE 500 Companies by Market Cap (Dec 2007 – Dec 2024)
Focus to
Identify
Aim to
Eliminate
7
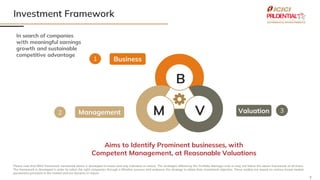
Investment Framework
In searchof companies
with meaningful earnings
growth and sustainable
competitive advantage
Aims to Identify Prominent businesses, with
Competent Management, at Reasonable Valuations
Business
Valuation
Management
B
M V
1
2 3
Please note that BMV framework mentioned above is developed in house and only indicative in nature. The strategies offered by the Portfolio Manager may or may not follow the above framework at all times.
The framework is developed in order to select the right companies through a filtration process and endeavor the strategy to attain their investment objective. These models are based on various broad market
parameters prevalent in the market and are dynamic in nature.
8.
8
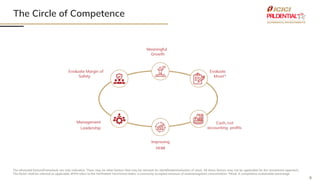
The Circle ofCompetence
The aforesaid factors/framework are only indicative. There may be other factors that may be relevant for identification/selection of stock. All these factors may not be applicable for the investment approach,
The factor shall be referred as applicable. #HHI refers to the Herfindahl–Hirschman Index, a commonly accepted measure of market/segment concentration. *Moat: A competitive sustainable advantage
Meaningful
Growth
Evaluate Margin of
Safety
Evaluate
Moat*
Cash, not
accounting profits
Management
Leadership
Improving
HHI#
9.
9
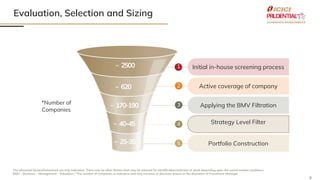
Evaluation, Selection andSizing
The aforesaid factors/framework are only indicative. There may be other factors that may be relevant for identification/selection of stock depending upon the varied market conditions.
BMV – Business – Management – Valuation | *The number of companies is indicative and may increase or decrease based on the discretion of Investment Manager.
*Number of
Companies
Initial in-house screening process
Active coverage of company
Applying the BMV Filtration
Strategy Level Filter
Portfolio Construction
1
2
3
4
5
~ 570
~120-160
~40-45
~ 2500
~25-30
~ 620
~ 170-190
~ 40-45
~ 2500
~ 25-35
10.
10
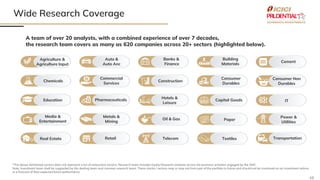
Wide Research Coverage
Ateam of over 20 analysts, with a combined experience of over 7 decades,
the research team covers as many as 620 companies across 20+ sectors (highlighted below).
Auto &
Auto Anc
Agriculture &
Agriculture Input
Cement
Building
Materials
Banks &
Finance
Commercial
Services
Chemicals
Consumer Non
Durables
Consumer
Durables
Construction
Hotels &
Leisure
Pharmaceuticals
Media &
Entertainment
IT
Capital Goods
Oil & Gas
Metals &
Mining
Power &
Utilities
Paper
Retail
Real Estate Transportation
Textiles
Telecom
Education
*The above mentioned sectors does not represent a list of exhaustive sectors. Research team includes Equity Research analysts across the business activities engaged by the AMC .
Note: Investment team shall be supported by the dealing team and common research team. These stocks / sectors may or may not form part of the portfolio in future and should not be construed as an investment advice
or a forecast of their expected future performance.
11.
11
Experienced Investment Team
**Wehave an integrated common research team which includes Equity Research analysts across the business activities engaged by ICICI Prudential Asset Management Company Ltd. Note: Portfolio Managers
form a part of the Investment team and they shall be supported by the dealing and research teams. *Sandip Santdasani is Fund Manager for certain AIF Schemes. #Ankur Pandey provides investment support to the
Investment team
Sr. Fund Manager
Chockalingam Narayanan Geetika Gupta
Sr. Fund Manager
Sandip Santdasani
Fund Manager*
Ankur Pandey#
Quantitative Specialist
Prem Khurana
Sr. Fund Manager Sr. Fund Manager – AIF
AIF Investments (Hedged)
Paul S Parampreet
Supported by Equity
Research Analysts**
Anand Shah
CIO – PMS & AIF
Anand Shah brings over two
decades of experience in fund
management. He holds a PGDM
from IIM Lucknow and a B.E.
degree from Regional Engineering
College, Surat.
13
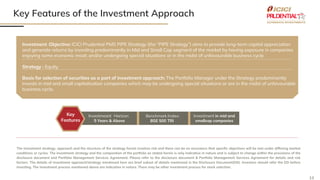
Key Features ofthe Investment Approach
The investment strategy, approach and the structure of the strategy herein involves risk and there can be no assurance that specific objectives will be met under differing market
conditions or cycles. The investment strategy and the composition of the portfolio as stated herein is only indicative in nature and is subject to change within the provisions of the
disclosure document and Portfolio Management Services Agreement. Please refer to the disclosure document & Portfolio Management Services Agreement for details and risk
factors. The details of investment approach/strategy mentioned here are brief subset of details mentioned in the Disclosure Document(DD). Investors should refer the DD before
investing. The investment process mentioned above are indicative in nature. There may be other investment process for stock selection.
Investment Objective: ICICI Prudential PMS PIPE Strategy (the “PIPE Strategy”) aims to provide long-term capital appreciation
and generate returns by investing predominantly in Mid and Small Cap segment of the market by having exposure in companies
enjoying some economic moat; and/or undergoing special situations or in the midst of unfavourable business cycle.
Strategy : Equity
Basis for selection of securities as a part of investment approach: The Portfolio Manager under the Strategy predominantly
invests in mid and small capitalisation companies which may be undergoing special situations or are in the midst of unfavourable
business cycle.
Investmeant Horizon:
5 Years & Above
Investment in mid and
smallcap companies
Benchmark Index:
BSE 500 TRI
Key
Features
14.
14
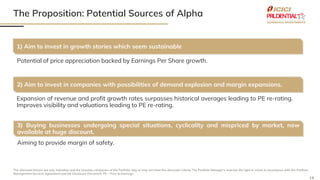
The Proposition: PotentialSources of Alpha
1) Aim to invest in growth stories which seem sustainable
Potential of price appreciation backed by Earnings Per Share growth.
2) Aim to invest in companies with possibilities of demand explosion and margin expansions.
Expansion of revenue and profit growth rates surpasses historical averages leading to PE re-rating.
Improves visibility and valuations leading to PE re-rating.
3) Buying businesses undergoing special situations, cyclicality and mispriced by market, now
available at huge discount.
Aiming to provide margin of safety.
The aforesaid factors are only indicative and the investee companies of the Portfolio may or may not meet the aforesaid criteria. The Portfolio Manager’s reserves the right to invest in accordance with the Portfolio
Management Services Agreement and the Disclosure Document. PE – Price to Earnings
15.
15
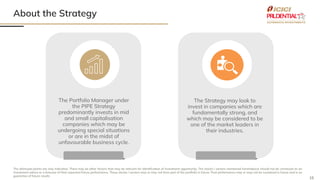
About the Strategy
Theaforesaid points are only indicative. There may be other factors that may be relevant for identification of investment opportunity. The stocks / sectors mentioned hereinabove should not be construed as an
investment advice or a forecast of their expected future performance. These stocks / sectors may or may not form part of the portfolio in future. Past performance may or may not be sustained in future and is no
guarantee of future results
The Portfolio Manager under
the PIPE Strategy
predominantly invests in mid
and small capitalisation
companies which may be
undergoing special situations
or are in the midst of
unfavourable business cycle.
The Strategy may look to
invest in companies which are
fundamentally strong, and
which may be considered to be
one of the market leaders in
their industries.
17
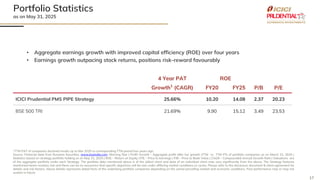
Portfolio Statistics
as onMay 31, 2025
• Aggregate earnings growth with improved capital efficiency (ROE) over four years
• Earnings growth outpacing stock returns, positions risk-reward favourably
4 Year PAT ROE
Growth1
(CAGR) FY20 FY25 P/B P/E
ICICI Prudential PMS PIPE Strategy 25.66% 10.20 14.08 2.37 20.23
BSE 500 TRI 21.69% 9.90 15.12 3.49 23.53
1TTM PAT of companies declared results up to Mar 2025 vs corresponding TTM period four years ago
Source: Financial data from Nuvama Securities, www.bseindia.com, Morning Star | Profit Growth - Aggregate profit after tax growth (TTM vs TTM PY) of portfolio companies as on March 31, 2025 |
Statistics based on strategy portfolio holding as on May 31, 2025 | ROE – Return on Equity | P/E – Price to Earnings | P/B – Price to Book Value | CAGR – Compounded Annual Growth Rate | Valuations are
of the aggregate portfolio under each Strategy. The portfolio data mentioned above is of the oldest client and data of an individual client may vary significantly from the above. The Strategy features
mentioned herein involves risk and there can be no assurance that specific objectives will be met under differing market conditions or cycles. Please refer to the disclosure document & client agreement for
details and risk factors. Above details represents dated facts of the underlying portfolio companies depending on the varied prevailing market and economic conditions. Past performance may or may not
sustain in future.
18.
18
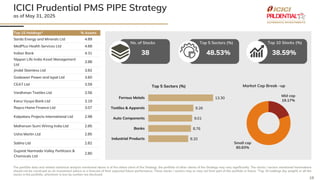
ICICI Prudential PMSPIPE Strategy
as of May 31, 2025
The portfolio data and related statistical analysis mentioned above is of the oldest client of the Strategy, the portfolio of other clients of the Strategy may vary significantly. The stocks / sectors mentioned hereinabove
should not be construed as an investment advice or a forecast of their expected future performance. These stocks / sectors may or may not form part of the portfolio in future. *Top 15 holdings (by weight) or all the
stocks in the portfolio, whichever is less by number are disclosed.
No. of Stocks
8.20
8.76
9.01
9.26
13.30
0.0 5.0 10.0 15.0
Industrial Products
Banks
Auto Components
Textiles & Apparels
Ferrous Metals
Top 5 Sectors (%)
Mid cap
19.17%
Small cap
80.83%
Market Cap Break –up
Top 5 Sectors (%) Top 10 Stocks (%)
Top 15 Holdings* % Assets
Sarda Energy and Minerals Ltd 4.89
MedPlus Health Services Ltd 4.68
Indian Bank 4.31
Nippon Life India Asset Management
Ltd
3.88
Jindal Stainless Ltd 3.82
Godawari Power and Ispat Ltd 3.60
CEAT Ltd 3.59
Vardhman Textiles Ltd 3.56
Karur Vysya Bank Ltd 3.19
Repco Home Finance Ltd 3.07
Kalpataru Projects International Ltd 2.98
Motherson Sumi Wiring India Ltd 2.85
Usha Martin Ltd 2.85
Sobha Ltd 2.82
Gujarat Narmada Valley Fertilizers &
Chemicals Ltd
2.80
38 48.53% 38.59%
19.
19
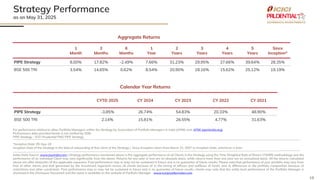
Strategy Performance
as onMay 31, 2025
For performance relative to other Portfolio Managers within the Strategy by Association of Portfolio Managers in India (APMI) visit: APMI (apmiindia.org).
Performance data provided herein is not verified by SEBI.
PIPE Strategy – ICICI Prudential PMS PIPE Strategy
*Inception Date: 05–Sep-19
Inception Date of the Strategy is the date of onboarding of first client of the Strategy | Since inception return from March 31, 2007 or Inception Date, whichever is later.
Index Data Source: www.bseindia.com | Strategy performance mentioned above is the aggregate performance of all Clients in the Strategy using the Time Weighted Rate of Return (TWRR) methodology and the
performance of an individual Client may vary significantly from the above. Returns for one year or less are on absolute basis, while returns more than one year are on annualized basis. All the returns calculated
above are after deduction of the applicable expenses. Past performance may or may not be sustained in future and is no guarantee of future results. Please note that performance of your portfolio may vary from
that of other clients and that generated by the Investment Approach across all clients because of 1) the timing of inflows and outflows of funds; and 2) differences in the portfolio composition because of
restrictions and other constraints. Past performance may or may not be sustained in future and is no guarantee of future results. clients may note that the entity level performance of the Portfolio Manager is
disclosed in the Disclosure Document and the same is available on the website of Portfolio Manager - www.iciciprualternates.com
Aggregate Returns
1
Month
3
Months
6
Months
1
Year
2
Years
3
Years
4
Years
5
Years
Since
Inception*
PIPE Strategy 8.00% 17.82% -2.49% 7.66% 31.23% 29.95% 27.66% 39.64% 28.35%
BSE 500 TRI 3.54% 14.65% 0.62% 8.54% 20.90% 18.16% 15.62% 25.12% 19.19%
Calendar Year Returns
CYTD 2025 CY 2024 CY 2023 CY 2022 CY 2021
PIPE Strategy -3.85% 26.74% 54.83% 20.33% 48.90%
BSE 500 TRI 2.14% 15.81% 26.55% 4.77% 31.63%
20.
20
Key Highlights ofThe Investment Approach
The investment strategy, approach and the structure of the strategy herein involves risk and there can be no assurance that specific objectives will be met under differing market conditions or cycles. The
investment strategy and the composition of the portfolio as stated herein is only indicative in nature and is subject to change within the provisions of the disclosure document and client agreement
without any prior notice to investors. Please refer to the disclosure document & client agreement for details and risk factors. Investment Objective in line with Disclosure Document (DD). Basis of selection
of securities, mentioned here are brief subset of details mentioned in the DD. Investors should refer the DD before investing and the same is available on the website of Portfolio Manager –
www.iciciprualternates.com
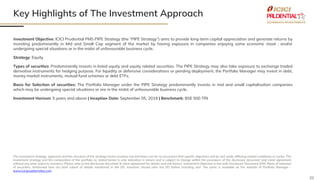
Investment Objective: ICICI Prudential PMS PIPE Strategy (the “PIPE Strategy”) aims to provide long-term capital appreciation and generate returns by
investing predominantly in Mid and Small Cap segment of the market by having exposure in companies enjoying some economic moat ; and/or
undergoing special situations or in the midst of unfavourable business cycle.
Strategy: Equity
Types of securities: Predominantly invests in listed equity and equity related securities. The PIPE Strategy may also take exposure to exchange traded
derivative instruments for hedging purpose. For liquidity or defensive considerations or pending deployment, the Portfolio Manager may invest in debt,
money market instruments, mutual fund schemes or debt ETFs.
Basis for Selection of securities: The Portfolio Manager under the PIPE Strategy predominantly invests in mid and small capitalisation companies
which may be undergoing special situations or are in the midst of unfavourable business cycle.
Investment Horizon: 5 years and above | Inception Date: September 05, 2019 | Benchmark: BSE 500 TRI
21.
21
Strategy Specific Risks& Disclaimer
The above mentioned risk factors and general risk factors relating to the Portfolio are elaborated in the 'Risk Factors' section of the Disclosure Document. Investors should refer the DD before investing and the
same is available on the website of Portfolio Manager – www.iciciprualternates.com
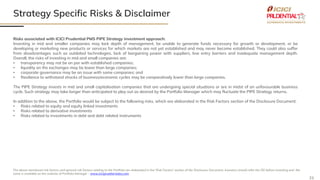
Risks associated with ICICI Prudential PMS PIPE Strategy investment approach:
Investing in mid and smaller companies may lack depth of management, be unable to generate funds necessary for growth or development, or be
developing or marketing new products or services for which markets are not yet established and may never become established. They could also suffer
from disadvantages such as outdated technologies, lack of bargaining power with suppliers, low entry barriers and inadequate management depth.
Overall, the risks of investing in mid and small companies are:
• transparency may not be on par with established companies;
• liquidity on the exchanges may be lower than large companies;
• corporate governance may be an issue with some companies; and
• Resilience to withstand shocks of business/economic cycles may be comparatively lower than large companies.
The PIPE Strategy invests in mid and small capitalisation companies that are undergoing special situations or are in midst of an unfavourable business
cycle. Such strategy may take longer than anticipated to play out as desired by the Portfolio Manager which may fluctuate the PIPE Strategy returns.
In addition to the above, the Portfolio would be subject to the following risks, which are elaborated in the Risk Factors section of the Disclosure Document:
• Risks related to equity and equity linked investments
• Risks related to derivative investments
• Risks related to investments in debt and debt related instruments
22.
22
Risk Factors &Disclaimers
Mr. Anand Shah is the CIO of PMS & AIF. He oversees all PMS Strategies offered by ICICI Prudential Asset Management Company Limited (the AMC/ Portfolio Manager). The performance of the stock
across Individual portfolios may vary significantly from the data depicted above. This is due to factors such as timing of entry and exit, timing of additional flows and redemptions, individual client
mandates, specific portfolio construction characteristics or structural parameters which may have a bearing on individual portfolio performance. No claims may be made or entertained for any
variances between the above performance depictions and that of the stock within individual client portfolios. There is no assurance that the value may be unlocked during our holding period of the
stock. Investors may note that the entity level performance of the Portfolio Manager is disclosed in the Disclosure Document and the same is available on the website of Portfolio Manager –
www.iciciprualternates.com. Performance data provided herein is not verified by SEBI.
Direct Option Investors may invest with us directly as well. To invest in any of our PMS strategies directly, kindly write to us at PMS@icicipruamc.com
Investment in securities involves investment risks such as trading volumes, settlement risk, liquidity risk, default risk including the possible loss of principal. The value of the portfolio may be affected by
changes in the general market conditions, factors and forces affecting capital market. There can be no assurance that the objective of the Portfolio would be achieved. Investors are advised to refer to
the Disclosure Document, Portfolio Management Services Agreement and other related documents carefully and consult their legal, tax and financial advisors to determine possible legal, tax and
financial or any other consequences of investing/ redeeming under this Portfolio, before making a decision. Please note that performance of one investor in the portfolio may vary significantly from that
of other investors and that generated by the Investment Approach across all investors because of 1) the timing of inflows and outflows of funds; and 2) differences in the portfolio composition because
of restrictions and other constraints.
The details pertaining to the investment approach mentioned herein is a subset of details specified in the Disclosure Document. Kindly refer the Disclosure Document for the detailed investment
approach, including specific risk factors, before investing. The stock(s)/Sector(s) mentioned in this material do not constitute any recommendation of the same and the portfolios may or may not have
any future positions in these Stock(s)/Sector(s). The composition of the portfolio is subject to changes within the provisions of the Disclosure Document. The benchmark of the portfolios can be
changed from time to time in the future in accordance with the regulatory provisions. No claims may be made or entertained for any variances between the performance depictions and individual
portfolio performance or for any losses (notional or real) or against any loss of opportunity for gain under various PMS Strategies. The Portfolio Manager (including its affiliates) and any of its
employee/officers’, directors shall not liable for any loss, damage of any nature, including but not limited to direct, indirect, punitive, exemplary, consequential, as also any loss of profit in any way
arising from the use of this material in any manner. The recipient(s) alone shall be fully responsible/are liable for any decision taken on the basis of this material. The investments discussed in this may
not be suitable for all investors. Please note that past performance of the financial strategies, instruments and the portfolio does not necessarily indicate the future prospects and performance thereof.
Such past performance may or may not be sustained in future. The investors are not being offered any guaranteed or assured returns.
In the preparation of this material, the Portfolio Manager has used information that is publicly available, including information developed in-house. Some of the material used herein may have been
obtained from members/persons other than the Portfolio Manager and/or its affiliates and which may have been made available to the Portfolio Manager and/ or to its affiliates. Information gathered
and material used herein is believed to be from reliable sources. The Portfolio Manager however does not warrant the accuracy, reasonableness and/or completeness of any information. For data
reference to any third party in this material no such party will assume any liability for the same. The Portfolio Manager has included statements/opinions/recommendations in this material, which
contain words, or phrases such as “will”, “expect”, “should”, “believe” and similar expressions or variations of such expressions, that are “forward looking statements”. Actual results may differ
materially from those suggested by the forward looking statements due to risk or uncertainties associated with our expectations with respect to, but not limited to, exposure to market risks, general
economic and political conditions in India and other countries globally, the money and interest policies of India, inflation, unanticipated turbulence in interest rates, foreign exchange rates, equity prices,
the performance of the financial markets in India and globally, changes in domestic and foreign laws, regulations and taxes and changes in competition in the industry.
All data/ information used in the preparation of this material is dated as mentioned in the portfolio data and may or may not be relevant any time after the issuance of this material. The Portfolio
Manager takes no responsibility of updating any data/information in this material from time to time. ICICI Prudential Asset Management Company Limited is registered with SEBI as a Portfolio
Manager vide registration number INP000000373.