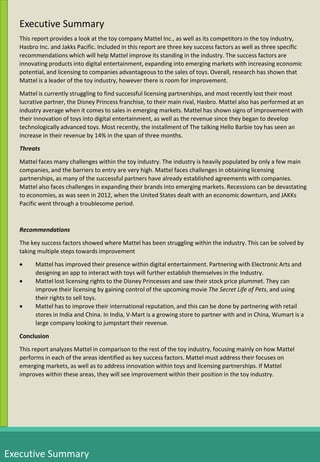
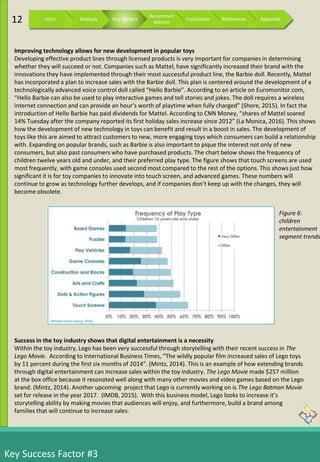
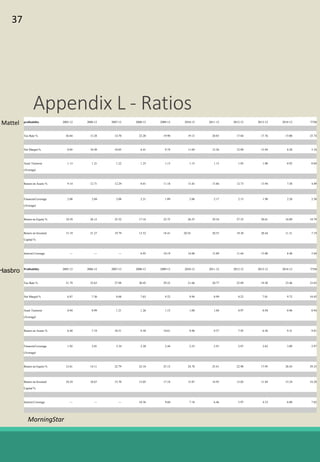
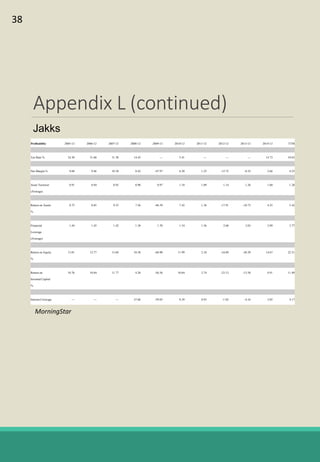
Date: February 14, 2016
To: Paul Benedict, Jamie Lambert, Nadège Levallet, Catherine Penrod, and Lee Wakeman
From: MID 107 Team 4: John Bland, Parker Foard, Kyle Kuhar, Paul McMahon and Vincent
Stubbs
Subject: The Toy Industry and Mattel, Inc. Company Analysis
This report, as requested by the Copeland & Associates Faculty Members, describes the toy industry as a
whole, and more specifically focuses on Mattel, Inc. and its leading competitors Hasbro Inc. and JAKKS
Pacific. The overall research has given us an understanding of the industry, the key success factors of
this industry, and we have created recommendations to Mattel, Inc. that we believe will help them
succeed.
The key success factors for the Toy Industry are as follows:
· Innovating products into digital entertainment
· Expansion into emerging markets with increasing economic potential
· Licensing with companies advantageous to the sales of toys
Our primary research was the skype session with Jessyca Durchin Schnepp on February 3, 2016.
Secondary resources include, the annual reports for each company, the Business Source Complete
company profiles, and the Toy Industry Association’s webpage. The results of our research are in the
following report.
We gladly submit this report to the Copeland Associates with the expectation that our managers will
follow our recommendations on Mattel, Inc. We have faith that our analysis of the toy industry will give
our senior management a sufficient understanding of the industry while also giving them better
knowledge on our company Mattel, Inc.
Thank you,
John Bland, Parker Foard, Kyle Kuhar, Paul McMahon, and Vincent Stubbs
Memo of Transmittal for the Toy Industry
Tinkering With
the Toy Industry
Brightening
Mattel’s Future
MID 107 TEAM 4
PARKER FOARD
PAUL MCMAHON
JOHN BLAND
VINCENT STUBBS
KYLE KUHAR
PREPARED FOR
CATHERINE PENROD
NADEGE LEVALLET
PAUL BENEDICT
JAMIE LAMBERT
LEE WAKEMAN
Executive Summary
This report provides a look at the toy company Mattel Inc., as well as its competitors in the toy industry,
Hasbro Inc. and Jakks Pacific. Included in this report are three key success factors as well as three specific
recommendations which will help Mattel improve its standing in the industry. The success factors are
innovating products into digital entertainment, expanding into emerging markets with increasing economic
potential, and licensing to companies advantageous to the sales of toys. Overall, research has shown that
Mattel is a leader of the toy industry, however there is room for improvement.
Mattel is currently struggling to find successful licensing partnerships, and most recently lost their most
lucrative partner, the Disney Princess franchise, to their main rival, Hasbro. Mattel also has performed at an
industry average when it comes to sales in emerging markets. Mattel has shown signs of improvement with
their innovation of toys into digital entertainment, as well as the revenue since they began to develop
technologically advanced toys. Most recently, the installment of The talking Hello Barbie toy has seen an
increase in their revenue by 14% in the span of three months.
Threats
Mattel faces many challenges within the toy industry. The industry is heavily populated by only a few main
companies, and the barriers to entry are very high. Mattel faces challenges in obtaining licensing
partnerships, as many of the successful partners have already established agreements with companies.
Mattel also faces challenges in expanding their brands into emerging markets. Recessions can be devastating
to economies, as was seen in 2012, when the United States dealt with an economic downturn, and JAKKs
Pacific went through a troublesome period.
Recommendations
The key success factors showed where Mattel has been struggling within the industry. This can be solved by
taking multiple steps towards improvement
 Mattel has improved their presence within digital entertainment. Partnering with Electronic Arts and
designing an app to interact with toys will further establish themselves in the Industry.
 Mattel lost licensing rights to the Disney Princesses and saw their stock price plummet. They can
improve their licensing by gaining control of the upcoming movie The Secret Life of Pets, and using
their rights to sell toys.
 Mattel has to improve their international reputation, and this can be done by partnering with retail
stores in India and China. In India, V-Mart is a growing store to partner with and in China, Wumart is a
large company looking to jumpstart their revenue.
Conclusion
This report analyzes Mattel in comparison to the rest of the toy industry, focusing mainly on how Mattel
performs in each of the areas identified as key success factors. Mattel must address their focuses on
emerging markets, as well as to address innovation within toys and licensing partnerships. If Mattel
improves within these areas, they will see improvement within their position in the toy industry.
Executive Summary
Table of Contents
Introduction
Market Analysis
Financial Analysis
Key success Factor – #1
Key success Factor – #2
Key success Factor – #3
Recommendation’s
1
5
6
7-8
9-10
11-12
13-14
Company Analysis 2
Competitor Analysis - Hasbro 3
Competitor Analysis - Jakks Pacific 4
Conclusion 15
References 16-23
Figures
Figure 1: Mattel’s Top Management
Figure 2: Hasbro’s Return vs. S&P 500
Figure 3: Monthly Disposable income 2010-14
Figure 4: Growth in Developed markets vs China
Figure 5: Total Star wars Revenue Sales Segments
Figure 6: Children Entertainment Segment trends
Figure 7: Wumart’s Net Profit Margin over Time
2
3
8
8
10
12
13
Mattel Inc.
The toy industry is a very important industry responsible for entertaining millions of children
worldwide. In 2014, the global sales of this market exceeded $80 Billion and are expected to
increase every year. The major companies for this industry include, Mattel Inc., Hasbro Inc., and
JAKKS Pacific Inc. For these companies to succeed and gain an advantage over their competition,
they need to follow three key success factors.
The three key success factors are as follows:
 Innovating products into digital entertainment
 Expansion into emerging markets with increasing economicpotential
 Licensing with companies advantageous to the sales of toys
We have found that the companies that focus most extensively on the three key success factors will
succeed the most. We ranked each of our key success factors to 100%. Key success factor
1(innovation) was rated 40% while key success factor 2(emerging markets) and key success factor
3(licensing) were rated at 30%. We decided to rank key success factor 1 the highest because we
found that by creating a product through digital entertainment, be that apps or television shows,
that children would be more exposed to the products, thus wanting more of them. Key success
factor 2 was ranked at 30% because we felt that placing yourself in the emerging markets is a must
for companies in this industry. In our research we found that if you focus too much in one area it can
either make or break a company. Key success factor 3 was ranked at 30% due to the amount of
profit there is to be earned through licensed toys. We found that Hasbro is doing best in this due to
them acquiring Disney princesses and taking advantage of their movie licenses. Overall, the
companies ranked: Hasbro Inc. first, Mattel Inc. second, and JAKKS Pacific Inc. coming in last place.
Rank Weight RawScore Rank Weight RawScore Rank Weight RawScore Total
6 40% 2.4 6.5 30% 1.95 4 30% 1.2 5.55
8 40% 3.2 7 30% 2.1 9 30% 2.7 8
2 40% 0.8 3 30% 0.9 5 30% 1.5 3.2
Hasbro Inc.
JakksPacific Inc.
Decision Model Innovation Emerging Markets Licensing
Mattel Inc.
Key SuccessFactors
Introduction
1 Intro Analysis Key Factors
Recommen
dations
Conclusion References Appendix
Mattel Inc.
Mattel Inc. is the world’s largest toy company. Founded in 1945, Mattel is headquartered in El Segundo,
California, and has 25,000 employees. They distribute toys to over 150 different countries, and include core
toy lines such as Barbie dolls, Mega Blocks, Monster High, WWE action figures and Hot Wheels. Mattel also
has partnerships with large companies such as Warner Brothers (Encyclopedia.com). Mattel has been a
reliable company for the past 70 years and this is shown through continued success in the toy market.
Brand Awareness
Mattel has recently lost key partnerships with successful companies. The biggest blow to Mattel came when
they lost the rights to the Disney Princesses. This had major implications to the company, and they have yet
to show that they can recover. In our key success factors, we point out how Mattel’s share prices have
decreased since the loss of Disney Princesses, and this is a major factor as to why we rated Mattel as a 4 out
of 10 in terms of licensing. The most crucial hit however is that they lost the Disney Princesses to their main
competitor, Hasbro. Mattel must improve their licensing partnerships in order to regain their grasp as the
leader in the toy industry.
Innovation
Recently, Mattel has shown a growth in innovating their toys into digital entertainment, as well as
developing new technology into their toys. This is evident in Mattel’s most recent hit toy, the Hello Barbie.
This is a new interactive toy which is programmed to talk to its users. Since the release of the Hello Barbie,
Mattel has seen their market share soar, and also recorded their first profit during the holiday season since
2012 (Shore, 2015). This shows the success Mattel can have with innovating into new technology. In our
decision matrix, we rated Mattel as a 6 out of 10. We believe there is still room for improvement, but the
Hello Barbie is a great start.
Global Presence
Mattel has a clear and strong presence in international and emerging markets. According to Mattel’s 2014
annual report, we found that 46% of their annual sales were made in international markets (Mattel, 2016).
This is important because it demonstrates that Mattel does a very large portion of their business in
international markets. This is very similar to the numbers that Hasbro does internationally. In our decision
matrix, we rated Mattel as a 6.5. We came up with this number, because while it is similar to Hasbro,
Hasbro has shown an increasing number of sales in specified emerging markets such as China, Russia, and
Brazil (Hasbro, 2014). We believe that Mattel needs to continue to improve and expand by increasing their
sales in emerging markets.
Company Analysis - Mattel
Chief Executive Officer Christopher A. Sinclair
Chief Operating Officer Richard Dickson
Chief Financial Officer Kevin Farr
Chief Supply Chain Officer Peter D. Gibbons
Chief Legal Officer Robert Normile
2
Figure 1: Mattel’s top Management
Intro Analysis Key Factors
Recommen
dations
Conclusion References Appendix
Competitor Analysis - Hasbro
Competitor Analysis – Hasbro
Emerging Markets
Hasbro also has a strong presence internationally. This includes an importance in Russia, Brazil
and China. According to Hasbro’s 2014 annual report, the net revenues in emerging markets
continues to grow each year (Hasbro, 2014). We gave Hasbro a rating of 7 out of 10. We gave
them this grade because they recorded 47% of their revenue in international sales, and their
emerging markets continue to grow.
Hasbro is one of the leaders in the toy industry. They were founded in 1923, and according to their official
website, they pride themselves on connecting with their customers through their toys and creating
memories, “you’ll see smiles on people’s faces as they recall many fond memories or create new ones”. The
decision matrix we completed has our group’s ratings on each of the companies. Hasbro had the highest sum
of the three within our key success factors
Hasbro does a good job connecting with
their customers, and they have a wide range
of product licenses. These include
partnerships with the Disney Princesses,
Star Wars, and the movie Frozen. These
licenses are very important to Hasbro, as
they are very profitable. Since the release of
the Star Wars franchise in 1977, $12 billion
alone has been made based of off toy sales
specifically with Star Wars (Statistic Brain,
2016). According to Time.com, since the
announcement of the revitalization of a new
trilogy, Star Wars has seen $700 million in
toy sales (White, 2016). In our decision
matrix, we rated Hasbro as a 9 out of 10 in
terms of product licensing. We believe that
this is a good rating for Hasbro, due to them
having the best licensing deals, and their
ability to take the Disney Princesses away
from their main competitor, Mattel.
Innovation
Not only does Hasbro have a reputable portfolio, they also have displayed a
strength in innovating through digital entertainment. An example of this is their
partnership with Netflix. According to a report released by Hasbro Studios,
“Hasbro content will be available on Netflix, and included in the Netflix ‘Just for
Kids’ is a collection of TV shows and movies that is specifically selected for children
12 and under” (Duffy, 2012). This is a great example of a company using digital
entertainment to gain new customers. In our decision matrix, we gave Hasbro a
rating of 8, and this is in large part due to their success within digital
entertainment.
Figure 2: Hasbro’s Return against the S&P 500
3 Intro Analysis Key Factors
Recommen
dations
Conclusion References Appendix
Competitor Analysis – Jakks Pacific
Founded in 1995, Jakks Pacific is a major player in the ever expanding toy industry. Of the three companies
we analyzed, Jakks Pacific received the lowest total score on the decision matrix we completed.
Innovation
Out of the three companies, Jakks has the most work to do in terms of innovation. Through our research we
were unable to find areas where Jakks maximizes their potential in terms of innovating in digital technology.
Expanding into this area is very important, as the rest of the toy industry has had great success with this. The
score we gave to Jakks was a 2 on a scale of 10. According to Business Source complete, Jakks main strength is
their low manufacturing cost (Business Source Complete).
Brand Awareness
Jakks has developed a niche brand with multiple companies within the licensing aspect of the toy industry.
Recently they have inked a deal to secure the rights with DC Comics. Specifically they have made an
agreement for the Batman V Superman: Dawn of Justice movie (Venturi, 2015). This is an important
agreement for Jakks, because it is one of their only licensing deals. On our decision matrix, we scored them as
a 5 out of 10. This is because other than the new agreement they made with DC Comics, they do not have
many agreements with other companies. This is important in the industry, and for Jakks to succeed they must
secure more agreements.
Emerging Markets
Jakks has struggled in international markets. According to their 2013, only 17.2% of their sales were made
internationally. This means that most of their business is done in North America. The international market is
very important and Jakks must reach out into this area to earn more revenue. On our decision matrix, we
rated them as a 3 out of 10. Jakks desperately needs to improve their sales to improve their position in the
industry.
Competitor Analysis – JAKKS Pacific
4 Intro Analysis Key Factors
Recommen
dations
Conclusion References Appendix
Competitor Analysis – Jakks Pacific
Market Analysis
5 Intro Analysis Key Factors
Recommen
dations
Conclusion References Appendix
Today’s Market
This is an industry unlike any other. A majority of toys sold are sold in the fourth
quarter or the holiday season. This is when companies within the industry really
have to come out and make most of their profit. Even though kids are the main
recipients for the toys, toy companies try to attract parents because they are the
ones that actually buy the toys. According to Richard Gottlieb, “the loss of girls as
toy consumers earlier and earlier is one reason toy sales have trended down over
most of the last 10 years.” The reasons for the decrease in young girls include:
 toy makers treated girls as if princesses were their sole interest
 made a move from traditional girl toys to “Girly-Girl toys”
 Gender neutral toys are not as appealing to girls as they are for boys
The Future of the Market
As the toy industry continues to expand across the world, the future of the industry
develops as well. For decades, it was simple traditional toys which dominated the
industry. However since technology has continued to rapidly expand, the future of
the toy industry has come to question. The development of app-based toys for
children has made waves across the world. The Huffington Post surveyed 350
parents in regards to the way that their children played with toys. Of the 350
parents surveyed, 60 percent claimed their children used touchscreens “often”, and
38 percent claimed their kids used touch screens “very often”. The survey also
questioned whether parents considered touch screens a toy. 58 percent of the
parents surveyed responded by saying that touch screens are “sometimes” a toy
(Andronico, Michael). This is a very good description of how the toy industry is
evolving. With the coming years, the industry will continue to shift towards a more
technologically developed atmosphere, and more parents will begin to address
touch screen apps as toys.
Financial Analysis
Financial Analysis
6 Intro Analysis Key Factors
Recommen
dations
Conclusion References Appendix
Hasbro is considered the better company to invest in out of the three major toy companies. This
can be seen in the financial ratios. Investors are more likely to purchase shares in Hasbro because
they have a higher return on equity than Mattel and have been seeing substantial growth
recently. Hasbro’s ROE is 28% while Mattel’s ROE is 17% (NASDAQ.com). These are figures from
2014. They also have a better gross margin, which means Hasbro is able to make more money off
of their toys than Mattel. This is taking into account cost of manufacturing and the actual sales
prices of the toys.
Mattel currently has the lowest return on equity compared to its direct competition at 10.79%.
This means Mattel makes 10.79% profit for each dollar invested by its shareholders. This is
compared to Hasbro’s and Jakks ROE, which is 29.33% and 22.51% respectively. Mattel is larger
than both Hasbro and Jakks, but they have a lower ROE because they do not generate as much
profit for each dollar invested into the company. Mattel’s return on assets for 2015 is 4.50%,
meaning it earned 4.50% on the assets it has owned. This is a very low percentage as investors
generally wouldn’t even consider investing in a company with an ROA of less than 5%. Mattel’s
return on assets ratio indicates that they are not making a lot of profit for the amount of
resources they have. Hasbro has the highest amount of debt out of the three.
From the ratios mentioned above, Jakks Pacific may seem like they’re around the same level as
Mattel and Hasbro, but Jakks has the lowest earnings per share at 0.7. Mattel and Hasbro had an
EPS of 1.45 and 3.2 respectively. Mattel had the highest amount of sales, but Hasbro overall had
the best income statement. Jakks made the least amount of money, but has improved compared
to their negative earnings in previous years (NASDAQ.com). Mattel has the largest price to
earnings ratio out of the 3 at 24.01, whereas Hasbro is 20.56 and Jakks is 9.41. This implies that
investors are more likely to earn more by investing in Mattel, but debt plays a factor in P/E ratio
too. Since Hasbro has more debt than Mattel, this could have affected Hasbro’s ratio making it
lower.
Key Success Factor #1
Asian countries have 30% while Europe has 29% of the total worldwide toy market(Gaille, 2013). Moreover, Asia
pacific is expected to become the world's largest toy market in the next couple years. In addition, the Asia-
Pacific region, especially India, have experienced increases in their GDP, leading to increases in Disposable
incomes which increases spending on discretionary items, such as toys. This is yet another reason why
expanding into emerging markets is important. Consumers earning extra disposable income will only benefit in
sales for the toy industry. Disposable income is also important because toys are a discretionary item, and not an
everyday need for common people. This means that the toy industry relies heavily on a good economy and
disposable income. China is also one of the best markets to get into with its economy thriving (in terms of GDP,
refer to appendix E), and also having a large amount of disposable income per month compared to other
emerging markets. Choosing locations with the highest amount of potential consumers is of the utmost
importance for a company looking to expand its reach in the toy industry.
Retail loyalty is also very important to establish within emerging markets. Many of the markets that are
undeveloped don’t have large retail stores such as Walmart and Target To be able to sell products more
efficiently, it is important to establish yourself with small businesses and partners. By creating loyalty,
building relationships with smaller stores and developing partnerships, companies will be able to sell their
products in markets where they previously had no connection. This happens through better understanding
of the environment (Firstnational). This helps create a large number of distribution channels for the
manufacturer in this new market, which in turn creates more growth. In growing markets such as China
and India, where consumer incomes have been increasing and manufacturing costs are cheap (refer to
appendix F), creating manufacturing to distribute to niche stores will establish a larger presence. Also
establishments where the competition has not entered, will be extremely beneficial to companies cost and
relieving some competition from counterfeit goods plague some of their international sales.
Expanding into emerging markets is very important in the toy industry. Emerging markets are showing success
within many different industries. Population size is an important part of why they create so much growth in
the industry. This is relevant because as population within a market rises, so does the opportunity of
achieving higher revenues. It is also important to gauge the amount of disposable income that is increasing in
each economy. Disposable income relies on how well an economy is doing. As seen in Appendix E, seven of
the world’s top ten GDPs are emerging economies. It is also apparent that seven of the world’s largest
countries, in terms of population, are in the top ten in GDP. With six of those seven coming in emerging
markets. Moreover, the main consumer of the industry is children, and nine of the world’s top ten countries
in terms of child population are emerging economies (Tradegood, 2014). Russia is one of the leaders in
disposable income growth to toy market value. It is forecasted to have 62% of eastern Europe's overall
growth in the toy industry, which comes to around $1.2 billion (Tradegood, 2014).
Key Success Factors
Decision Model Innovation Emerging Markets Licensing
Rank Weight
Raw
Score Rank Weight
Raw
Score Rank Weight
Raw
ScoreTotal
Mattel Inc. 6 40% 2.4 6.5 30% 1.95 4 30% 1.2 5.55
Hasbro Inc. 8 40% 3.2 7 30% 2.1 9 30% 2.7 8
Jakks Pacific Inc. 2 40% 0.8 3 30% 0.9 5 30% 1.5 3.2
Key Success Factor 1:Expansion into emerging markets with increasing economic potential
Creating Loyalty with Retailers
Spending in areas with high Market share
7 Intro Analysis Key Factors
Recommen
dations
Conclusion References Appendix
Key Success Factor #1
Mattel has 46% of its Sales from its international Market. Although almost half of its gross sales
come internationally, it is still a smaller player in large markets like China and India. Mattel sales
came 55% from Europe, 30% from Latin America, and 15% from Asia pacific region. these numbers
create worry about the developing markets in the Asia Pacific region, but when looking at the
percent change in gross sale, there was a 7% decrease in sales in Europe, 10% decrease in Latin
America, but only a 1% increase in Asia Pacific (Mattel Annual report 2014). Looking at the percent
change explains why the future will be in the developing large markets like China and India. Although
the change is slow it is showing growth compared to other international segments.
It is also important to notice that being diversified internationally can give you safety for your
company financially. Jakks Pacific had this problem in past years not having a large presence outside
the United States. In 2012, their fourth quarter net loss was $119.5 million and their share price
declined at 5.45 per share (Businesswire). Mattel and Hasbro were also hurt by the poor economy in
the United States but not even close to as bad. This is because Mattel and Hasbro had an
international presence that cushioned the blow of the poor US economy.
Mattel
Figure 3:
Monthly
Disposable
Income
2010-2014
Figure 4:
Growth in
developed
markets vs
china
8 Intro Analysis Key Factors
Recommen
dations
Conclusion References Appendix
Key Success Factors
Decision Model Innovation Emerging Markets Licensing
Rank Weight
Raw
Score Rank Weight
Raw
Score Rank Weight
Raw
ScoreTotal
Mattel Inc. 6 40% 2.4 6.5 30% 1.95 4 30% 1.2 5.55
Hasbro Inc. 8 40% 3.2 7 30% 2.1 9 30% 2.7 8
Jakks Pacific Inc. 2 40% 0.8 3 30% 0.9 5 30% 1.5 3.2
Key Success Factor #2
Licensing a brands rights’ when they’re available is a big deal between toy companies. The best time to
gain a brand’s rights’ is right before that brand becomes popular. In an article by Matt Townsend and
Christopher Palmeri, big companies like Mattel and Hasbro were fighting for the movie Frozen’s intellectual
property back when the movie came out in 2013. They described the outcome of the battle by saying
“Even better for Hasbro is that it’s taking the rights to make Elsa and Cinderella figurines from larger rival,
Mattel Inc.” (Townsend and Palmeri, 2014). This proved to be beneficial to Hasbro because the profitability
with this licensing deal was substantial. The toy sales based off of Frozen merchandise earned a total of
$5.3 billion as of the summer of 2014, at that time it was ranked third in all time sales among licensed toys
behind Star Wars and Cars.(refer to Appendix G) (Matsuo, 2014).
If a franchise becomes popular enough, like Frozen, Star Wars, or Transformers, they will always be
popular. Toy companies like Mattel, Hasbro, and Jakks Pacific realize this, so they try to get their hands
on them as soon as they possibly can, so that they can endure the brand’s success for as long as
possible. Therefore, getting the intellectual rights as quickly as possible is very crucial for toy companies
because there is always a chance for a specific toy brand to be a fad.
What’s most important to notice when a company such as Mattel wants to license a certain brand, is
how the brand resonates with the consumer market. The most important thing to look at is how a
movie does at the box office when it’s in the theaters and how many ratings a certain T.V. show
gets. One of the greatest franchises of all time is Star Wars, and it has made $12 million in toy sales. The
reason for this, according to Wired.Co.Uk is that Star Wars is about friendship, gadgets, contains real
world elements, is culturally significant, and nostaligic (Wired.Co.Uk, 2015). The market for Star Wars is
huge because of all of these elements that resonate with audiences, but especially with children and
collectors. People relate to the product they buy when it is a licensed toy. Frozen has quickly risen to be
the second highest licensed toy seller of all time behind Star Wars. Maryam Kia-Keating, Ph.D. and Yalda
T. Uhls, MBA, Ph.D. say that the biggest reasons behind this is because of the magical realism and the
family and friendship morals that are in the movie. It connects to people through many elements like
many other big franchises (Kia-Keating, Ph.D, and Uhls, MBA, Ph.D, 2015).
People buy licensed brands because they connect to the product on an emotional level. They see the
movies and the T.V. shows and fall in love with the characters that are associated with them because
they feel like they already know them. The biggest licensed toy franchises as of 2014, (refer to Appendix
G), sold and still sell so well because people personally love the creativity, the realism, and the
connection to the characters and the concept of these brands. Toy companies like Mattel and Hasbro
need to be able to recognize this so they know which brands to invest in, in order to make money over a
long period of time.
9
Success of licensing
Relating to People
Intro Analysis Key Factors
Recommen
dations
Conclusion References Appendix
Key Success Factor 2: Licensing with Companies Advantageous to the Sales of Toys
Key Success Factor #2
Another main aspect to licensing is being
able to land the rights to a brand. Hasbro
was able to buy the rights to Disney and
Marvel brands in the summer of 2013.
Ever since that purchase, as well as
winning Frozen from Mattel, gaining Star
Wars, and Disney Princesses, their stock
price has risen from 44.83 on June 23,
2013 to 73.77 on February 1, 2016 (refer
to Appendix D). On the other side of the
spectrum, Mattel has been on a huge
decline since the summer of 2013. Their
stock price was 40.35 on June 23, 2013
when Hasbro bought the Disney and
Marvel rights, then it regained control
and was 46.99 December 23, 2013, and
then started plummeting once again. As
of February 1, 2016, Mattel’s stock price
is only at 26.76 (Refer to Appendix H).
With the amount of revenue that can be made on certain licensing brands, toy companies like
Hasbro and Mattel spend a lot of money just to get their hands on some popular brands. For
example, on June 15, 1998 Mattel paid $700 million to buyout Pleasant company, a privately
owned company, who was known primarily for making the American Girl dolls. Today, American
Girl has sold more than 27 million dolls since it was created in 1986 (Fogle, 2016). It is one of
Mattel’s most successful brands and made up $620,654,000 of Mattel’s total revenue of
$6,023,819,000 in 2014. (Mattel Annual Report, 2015). Therefore, it is a key partnership that
Mattel has with American Girl because of all the money that it brings in.
Mattel has been recently lacking in the licensing department. So far, Hasbro has been pretty
dominant in terms of being able to find partnerships and using popular brands. While Mattel still
has major brands like Barbie, Hot Wheels, American Girl, and many others, the major brands that
Mattel has have not been performing well. They are failing to make more licensing deals while
companies like Hasbro are making big deals. With the big partnerships that Hasbro has made like
Disney and Disney Princesses, they continue to see success while Mattel is trying to keep up and
compete. However, with their new ideas and plenty of brand opportunities available, they should
still be a major frontrunner in this industry.
Mattel
Figure 5: Total Star Wars Revenue segments
10
Control is key
Intro Analysis Key Factors
Recommen
dations
Conclusion References Appendix
Key Success Factor #3
Key Success Factors
Decision
Model Innovation Emerging Markets Licensing
Rank Weight
Raw
Score Rank Weight
Raw
Score Rank Weight
Raw
ScoreTotal
Mattel Inc. 6 40% 2.4 6.5 30% 1.95 4 30% 1.2 5.55
Hasbro Inc. 8 40% 3.2 7 30% 2.1 9 30% 2.7 8
Jakks
Pacific Inc. 2 40% 0.8 3 30% 0.9 5 30% 1.5 3.2
Innovating new technology is key within the toy industry. Specifically, we identified our third and final
key success factor as extending brands through digital entertainment. This includes developing and
adapting to the increasing demand for electronic toys, as well as moving traditional toy products onto
the big screen. According to a review of the Toy and Game Industry, 41.7% of the industry is made up of
electronic toys (IBIS World). Adapting to this growing demand for electronic toys is crucial for any
company to succeed. In another article on LinkedIn, Mattel’s president, Neil Friedman also noted the
importance of innovation and developing new product lines to attract new customers, “Innovation is key
in the toy industry and to succeed one must create a ‘wow’ moment for kids by designing toys that have
fun, innovative features and include new technologies and engaging content” (Guzzi, 2015). With the
toy industry always expanding and adapting new technologies, it is important to capitalize upon moving
towards advanced toys and attracting new customers through digital entertainment.
Other industries display the profitability that extending into digital entertainment provides
Companies that are able to extend their brands through digital entertainment are more often than not,
going to have a successful business plan, especially with the growing age of technologically advanced
users. This can be seen outside of the toy industry, in the company Netflix. Netflix is global brand, which
allows for consumers to stream thousands of television shows and movies with the click of a button.
Netflix has expanded its brand through digital entertainment in recent years by creating unique, original
content to add to its pre-existing shows and movies. In fact, shows like House of Cards, Orange is the
New Black, and Daredevil, are among the most popular shows available to watch on Netflix. According to
Variety.com, the original series Daredevil was watched by the most Netflix subscribers in its first day
available than any other series. The figure below shows that on the first day available, 3% of Netflix
subscribers viewed Daredevil. According to Statista.com, Netflix had 70 million subscribers worldwide in
2015. This means that on its first day alone, one of Netflix’s original series brought in over 2 million
viewers. This shows the importance of extending a brand through digital content. Digital content not
only brings in new users, but it also increases the interest of existing users, and develops product loyalty.
This can be applied to the toy industry, because toys are focused around stories and the imagination of
their customers. Digital content adds to this. Digital content provides an avenue to guide consumers
down and drive them back to stores to continue to buy products of characters and stories they feel an
attachment to.
Key Success Factor 3: Extending brands through digital entertainment
11 Intro Analysis Key Factors
Recommen
dations
Conclusion References Appendix
Improving technology allows for new development in popular toys
Developing effective product lines through licensed products is very important for companies in determining
whether they will succeed or not. Companies such as Mattel, have significantly increased their brand with the
innovations they have implemented through their most successful product line, the Barbie doll. Recently, Mattel
has incorporated a plan to increase sales with the Barbie doll. This plan is centered around the development of a
technologically advanced voice control doll called “Hello Barbie”. According to an article on Euromonitor.com,
“Hello Barbie can also be used to play interactive games and tell stories and jokes. The doll requires a wireless
internet connection and can provide an hour’s worth of playtime when fully charged” (Shore, 2015). In fact the
introduction of Hello Barbie has paid dividends for Mattel. According to CNN Money, “shares of Mattel soared
14% Tuesday after the company reported its first holiday sales increase since 2012” (La Monica, 2016). This shows
how the development of new technology in toys can benefit and result in a boost in sales. The development of
toys like this are aimed to attract customers to new, more engaging toys which consumers can build a relationship
with. Expanding on popular brands, such as Barbie is also important to pique the interest not only of new
consumers, but also past consumers who have purchased products. The chart below shows the frequency of
children twelve years old and under, and their preferred play type. The figure shows that touch screens are used
most frequently, with game consoles used second most compared to the rest of the options. This shows just how
significant it is for toy companies to innovate into touch screen, and advanced games. These numbers will
continue to grow as technology further develops, and if companies don’t keep up with the changes, they will
become obsolete.
Success in the toy industry shows that digital entertainment is a necessity
Within the toy industry, Lego has been very successful through storytelling with their recent success in The
Lego Movie. According to International Business Times, “The wildly popular film increased sales of Lego toys
by 11 percent during the first six months of 2014”. (Mintz, 2014). This is an example of how extending brands
through digital entertainment can increase sales within the toy industry. The Lego Movie made $257 million
at the box office because it resonated well along with many other movies and video games based on the Lego
brand. (Mintz, 2014). Another upcoming project that Lego is currently working on is The Lego Batman Movie
set for release in the year 2017. (IMDB, 2015). With this business model, Lego looks to increase it’s
storytelling ability by making movies that audiences will enjoy, and furthermore, build a brand among
families that will continue to increase sales.
Figure 6:
children
entertainment
segment trends
Key Success Factor #3
12 Intro Analysis Key Factors
Recommen
dations
Conclusion References Appendix
Recommendation’s
Our recommendation to Mattel is to expand its global
and international sales by entering into successful retail
stores in growing markets. The two main markets we
focused on were India, and China. We have identified
two of the more profitable retail stores in India and
China. In India, we suggest that Mattel partners with V-
Mart, a retail store in India. In China, we identified
Wumart, as a store Mattel should partner with
We identified V-Mart as an important retailer for Mattel,
because V-Mart is a large scale retailer in India, and are
currently focused on getting into smaller cities to create
more brand awareness in the country. According to the
India Brief Equity Foundation, the company is focused on
a jump in revenue of up to $391 million by 2020, and the
key driver of this jump is integrating into smaller cities
(IBEF, 2016). This would be a worthwhile company to
partner with because of their control of the India market.
The projected jump in sales is also important because it
shows that they continue to grow.
Wumart is a well-known retail store in central China and has recently expanded to 565 stores all
across China. According to the Wall Street Journal, Wumart has begun to struggle in the market with
“net profit margins declining to 1.5% in the 12 months to June from 2.1% a year earlier”. This net
profit decrease is credited to the rapid expansion of this company since 2012. We found this to be a
good opportunity to partner with this company because it will benefit both companies. It benefits
Wumart by jumpstarting the company with new products like Barbie and Hot Wheels. This helps
Mattel by gaining a higher share of the international market with a store that is also expanding at a
fast pace.
Partner with Local Retailers
Collaborate with an innovative App development Company
Figure 7: Wumart’s Net profit
margin over time.
Mattel needs to partner with app company to develop its electronic toys, and we believe the company Electronic
Arts is a perfect match, “Electronic Arts Inc. is a leading global interactive entertainment software company. EA
delivers games, content and online services for Internet-connected consoles, personal computers, mobile phones
and tablets.” (EA, 2015). Electronic Arts is most known for their EA Sports branch complete with game franchises
like Madden and FIFA. However, Electronic Arts still has multiple games across multiple platforms, including apps
on IOS devices. They already have a partnership with Hasbro for making games like Monopoly, Scrabble, Boggle,
and many more. Even though Hasbro is partnered with them, Mattel could still partner with them. Mattel
shouldn’t focus on making games with EA however; they should focus on making interactive mobile apps.
Recently, Mattel announced an upcoming Talking Barbie interactive toy that increased their market share, so
Mattel should focus more on this because this is what people are expecting.EA is a great company to execute this
with because they are a well-known company and are very profitable. EA’s total net revenue is $4,515,000,000 in
2015, and mobile games made up $72 million of this total (Electronic Arts Annual Report, 2015). EA has also
stated in their annual report that they know that technology changes rapidly in their industry, so they have
invested and will continue to invest in new business strategies, products, andtechnologies (Electronic Arts Annual
Report, 2015). They understand that there are certain risks involved with developing new technologies, but
Mattel’s interactive toy’s have proven to spike interest and raise their stock price.Therefore, Mattel should reach
out to Electronic Arts with an idea to develop a mobile app that interacts with a toy.It would prove beneficial to
both companies to partner up and make interactive products together.
13 Intro Analysis Key Factors
Recommen
dations
Conclusion References Appendix
Mattel should work on getting the licensing rights to the upcoming Universal Studios
movie The Secret Life of Pets. The movie is set to come out on July 8, 2016 and is made
by the same people who wrote the Despicable Me movies. Mattel should consider this
because of how successful the Despicable Me movies are. The total global box office
earnings of Despicable Me, Despicable Me 2, and even Minions are $2,462,987,001.
(The-Numbers, 2015). Based on the huge success of all the Despicable Me movies,
Mattel should consider buying the rights to the upcoming movieThe Secret Life of
Pets. Universal Studios and Illumination Entertainment, the company that made
Despicable Me, have had great success with their kid friendly animation movies. The
imagination elements that come with these movies offer great storylines and it offers
a great opportunity for Mattel to get a licensing deal for something that could
resonate well with kids and adults alike. If The Secret Life of Pets is as creative and
imaginative as the Despicable Me movies then it will be immensely popular and will
give Mattel a great opportunity to be apart of the success.
Recommendation’s
14 Intro Analysis Key Factors
Recommen
dations
Conclusion References Appendix
Get Master Licensing to large potential Blockbusters
Conclusion
This report has included extensive research on the toy industry as a whole with a focus on its
biggest company, Mattel, Inc. We also did analysis on each of its largest competitors which are
JAKKS Pacific, Inc. and Hasbro, Inc. With further research on Mattel’s strengths and weaknesses we
constructed three key recommendations for them to focus on in the future.
These recommendations include:
 Partnering with Electronic Arts to create an interactive app for Mattel’s toys
 Obtaining the license for the Universal Studios movie Secret Life of Pets
 Partnering with Indian retail company V-Mart and Chinese retail company WuMart to sell
toys in their stores
We found that partnering with Electronic Arts will be the biggest impact on the company because
they have not used this technology before. We believe that innovating away from the average toy
to the interactive toy will be beneficial for Mattel going forward. This app will make it to where a
child can use a phone/tablet to control the toy and play with it in a whole new way. This will create
a new way of selling a product due to almost every child moving away from the traditional toys to
the digitally entertaining toys.
Obtaining the license for the upcoming movie Secret Life of Pets would be crucial for Mattel, Inc. If
they could obtain this license it would create a large amount of untapped revenue that they could
take advantage of. Universal studios also created the Minions movie which has generated $2.4B in
box office earnings. This shows that if they can take advantage of this movie now, that they can
make an enormous amount of revenue.
We concluded that partnering with retail stores in China and India would be very helpful for our
company. Not only would doing so be good for Mattel, it would also be helpful to V-Mart and
WuMart. This partnership will put our products on the shelf in places where they haven’t been in
the past, creating more revenue than ever seen before.
Using these three recommendations we conclude that Mattel, Inc. will be a more successful and
lucrative company. They will remain at the top of the industry and keep Hasbro and other
competitors at a good distance.
Conclusion
15 Intro Analysis Key Factors
Recommen
dations
Conclusion References Appendix
REFERENCES
16
17
 1st National Bank. (2004). How to Enter an Emerging Foreign Market.
Retrieved from 1stnationalbank.com.
 Back, A. (October 21, 2015). Everyday Low Price Prompts Buyout for
China’s Wal-Mart Wannabe. Retrieved from The Wall Street
Journal.
 Benitez-Eves, T. (July 1, 2015). The Toy Industry’s New Leader. Retrieved
from web.a.ebscohost.com.proxy.library.ohiou.edu
 Benitez-Eves, T. (December 1, 2015). The Year in Toys: A Look Ahead to 2016.
Retrieved from web.a.ebscohost.com.proxy.library.ohiou.edu
 Bogoslaw, David. (2007, August 02). Mattel Takes a Hit on Toy Recall
Retrieved from Bloombergbusiness.com
 Brown, Abram. (April 17, 2013). Life After Barbie: Why Mattel Isn’t Scared of
iPads and Video Games Retrieved from Forbes.com
 Business Source Complete. (November 2015). Toys and Games in Asia-Pacific
Retrieved from Business Source Complete Database
 Business Source Complete (2015, November). Industry Profile – Europe.
Retrieved from Business Source Complete Database
 Business Source Complete (2015, November). Global Toys and Games.
Retrieved from Business Source Complete Database
 Business Source Complete (November 2015) Toys and Games in France
Retrieved from Business Source Complete Database
 Business Source Complete (2015, November). Toy and Games industry profile
– Japan. Retrieved from Business Source Complete
 BusinessWire (February 21, 2013). Jakks Pacific Reports Fourth Quarter and
Year-End Results for 2012. Retrieved from Businesswire.com
 Chakraborty, Shruti (September 25, 2014). As China eats into its market,
India’s toy industry pins hope on e-commerce Retrieved from QZ.com
 Chen, Celia (2014, October 29) Toy Makers Ride on Mainland Baby Boom
Retrieved from Lexis Nexis
 CIA (February 3, 2016). The World Factbook. Retrieved from CIA.gov
18
 D’innocenzio, A. (November 11, 2015). Toy sales take off, thanks to technology,
Hollywood; Barbies that can talk, items tied to new Star Wars film part
of $19.9B market in 2015. Retrieved from global-factivia.com
 Dolter, Amanda (2014, December 18) Traditional Toys Still Rattle the Market
Retrieved from lexisnexis.com
 Dow Jones. (December 30, 2015). High Out-of-Stocks Good for Toy Industry-
Market Talks. Retrieved from global-factivia.com
 Duffy, Julie (April 5, 2012). Hasbro Studios Signs Multi-Year Deal with Netflix to
Provide Its Award-Winning Content across Multiple Platforms in the U.S.
Retrieved from Investor.Hasbro.com
 Ed. Lynn M. Pearce. (2005). SIC 3944 Games, Toy’s, and Children’s Vehicles.
Encyclopedia of American Industries. Retrieved from Gale Virtual
Reference Library.
 Einhorn, B. (November 6, 2014). India vs. China: The Battle for Global
Manufacturing. Retrieved from Bloombergbusiness.com.
 Fedwa Malti-Douglas. (2007). Toys. Encyclopedia of Sex and Gender.
Retrieved from Gale Virtual Reference Library
 Feliciano, A. (February 21, 2013). JAKKS Pacific® Reports Fourth Quarter and
Year-End Results for 2012. Retrieved from Investor Relations.
 First Research (2015, December). Toy & Hobby Stores. Retrieved from ABI-
INFORM Database.
 First Research. (January 1, 2016). Toy & Game Manufacturing. Retrieved
From First Research.
 First Research. (December 14, 2016). Electronic Toys & Games Manufacturing.
Retrieved from First Research.
 Foger, A. (January 4, 2016). 13 Things You Didn’t Know About American
Girl Dolls. Retrieved from Americangirl.com
 Gaille, B. (October 22, 2013). 23 Toy Industry Statistics and Trends. Retrieved
from brandongaille.com.
19
 Golovko, M. (April 21, 2015). Licensing Slows Mattel Inc. Revenue Decline,
but Core Brands Remain Problematic. Retrieved from
www.portal.euromonitor.com
 Golovko, M (2015, November 24) Deepening Recession in Brazil Weighs Toy
Sales Retrieved from www.portal.euromonitor.com
 Gottlieb, R. (March 1, 2014). Touch Screens vs. Toys; the Fight for Play Time.
Retrieved from the Global Toy News Webpage.
 Guzzi, L. (December 14, 2015). Innovation: How Do We Revitalize The
Toy Industry?. Retrieved from Laura Guzzi’s LinkedIn account.
 Haiden, Z. (May, 2015). Toy, Doll & Game Manufacturing in the US.
Retrieved from Ibis World.
 Hasbro (2015, February). Hasbro Reports Revenue, Operating Profit and Net
Earnings Growth for Full Year 2014. Retrieved from
http://investor.com
 Hoover’s (2016) Electronic Toys and Games Manufacturing Retrieved from
Hoover’s database
 Hoover’s. (2015, December 14) Toy and Hobby Stores. Retrieved from
Hoover’s database
 Hudak, Matthew (2015, December 04) Small but Growing Market Towards
Gender Neutrality in Toys Retrieved from
www.portal.euromonitor.com
 IMDb. (August 14, 2015). The Lego Batman Movie. Retrieved from
www.imdb.com
 Johnston, M. (March 21, 2015). The Disposable Income of People in Every
Country of the World in Fantastic Infographic. Retrieved from
Business Insider.
 Kia-Keating, Ph.D, M and Uhls, MBA, Ph.D, Y (January 6, 2015). The
Science of Why Your Kids Can’t Resist Frozen. Retrieved from
time.com
 La Monica, Paul (February 2, 2016). Nobody puts Barbie in a corner. Mattel
soars Retrieved from Money.CNN.com
 License Global. (January 22, 2016). U.S. Toy Industry Shines in 2015.
Retrieved from www.licensemag.com
20
 MarketLine. (November 2015). Global Toys & Games. Retrieved from
Business Source Complete Database.
 Matsuo, A. (August 30, 2014). 10 Movies That Sold The Most
Merchandise Retrieved from www.therichest.com
 Mattel (2015, January). Mattel Reports Fourth Quarter and Full Year 2014
Financial Results. Retrieved from Mattel.com
 Mehta, T. (February 5, 2015). App usage – smartphones versus tablets
Computerworld.com
 Mergent Online. (2016). Hasbro, Inc. (NMS: HAS). Retrieved from
http://www.mergentonline.com
 Mergent Online. (2016). Mattel Inc. (NMS: MAT). Retrieved from
http://www.mergentonline.com
 Mergent. (December 14, 2015). Toys & Hobby Stores. Retrieved from
http://mergentonline.com
 Mintel. (October 2015). Character Merchandising. Retrieved from
http://academic.mintel.com
 Mintel. (April 2015). Marketing to Kids. Retrieved from
http://academic.mintel.com
 Mintel (2014, April). Traditional Toys and Games. Retrieved from
http://academic.mintel.com
 Mintz, Z. (September 4, 2014). ‘Lego Movie’ Boosts Sales of Popular Toy,
Danish Company Says. Retrieved from www.ibtimes.com
 Morris, C (2016, January 20) The Top Selling Toy in America Retrieved
from Fortune.com
 Nazarli, A (2014, December 23) Toys and Children Retrieved from
www.lexisnexis.com
 Passport (2015, November). Deepening recession in Brazil weighs in on
toy sales. Retrieved from
http://www.portal.euromonitor.com
 Passport. (April 17, 2013). Corporate Strategies in Emerging Toy Markets.
Retrieved from http://www.portal.euromonitor.com
21
 Passport. (August 24, 2014). Global Licensing Continues to Stimulate
Traditional Toys and Games. Retrieved from
http://www.portal.euromonitor.com
 Passport (2015, October). Hasbro’s Exchange Rate Struggles. Retrieved
from http://www.portal.euromonitor.com
 Passport (2015, November). The High Tech Future of Radio/Remote
Controlled Toys. Retrieved from
http://www.portal.euromonitor.com
 Passport. (July 1, 2015). The Influence of Technology in Toys and Games:
Corporate Strategies. Retrieved from portal.euromonitor.com.
 Passport. (October 21, 2015). Traditional Toys: The Growth of STEM and
Physical Development Toys. Retrieved from
portal.euromonitor.com
 Passport. (August 6, 2015). Toys and Games: Global Trends, Developments, and
Prospects. Retrieved from portal.euromonitor.com.
 Pearce, L. (2011). SIC 3942: Dolls and Stuffed Toys. Retrieved from Gale
Virtual Reference Library.
 Pearce, L. (2011). SIC 5945: Hobby, Toy, and Game Shops. Retrieved from
Gale Virtual Reference Library.
 Phillips, J (2015 May) The Retail Market for Toys in the U.S Retrieved
from Ibisworld.com
 Shapiro, K (2011, September 28) UH OH: Little Tikes Recalls 1.7 Million Toy
Nails for Choking Hazard Retrieved from Businessinsider.com
 Shore, D. (March 10, 2015). Mattel Takes Barbie Online in an Effort to Revive
Flagging Sales. Retrieved from portal.euromonitor.com
 Smith, A (April 1, 2015). U.S. Smartphone Use in 2015 Retrieved from
Pewinternet.org
 StatisticBrain. (January 1, 2016). Star Wars Total Franchise Revenue.
Retrieved from http://www.statisticbrain.com
22
 Statista (2014). Statistics and facts on the toy industry. from
http://www.statista.com
 Statista (2014, February). Toy retails sales revenue in the U.S. 2005-2013.
Retrieved from http://www.statista.com
 Tansel, U (2015, September 22) Asia Pacific: World’s Most Heavily Licensed
Toy Market Retrieved from www.portal.euromonitor.com
 The Numbers. (2015). Box Office History for Despicable Me Movies. Retrieved
from the-numbers.com.
 Thielman,, S. (February 23, 2015). The Rise and Fall and Rise of Hasbro’s TV
Strategy What Went Wrong With The Hub, and what the Toymaker
Hopes Will Go Right. Retrieved from www.adweek.com
 Townsend, M and Palmeri, C. (September 25, 2014). Hasbro Wins Disney
Frozen Toy Licenses in Blow to Mattel. Retrieved from
http://www.bloomberg.com
 Tradegood. (February 18, 2014). Emerging Markets Hold the Key for Further
Success in Toys and Games. Retrieved from Tradegood.
 Turks, A. (January 24, 2011). 9 Dumbest Fads to Ever Make Money.
Retrieved from http://www.bcbusiness.ca/
 United States Security and Exchange Commission. (May 21, 2015). Electronic
Arts, Inc. Annual Report. Retrieved from the Electronic Arts
Homepage.
 United States Security and Exchange Commission. (December 18, 2015).
Hasbro, Inc. Annual Report. Retrieved from the Investor Annual
database.
 United States Security and Exchange Commission. (December 31, 2014).
JAKKS Pacific Annual Report. Retrieved from the JAKKS Pacific
webpage.
 United States Security and Exchange Commission. (February 25, 2015). Mattel,
Inc. Annual Report. Retrieved from the Shareholder Database.
 V-Mart (2016). About Us. Retrieved from IBEF.org
23
 Venturi, V (June 8, 2015). JAKKS Pacific Secures Licensing Agreement
with Warner Bros. Consumer Products for Batman v Superman:
Dawn of Justice Retrieved from Investors.Jakks.com
 Wallenstein, A. (April 28, 2015). Netflix Ratings Revealed: New Data
Sheds Light on Original Series’Audience Levels. Retrieved from
the Variety webpage.
 Westgarth, J. (March, 2014). Toy Retailing-UK. Retrieved January 13,
2016 from Mintel.
 White, Daniel (January 20, 2016). Star Wars Toys Brought in $700
Million in 2015 Retrieved from Time.com
 Whitney, Erin (April 28, 2015). The Most-Watched Netflix Show May
Surprise You Retrieved from Huffingtonpost.com
 Wired.Co.Uk (December 15, 2016). Why We Love Star Wars: An
Explainer For ‘Normal’ People. Retrieved February 4, 2016 f
rom Wired.Co.Uk
 Yahoo Finance. (2016). Hasbro, Inc. Retrieved from Yahoo Finance.
 Yahoo Finance. (2016). JAKKS Pacific, Inc. Retrieved from Yahoo
Finance.
 Yahoo Finance. (2016). Mattel, Inc. Retrieved from Yahoo Finance.
Overview
The toy industry is an evolving marketplace in which toys are manufactured and sold to children.
The industry is run by a few major companies that include Mattel, Hasbro, and JAKKS Pacific.
Many underlying companies include Geobra Brandstätte (Germany) and Namco Bandai (Japan).
According to First Research database, “global toy sales exceed $80 billion”. These toy sales come
from major markets including the United States, France, Germany, and Great Britain. Due to
economic hardships over the past years, the European market has declined as well as the US
market. This left openings for “developing countries in Asia, South America, and Africa” (First
Research, 2016). See figure 1 for an extended view. The manufacturing process for the toy
industry is quite different compared to the markets who do all of the heavy lifting. Like many
other markets worldwide, China is the number one distributor and growing at a fast rate. While,
The US toy market, is growing but at a slower rate, as of 2015.
Percent of World Toy market by Region
Current State
The toy industry today is growing into a larger market. According to the NPD Group, “In the first
half of 2015, the U.S. toy industry grew by 6.5 percent, or about $400 million” (2015). They
predicted that the back half of the year would be up over $1 billion. The major companies are
taking advantage of new trending “fads” like Frozen, Paw Patrol, and StarWars.
Appendix A
29%
28%3%
28%
3% 9%
Toy Sales by Region
North America Europe Africa Asia South America Other
24
Future Prospects:
The future is looking up for the toy industry worldwide. With a major incline in online shopping
and cyber-related toys, the toy industry has not reached its full potential yet. The maturity of the
industry will come when they fully incorporate online shopping into their campaign. These toy
companies need to create their future now and move into the online market before the
opportunity passed up. The online market generates a whole new customer base due to the
convenience of buying from their homes. No more waiting in line at retail stores for 20 minutes
at a time (Davis, 2015). According to the NPD Group, “For several years, many in the industry
have been raving about the opportunities offered by online trading, satisfied that their
performance online was good enough because they were recording double-digit increases”. As
of right now the European markets are far ahead of the American toy markets. The toy industry is
already growing by 15% but if the online market was executed correctly the market would grow
upwards of 50% (NPD Group, 2016). Refer to figure 2 for the market shares of the online toy
industry.
Retail Market Share in 2012
Appendix A
25
Industry Trends:
The toy industry is a forever trending marketplace due to children’s interest changing
instantaneously. One of the fastest growing trends in the toy industry is the “Maker
Movement”. This is the process of creating toys that children can build whatever they want with
them. These toys include things like Legos and Mega Blocks. “According to 2014 point-of-sales
data from The NPD Group, the Building Sets and Arts & Crafts categories grew by 13% and 3%,
respectively, proving that kids love to create interesting structures, designs, inventions and
other projects that will set them apart from others and let their talents shine through”(Toy
Industry Association, 2015). Another trending idea is “Smart Play”, which focuses solely on
educational toys for young children. These toys teach kids mathematics, science and reading
skills. Some include games like Leap Frog and educational board games. (Toy Industry
Association, 2015) The most trending item, by far, is anything Star Wars. Disney launched its Star
Wars toy campaign in the first full week of September. It was reported that “about $1 of every
$11 for the week (of Sept. 4) was spent on a Star Wars toy” (Cioletti, 2015). Figure 3 shows how
Star Wars merchandise has increased. With these trends becoming more and more abundant, it
is mandatory for companies to take advantage of them.
total Star wars Toy Sales
Appendix A
26
Appendix B: PESTLE
The toy industry is an industry that is very large, with many different areas to analyze. Using the PESTLE
approach, we found many different factors that affect the industry. We looked at six specific areas in this
analysis; Political forces, economical forces, social forces, technological forces, legal forces, and
environmental forces, and how each of these areas affects the toy industry
Political
Political forces in the toy industry are very important to companies, as these are the factors that
determine the extent to which a government may influence the industry. Specifically, we found that
lobbying for tariffs on imported toys, as well as corruption in the government causing political divide, are
very integral to the success companies endure. Corruption in Brazil’s government has led to a recent
recession, causing spending on discretionary items to decrease, and with it, causing the demand for toys
to decrease as well. This is an example of how a government can influence the industry. Political divide
causes the economy to suffer, and as the economy suffers, industries such as toy manufacturing, do not
succeed. We also found that lobbying for tariffs on imported toys affects the toy industry. Reducing the
costs of tariffs on imported goods is important because it allows companies to manufacture their toys at a
cheaper price, and thus increase their profit margins.
Economic
The toy industry is also affected by economic factors. What we identified in this area is the trends within
seasonal spending. Spending in this industry sees a majority of its revenues during holiday seasons,
specifically in the fourth quarter of the year. Specifically, Fortune.com identified Christmas week as the
most important week for toy companies. This past year, Christmas week generated 8% of the annual sales
in the toy industry. Another trend we identified in the economics sector was the differentiation in
spending among income levels. This is evident in the recession in Brazil, where the lower class represents
54% of the economy, and is not spending money on anything other than the essentials to survive. Income
levels are very important to identify in order to succeed in the toy industry.
Social
In the social sector of the toy industry, we identified that trends were apparent when it comes to moving
away from traditional toys, as well as attracting the child population. We found that many companies are
moving away from the traditional toys, and favoring toys that are more technologically advanced. Toys
such as iPads, and other tablets have become more attractive in the industry, and are using an educational
aspect to drive consumers into purchasing them. We also noted that the child population is the key to the
toy industry. While they may not actually be purchasing the product, children are the most influential in
the industry. Figure 3 in the appendix shows a chart of the market segmentation in the industry, and from
this we can conclude that appealing to the older population, is important, but much of this is reliant on
the influence of the younger population.
27
Appendix B: PESTLE
Technology
We also look the technology sector in toys, and we found that developing a supply chain system, as well as
emerging to online markets, is very important in the industry. We found that “the growth of technology is
being fueled by increasing popularity of collectibles. Toys based on Hollywood blockbuster films and
technology that allows toys to do such things as talk back.” Another thing we found out is that children
growing up in a technology based environment “has created a generation of digital natives; children who
are very comfortable using technology and increasingly interested in video games, as well as traditional
toys and games that incorporate some virtual component.” Technology is important in this industry,
because creating an enhanced product, will likely improve a company’s ability to increase their sales and
develop a relationship with its customers.
Legal
From the legal aspect, we found that the industry is very focused on producing safe products, but
important areas we targeted were safety issues-recalls, as well as intellectual property rights. Safety issue
recalls are important to identify, because there are sunk costs that companies have. Not only can
companies lose millions of dollars due to recalls, but they also risk losing the trust they have built up with
their customers. In 2012, there were an estimated 262,300 toy-related injuries treated in United States
hospital emergency rooms. Of these injuries, seventy percent involved children 12 years old or younger.
There were also 13 reports of toy-related deaths of children younger than 15 years old. Toy recalls pose a
major threat to companies, and by reducing these, a company can gain a leg up on the competition as well
as keep their brand as a reliable company. We also found that intellectual property rights were important
for companies to gain. In this past year, licensing contracts with Star Wars, as well as other popular movies
and shows, have fueled millions of dollars for companies. According to Fortune.com, Star Wars already has
made over $700 million in toy sales and is only continuing to grow. By obtaining these rights, as well as by
continuing to produce entertaining products with the rights, companies are able to attract customers from
many different markets, and sell their products without competition, all over the world.
Environmental
The final factor of the PESTLE analysis we researched was environmental. In the environmental aspect, we
identified waste production and environmentally friendly toys as key areas among the industry.
Environmentally friendly toys have been a growing trend over the past few years because of the concern
for cleaning up the environment. Because of this, many consumers have gone out of their way to buy only
eco-friendly products. This is important to identify, because eco-friendly toys cost more than the
traditional toys, but the demand within the industry could make a potential transition to eco-friendly toys
a lucrative investment.
28
Appendix C: Porters
Competitive
Rivalry
Threat of
New Entry
Buyer Power
Threat of
substitutes
Supplier
Power
Threat of new Entry: LOW
 Highly concentrate
 Top 50 companies control
80% of global toy sales
(FirstResearch)
 Brand/Product loyalty
 Ex. Barbie
 Very high initial investment
Buyer Power: Moderate
 Dependency on contracts
 Large amount of channels for
distribution.
 Ex. Retail stores,
department stores, toy
stores, etc.
Supplier Power: Moderate
 Depend mostly on supplies that
are easily attainable
 Ex. Paper, plastic, etc.
 Prices can fluctuate based on
economy of plastic and oil.
Threat of Substitutes: High
 New Technology
 Ex. Gaming, Apps, etc.
 Toys = Entertainment
 Abundant forms of
entertainment.
Competitive Rivalry: Very High
 Consolidated industry
 3-4 Major Players
 Demand for new toys
 Many toys are short-lived
 Intellectual Property Rights
(licensing)
29
Appendix D
35
Appendix E
top ten GDP’s worldwide currently Top ten countries in population size
30
Appendix F
31
Appendix G
Matsuo, 2014
32
Appendix H
Mattel Hasbro JAKKS Pacific
As of 8/31/2016 $27.59 $74.28 $7.45
2015 $26.90 $74.59 $9.85
2014 $38.83 $59.20 $8.76
2013 $45.56 $55.01 $13.06
2012 $36.62 $38.17 $19.07
Yahoo finance
Mattel Hasbro JAKKS Pacific
2014 $498 $415 $21
2013 $903 $286 $(53)
2012 $776 $335 $(104)
Mattel Hasbro JAKKS Pacific
2014 $209.5 $222.56 -
2013 $201.9 $207.59 -
2012 $195.1 $201.2 -
2014 Annual Reports of Mattel, Hasbro, and Jakks
33
Appendix I
Key Partners Key Activities
Key Resources
Value Propositions Customer Relationships Customer Segments
Channels
Cost Structure Revenue Streams
Who are our Key Partners?
Who are our key suppliers?
Which Key Resources are we acquiring
from partners?
Which Key Activities do partners perform?
What Key Activities do our Value
Propositions require?
Our Distribution Channels?
Customer Relationships?
Revenue streams?
What value do we deliver to the customer?
Which one of our customer’s problems are we
helping to solve?
What bundles of products and services are we
offering to each Customer Segment?
Which customer needs are we satisfying?
What type of relationship does each of our Customer
Segments expect us to establish and maintain with
them?
Which ones have we established?
How are they integrated with the rest of our business
model?
How costly are they?
For whom are we creating value?
Who are our most important customers?
What Key Resources do our Value Propositions
require?
Our Distribution Channels? Customer
Relationships?
Revenue Streams?
Through which Channels do our Customer Segments
want to be reached?
How are we reaching them now?
How are our Channels integrated?
Which ones work best?
Which ones are most cost-efficient?
How are we integrating them with customer routines?
What are the most important costs inherent in our business model?
Which Key Resources are most expensive?
Which Key Activities are most expensive?
For what value are our customers really willing to pay?
For what do they currently pay?
How are they currently paying?
How would they prefer to pay?
How much does each Revenue Stream contribute to overall revenues?
The Business Model Canvas
Designed for: Designed by: On: dd/mm/yyyy
Iteration #
www.businessmodelgeneration.com
d
t
e
d
t
e
-Barbie
-Hotwheels
-WWE
-Boom Co.
-Ever After High
-Sony
-Pixar
-THQ
-Monster High
-Gameloft
-Electrocomponents
-DC Comics
-Warner Bros.
-Netflix
-Promotions
-Entertainment
-Toys
-Events
-Brand Status
-Parents with
children under the
age of ten
-Toy Collectors
-Invested Gamers
-American Girl
-Promotions
-Production
-Events
-Make a Wish
Foundation
-Childrens Hospital
Association
-Other charities
-Mattel Children’s
Hospital UCLA
-The Special Olympics
-Partnerships
-Sponsorships
-Plastic
-Rubber
-Stockholders
-TV
-Radio
-E-Mail
-Newspapers
-Word of Mouth
-Mail
-Toys
-Partnerships
-Sponsors
-TV
-Inventory
-Salaries
-Travel
-Electricity
Mattel, Inc. MID107 Team 4
2/1/2016
1t
34
Appendix K- Financial Data
Company Mattel 2014 Mattel 2013 Mattel 2012
Sales $6,023,819 $6,484,892 $6,420,881
Cost of Goods Sold $3,022,797 $3,006,009 $3,011,684
Current Assests $3,185,951 $3,377,993 $3,556,805
Inventory $562,047 $568,843 $465,057
Accounts Receivable $1,093,180 $1,260,105 $1,226,833
Current liabilities $1,088,949 $1,047,440 $1,716,012
Operating Income $653,714 $1,168,103 $1,021,015
Net Profit (before Taxes) $586,910 $1,099,128 $945,045
Net Income $498,874 $903,944 $776,464
Total Assests $6,722,046 $6,439,626 $6,526,785
Total liabilities $3,772,975 $3,188,067 $3,459,741
Stockholders equity $2,949,071 $3,251,559 $3,067,044
Company Hasbro 2014 Hasbro 2013 Hasbro 2012
Sales $4,277,207 $4,082,157 $4,088,983
Cost of Goods Sold $1,698,372 $1,672,901 $1,671,980
Current Assests $2,719,100 $2,480,457 $2,508,202
Inventory $339,572 $348,794 $316,049
Accounts Receivable $1,094,673 $1,093,620 $1,029,959
Current liabilities $1,074,934 $1,363,280 $960,435
Operating Income $635,375 $467,093 $551,785
Net Profit (before Taxes) $539,988 $351,822 $453,402
Net Income $415,930 $286,198 $335,999
Total Assests $4,532,142 $4,402,267 $4,325,387
Total liabilities $3,023,748 $2,674,479 $2,818,008
Stockholders equity $1,465,664 $1,682,343 $1,507,379
Company Jakks 2014 Jakks 2013 Jakks 2012
Sales $810,060 $632,925 $666,762
Cost of Goods Sold $574,253 $477,146 $468,825
Current Assests $437,593 $320,932 $406,056
Inventory $78,827 $46,784 $59,690
Accounts Receivable $234,516 $101,223 $105,455
Current liabilities $191,348 $184,595 $219,475
Operating Income $31,327 $(44,532) $(13,222)
Net Profit (before Taxes) $25,224 $(51,295) $(18,649)
Net Income $21,509 $(53,906) $(104,800)
Total Assests $561,782 $449,844 $554,825
Total liabilities $416,698 $301,159 $347,605
Stockholders equity $145,084 $148,685 $207,220
36
Appendix L - Ratios
profitability 2005-12 2006-12 2007-12 2008-12 2009-12 2010-12 2011-12 2012-12 2013-12 2014-12 TTM
Tax Rate % 36.04 13.28 14.70 22.20 19.90 19.13 20.83 17.84 17.76 15.00 25.74
Net Margin % 8.05 10.49 10.05 6.41 9.74 11.69 12.26 12.09 13.94 8.28 5.34
Asset Turnover
(Average)
1.13 1.21 1.22 1.25 1.15 1.15 1.13 1.05 1.00 0.92 0.84
Return on Assets % 9.14 12.71 12.29 8.01 11.18 13.43 13.86 12.73 13.94 7.58 4.49
Financial Leverage
(Average)
2.08 2.04 2.08 2.21 1.89 2.06 2.17 2.13 1.98 2.28 2.58
Return on Equity % 18.59 26.15 25.32 17.16 22.75 26.55 29.34 27.35 28.61 16.09 10.79
Return on Invested
Capital %
15.19 21.27 19.79 13.52 18.41 20.54 20.55 19.30 20.44 11.31 7.19
Interest Coverage — — — 6.95 10.19 14.06 13.89 11.64 15.00 8.40 5.84
Mattel
Profitability 2005-12 2006-12 2007-12 2008-12 2009-12 2010-12 2011-12 2012-12 2013-12 2014-12 TTM
Tax Rate % 31.79 32.63 27.98 30.45 29.22 21.66 20.77 25.89 19.30 23.46 23.65
Net Margin % 6.87 7.30 8.68 7.63 9.22 9.94 8.99 8.22 7.01 9.72 10.42
Asset Turnover
(Average)
0.94 0.99 1.21 1.26 1.15 1.00 1.04 0.97 0.94 0.96 0.94
Return on Assets % 6.48 7.19 10.51 9.58 10.61 9.96 9.37 7.95 6.56 9.31 9.81
Financial Leverage
(Average)
1.92 2.01 2.34 2.28 2.44 2.53 2.91 2.87 2.62 3.09 2.97
Return on Equity % 12.61 14.11 22.79 22.10 25.12 24.78 25.41 22.98 17.95 26.43 29.33
Return on Invested
Capital %
10.24 10.67 15.70 15.05 17.18 15.87 14.95 13.02 11.84 15.24 16.28
Interest Coverage — — — 10.36 9.60 7.18 6.46 5.97 4.33 6.80 7.02
Hasbro
MorningStar
37
Appendix L (continued)
Profitability 2005-12 2006-12 2007-12 2008-12 2009-12 2010-12 2011-12 2012-12 2013-12 2014-12 TTM
Tax Rate % 34.30 31.68 31.30 14.45 — 5.41 — — — 14.73 10.83
Net Margin % 9.60 9.46 10.38 8.42 -47.97 6.30 1.25 -15.72 -8.52 2.66 4.23
Asset Turnover
(Average)
0.91 0.94 0.92 0.90 0.97 1.18 1.09 1.14 1.26 1.60 1.28
Return on Assets
%
8.75 8.85 9.55 7.56 -46.39 7.42 1.36 -17.91 -10.73 4.25 5.42
Financial
Leverage
(Average)
1.44 1.45 1.42 1.38 1.70 1.54 1.56 2.68 3.03 3.89 3.77
Return on Equity
%
13.01 12.77 13.69 10.58 -68.90 11.99 2.10 -34.89 -30.29 14.67 22.51
Return on
Invested Capital
%
10.76 10.84 11.77 9.20 -56.56 10.64 2.74 -23.12 -13.58 9.91 11.49
Interest Coverage — — — 37.66 -59.05 8.39 0.93 -1.02 -4.16 3.02 4.17
Jakks
MorningStar
38

Project 1 Report

  • 1.
    Date: February 14,2016 To: Paul Benedict, Jamie Lambert, Nadège Levallet, Catherine Penrod, and Lee Wakeman From: MID 107 Team 4: John Bland, Parker Foard, Kyle Kuhar, Paul McMahon and Vincent Stubbs Subject: The Toy Industry and Mattel, Inc. Company Analysis This report, as requested by the Copeland & Associates Faculty Members, describes the toy industry as a whole, and more specifically focuses on Mattel, Inc. and its leading competitors Hasbro Inc. and JAKKS Pacific. The overall research has given us an understanding of the industry, the key success factors of this industry, and we have created recommendations to Mattel, Inc. that we believe will help them succeed. The key success factors for the Toy Industry are as follows: · Innovating products into digital entertainment · Expansion into emerging markets with increasing economic potential · Licensing with companies advantageous to the sales of toys Our primary research was the skype session with Jessyca Durchin Schnepp on February 3, 2016. Secondary resources include, the annual reports for each company, the Business Source Complete company profiles, and the Toy Industry Association’s webpage. The results of our research are in the following report. We gladly submit this report to the Copeland Associates with the expectation that our managers will follow our recommendations on Mattel, Inc. We have faith that our analysis of the toy industry will give our senior management a sufficient understanding of the industry while also giving them better knowledge on our company Mattel, Inc. Thank you, John Bland, Parker Foard, Kyle Kuhar, Paul McMahon, and Vincent Stubbs Memo of Transmittal for the Toy Industry
  • 2.
    Tinkering With the ToyIndustry Brightening Mattel’s Future MID 107 TEAM 4 PARKER FOARD PAUL MCMAHON JOHN BLAND VINCENT STUBBS KYLE KUHAR PREPARED FOR CATHERINE PENROD NADEGE LEVALLET PAUL BENEDICT JAMIE LAMBERT LEE WAKEMAN
  • 3.
    Executive Summary This reportprovides a look at the toy company Mattel Inc., as well as its competitors in the toy industry, Hasbro Inc. and Jakks Pacific. Included in this report are three key success factors as well as three specific recommendations which will help Mattel improve its standing in the industry. The success factors are innovating products into digital entertainment, expanding into emerging markets with increasing economic potential, and licensing to companies advantageous to the sales of toys. Overall, research has shown that Mattel is a leader of the toy industry, however there is room for improvement. Mattel is currently struggling to find successful licensing partnerships, and most recently lost their most lucrative partner, the Disney Princess franchise, to their main rival, Hasbro. Mattel also has performed at an industry average when it comes to sales in emerging markets. Mattel has shown signs of improvement with their innovation of toys into digital entertainment, as well as the revenue since they began to develop technologically advanced toys. Most recently, the installment of The talking Hello Barbie toy has seen an increase in their revenue by 14% in the span of three months. Threats Mattel faces many challenges within the toy industry. The industry is heavily populated by only a few main companies, and the barriers to entry are very high. Mattel faces challenges in obtaining licensing partnerships, as many of the successful partners have already established agreements with companies. Mattel also faces challenges in expanding their brands into emerging markets. Recessions can be devastating to economies, as was seen in 2012, when the United States dealt with an economic downturn, and JAKKs Pacific went through a troublesome period. Recommendations The key success factors showed where Mattel has been struggling within the industry. This can be solved by taking multiple steps towards improvement  Mattel has improved their presence within digital entertainment. Partnering with Electronic Arts and designing an app to interact with toys will further establish themselves in the Industry.  Mattel lost licensing rights to the Disney Princesses and saw their stock price plummet. They can improve their licensing by gaining control of the upcoming movie The Secret Life of Pets, and using their rights to sell toys.  Mattel has to improve their international reputation, and this can be done by partnering with retail stores in India and China. In India, V-Mart is a growing store to partner with and in China, Wumart is a large company looking to jumpstart their revenue. Conclusion This report analyzes Mattel in comparison to the rest of the toy industry, focusing mainly on how Mattel performs in each of the areas identified as key success factors. Mattel must address their focuses on emerging markets, as well as to address innovation within toys and licensing partnerships. If Mattel improves within these areas, they will see improvement within their position in the toy industry. Executive Summary
  • 4.
    Table of Contents Introduction MarketAnalysis Financial Analysis Key success Factor – #1 Key success Factor – #2 Key success Factor – #3 Recommendation’s 1 5 6 7-8 9-10 11-12 13-14 Company Analysis 2 Competitor Analysis - Hasbro 3 Competitor Analysis - Jakks Pacific 4 Conclusion 15 References 16-23
  • 5.
    Figures Figure 1: Mattel’sTop Management Figure 2: Hasbro’s Return vs. S&P 500 Figure 3: Monthly Disposable income 2010-14 Figure 4: Growth in Developed markets vs China Figure 5: Total Star wars Revenue Sales Segments Figure 6: Children Entertainment Segment trends Figure 7: Wumart’s Net Profit Margin over Time 2 3 8 8 10 12 13
  • 6.
    Mattel Inc. The toyindustry is a very important industry responsible for entertaining millions of children worldwide. In 2014, the global sales of this market exceeded $80 Billion and are expected to increase every year. The major companies for this industry include, Mattel Inc., Hasbro Inc., and JAKKS Pacific Inc. For these companies to succeed and gain an advantage over their competition, they need to follow three key success factors. The three key success factors are as follows:  Innovating products into digital entertainment  Expansion into emerging markets with increasing economicpotential  Licensing with companies advantageous to the sales of toys We have found that the companies that focus most extensively on the three key success factors will succeed the most. We ranked each of our key success factors to 100%. Key success factor 1(innovation) was rated 40% while key success factor 2(emerging markets) and key success factor 3(licensing) were rated at 30%. We decided to rank key success factor 1 the highest because we found that by creating a product through digital entertainment, be that apps or television shows, that children would be more exposed to the products, thus wanting more of them. Key success factor 2 was ranked at 30% because we felt that placing yourself in the emerging markets is a must for companies in this industry. In our research we found that if you focus too much in one area it can either make or break a company. Key success factor 3 was ranked at 30% due to the amount of profit there is to be earned through licensed toys. We found that Hasbro is doing best in this due to them acquiring Disney princesses and taking advantage of their movie licenses. Overall, the companies ranked: Hasbro Inc. first, Mattel Inc. second, and JAKKS Pacific Inc. coming in last place. Rank Weight RawScore Rank Weight RawScore Rank Weight RawScore Total 6 40% 2.4 6.5 30% 1.95 4 30% 1.2 5.55 8 40% 3.2 7 30% 2.1 9 30% 2.7 8 2 40% 0.8 3 30% 0.9 5 30% 1.5 3.2 Hasbro Inc. JakksPacific Inc. Decision Model Innovation Emerging Markets Licensing Mattel Inc. Key SuccessFactors Introduction 1 Intro Analysis Key Factors Recommen dations Conclusion References Appendix
  • 7.
    Mattel Inc. Mattel Inc.is the world’s largest toy company. Founded in 1945, Mattel is headquartered in El Segundo, California, and has 25,000 employees. They distribute toys to over 150 different countries, and include core toy lines such as Barbie dolls, Mega Blocks, Monster High, WWE action figures and Hot Wheels. Mattel also has partnerships with large companies such as Warner Brothers (Encyclopedia.com). Mattel has been a reliable company for the past 70 years and this is shown through continued success in the toy market. Brand Awareness Mattel has recently lost key partnerships with successful companies. The biggest blow to Mattel came when they lost the rights to the Disney Princesses. This had major implications to the company, and they have yet to show that they can recover. In our key success factors, we point out how Mattel’s share prices have decreased since the loss of Disney Princesses, and this is a major factor as to why we rated Mattel as a 4 out of 10 in terms of licensing. The most crucial hit however is that they lost the Disney Princesses to their main competitor, Hasbro. Mattel must improve their licensing partnerships in order to regain their grasp as the leader in the toy industry. Innovation Recently, Mattel has shown a growth in innovating their toys into digital entertainment, as well as developing new technology into their toys. This is evident in Mattel’s most recent hit toy, the Hello Barbie. This is a new interactive toy which is programmed to talk to its users. Since the release of the Hello Barbie, Mattel has seen their market share soar, and also recorded their first profit during the holiday season since 2012 (Shore, 2015). This shows the success Mattel can have with innovating into new technology. In our decision matrix, we rated Mattel as a 6 out of 10. We believe there is still room for improvement, but the Hello Barbie is a great start. Global Presence Mattel has a clear and strong presence in international and emerging markets. According to Mattel’s 2014 annual report, we found that 46% of their annual sales were made in international markets (Mattel, 2016). This is important because it demonstrates that Mattel does a very large portion of their business in international markets. This is very similar to the numbers that Hasbro does internationally. In our decision matrix, we rated Mattel as a 6.5. We came up with this number, because while it is similar to Hasbro, Hasbro has shown an increasing number of sales in specified emerging markets such as China, Russia, and Brazil (Hasbro, 2014). We believe that Mattel needs to continue to improve and expand by increasing their sales in emerging markets. Company Analysis - Mattel Chief Executive Officer Christopher A. Sinclair Chief Operating Officer Richard Dickson Chief Financial Officer Kevin Farr Chief Supply Chain Officer Peter D. Gibbons Chief Legal Officer Robert Normile 2 Figure 1: Mattel’s top Management Intro Analysis Key Factors Recommen dations Conclusion References Appendix
  • 8.
    Competitor Analysis -Hasbro Competitor Analysis – Hasbro Emerging Markets Hasbro also has a strong presence internationally. This includes an importance in Russia, Brazil and China. According to Hasbro’s 2014 annual report, the net revenues in emerging markets continues to grow each year (Hasbro, 2014). We gave Hasbro a rating of 7 out of 10. We gave them this grade because they recorded 47% of their revenue in international sales, and their emerging markets continue to grow. Hasbro is one of the leaders in the toy industry. They were founded in 1923, and according to their official website, they pride themselves on connecting with their customers through their toys and creating memories, “you’ll see smiles on people’s faces as they recall many fond memories or create new ones”. The decision matrix we completed has our group’s ratings on each of the companies. Hasbro had the highest sum of the three within our key success factors Hasbro does a good job connecting with their customers, and they have a wide range of product licenses. These include partnerships with the Disney Princesses, Star Wars, and the movie Frozen. These licenses are very important to Hasbro, as they are very profitable. Since the release of the Star Wars franchise in 1977, $12 billion alone has been made based of off toy sales specifically with Star Wars (Statistic Brain, 2016). According to Time.com, since the announcement of the revitalization of a new trilogy, Star Wars has seen $700 million in toy sales (White, 2016). In our decision matrix, we rated Hasbro as a 9 out of 10 in terms of product licensing. We believe that this is a good rating for Hasbro, due to them having the best licensing deals, and their ability to take the Disney Princesses away from their main competitor, Mattel. Innovation Not only does Hasbro have a reputable portfolio, they also have displayed a strength in innovating through digital entertainment. An example of this is their partnership with Netflix. According to a report released by Hasbro Studios, “Hasbro content will be available on Netflix, and included in the Netflix ‘Just for Kids’ is a collection of TV shows and movies that is specifically selected for children 12 and under” (Duffy, 2012). This is a great example of a company using digital entertainment to gain new customers. In our decision matrix, we gave Hasbro a rating of 8, and this is in large part due to their success within digital entertainment. Figure 2: Hasbro’s Return against the S&P 500 3 Intro Analysis Key Factors Recommen dations Conclusion References Appendix
  • 9.
    Competitor Analysis –Jakks Pacific Founded in 1995, Jakks Pacific is a major player in the ever expanding toy industry. Of the three companies we analyzed, Jakks Pacific received the lowest total score on the decision matrix we completed. Innovation Out of the three companies, Jakks has the most work to do in terms of innovation. Through our research we were unable to find areas where Jakks maximizes their potential in terms of innovating in digital technology. Expanding into this area is very important, as the rest of the toy industry has had great success with this. The score we gave to Jakks was a 2 on a scale of 10. According to Business Source complete, Jakks main strength is their low manufacturing cost (Business Source Complete). Brand Awareness Jakks has developed a niche brand with multiple companies within the licensing aspect of the toy industry. Recently they have inked a deal to secure the rights with DC Comics. Specifically they have made an agreement for the Batman V Superman: Dawn of Justice movie (Venturi, 2015). This is an important agreement for Jakks, because it is one of their only licensing deals. On our decision matrix, we scored them as a 5 out of 10. This is because other than the new agreement they made with DC Comics, they do not have many agreements with other companies. This is important in the industry, and for Jakks to succeed they must secure more agreements. Emerging Markets Jakks has struggled in international markets. According to their 2013, only 17.2% of their sales were made internationally. This means that most of their business is done in North America. The international market is very important and Jakks must reach out into this area to earn more revenue. On our decision matrix, we rated them as a 3 out of 10. Jakks desperately needs to improve their sales to improve their position in the industry. Competitor Analysis – JAKKS Pacific 4 Intro Analysis Key Factors Recommen dations Conclusion References Appendix
  • 10.
    Competitor Analysis –Jakks Pacific Market Analysis 5 Intro Analysis Key Factors Recommen dations Conclusion References Appendix Today’s Market This is an industry unlike any other. A majority of toys sold are sold in the fourth quarter or the holiday season. This is when companies within the industry really have to come out and make most of their profit. Even though kids are the main recipients for the toys, toy companies try to attract parents because they are the ones that actually buy the toys. According to Richard Gottlieb, “the loss of girls as toy consumers earlier and earlier is one reason toy sales have trended down over most of the last 10 years.” The reasons for the decrease in young girls include:  toy makers treated girls as if princesses were their sole interest  made a move from traditional girl toys to “Girly-Girl toys”  Gender neutral toys are not as appealing to girls as they are for boys The Future of the Market As the toy industry continues to expand across the world, the future of the industry develops as well. For decades, it was simple traditional toys which dominated the industry. However since technology has continued to rapidly expand, the future of the toy industry has come to question. The development of app-based toys for children has made waves across the world. The Huffington Post surveyed 350 parents in regards to the way that their children played with toys. Of the 350 parents surveyed, 60 percent claimed their children used touchscreens “often”, and 38 percent claimed their kids used touch screens “very often”. The survey also questioned whether parents considered touch screens a toy. 58 percent of the parents surveyed responded by saying that touch screens are “sometimes” a toy (Andronico, Michael). This is a very good description of how the toy industry is evolving. With the coming years, the industry will continue to shift towards a more technologically developed atmosphere, and more parents will begin to address touch screen apps as toys.
  • 11.
    Financial Analysis Financial Analysis 6Intro Analysis Key Factors Recommen dations Conclusion References Appendix Hasbro is considered the better company to invest in out of the three major toy companies. This can be seen in the financial ratios. Investors are more likely to purchase shares in Hasbro because they have a higher return on equity than Mattel and have been seeing substantial growth recently. Hasbro’s ROE is 28% while Mattel’s ROE is 17% (NASDAQ.com). These are figures from 2014. They also have a better gross margin, which means Hasbro is able to make more money off of their toys than Mattel. This is taking into account cost of manufacturing and the actual sales prices of the toys. Mattel currently has the lowest return on equity compared to its direct competition at 10.79%. This means Mattel makes 10.79% profit for each dollar invested by its shareholders. This is compared to Hasbro’s and Jakks ROE, which is 29.33% and 22.51% respectively. Mattel is larger than both Hasbro and Jakks, but they have a lower ROE because they do not generate as much profit for each dollar invested into the company. Mattel’s return on assets for 2015 is 4.50%, meaning it earned 4.50% on the assets it has owned. This is a very low percentage as investors generally wouldn’t even consider investing in a company with an ROA of less than 5%. Mattel’s return on assets ratio indicates that they are not making a lot of profit for the amount of resources they have. Hasbro has the highest amount of debt out of the three. From the ratios mentioned above, Jakks Pacific may seem like they’re around the same level as Mattel and Hasbro, but Jakks has the lowest earnings per share at 0.7. Mattel and Hasbro had an EPS of 1.45 and 3.2 respectively. Mattel had the highest amount of sales, but Hasbro overall had the best income statement. Jakks made the least amount of money, but has improved compared to their negative earnings in previous years (NASDAQ.com). Mattel has the largest price to earnings ratio out of the 3 at 24.01, whereas Hasbro is 20.56 and Jakks is 9.41. This implies that investors are more likely to earn more by investing in Mattel, but debt plays a factor in P/E ratio too. Since Hasbro has more debt than Mattel, this could have affected Hasbro’s ratio making it lower.
  • 12.
    Key Success Factor#1 Asian countries have 30% while Europe has 29% of the total worldwide toy market(Gaille, 2013). Moreover, Asia pacific is expected to become the world's largest toy market in the next couple years. In addition, the Asia- Pacific region, especially India, have experienced increases in their GDP, leading to increases in Disposable incomes which increases spending on discretionary items, such as toys. This is yet another reason why expanding into emerging markets is important. Consumers earning extra disposable income will only benefit in sales for the toy industry. Disposable income is also important because toys are a discretionary item, and not an everyday need for common people. This means that the toy industry relies heavily on a good economy and disposable income. China is also one of the best markets to get into with its economy thriving (in terms of GDP, refer to appendix E), and also having a large amount of disposable income per month compared to other emerging markets. Choosing locations with the highest amount of potential consumers is of the utmost importance for a company looking to expand its reach in the toy industry. Retail loyalty is also very important to establish within emerging markets. Many of the markets that are undeveloped don’t have large retail stores such as Walmart and Target To be able to sell products more efficiently, it is important to establish yourself with small businesses and partners. By creating loyalty, building relationships with smaller stores and developing partnerships, companies will be able to sell their products in markets where they previously had no connection. This happens through better understanding of the environment (Firstnational). This helps create a large number of distribution channels for the manufacturer in this new market, which in turn creates more growth. In growing markets such as China and India, where consumer incomes have been increasing and manufacturing costs are cheap (refer to appendix F), creating manufacturing to distribute to niche stores will establish a larger presence. Also establishments where the competition has not entered, will be extremely beneficial to companies cost and relieving some competition from counterfeit goods plague some of their international sales. Expanding into emerging markets is very important in the toy industry. Emerging markets are showing success within many different industries. Population size is an important part of why they create so much growth in the industry. This is relevant because as population within a market rises, so does the opportunity of achieving higher revenues. It is also important to gauge the amount of disposable income that is increasing in each economy. Disposable income relies on how well an economy is doing. As seen in Appendix E, seven of the world’s top ten GDPs are emerging economies. It is also apparent that seven of the world’s largest countries, in terms of population, are in the top ten in GDP. With six of those seven coming in emerging markets. Moreover, the main consumer of the industry is children, and nine of the world’s top ten countries in terms of child population are emerging economies (Tradegood, 2014). Russia is one of the leaders in disposable income growth to toy market value. It is forecasted to have 62% of eastern Europe's overall growth in the toy industry, which comes to around $1.2 billion (Tradegood, 2014). Key Success Factors Decision Model Innovation Emerging Markets Licensing Rank Weight Raw Score Rank Weight Raw Score Rank Weight Raw ScoreTotal Mattel Inc. 6 40% 2.4 6.5 30% 1.95 4 30% 1.2 5.55 Hasbro Inc. 8 40% 3.2 7 30% 2.1 9 30% 2.7 8 Jakks Pacific Inc. 2 40% 0.8 3 30% 0.9 5 30% 1.5 3.2 Key Success Factor 1:Expansion into emerging markets with increasing economic potential Creating Loyalty with Retailers Spending in areas with high Market share 7 Intro Analysis Key Factors Recommen dations Conclusion References Appendix
  • 13.
    Key Success Factor#1 Mattel has 46% of its Sales from its international Market. Although almost half of its gross sales come internationally, it is still a smaller player in large markets like China and India. Mattel sales came 55% from Europe, 30% from Latin America, and 15% from Asia pacific region. these numbers create worry about the developing markets in the Asia Pacific region, but when looking at the percent change in gross sale, there was a 7% decrease in sales in Europe, 10% decrease in Latin America, but only a 1% increase in Asia Pacific (Mattel Annual report 2014). Looking at the percent change explains why the future will be in the developing large markets like China and India. Although the change is slow it is showing growth compared to other international segments. It is also important to notice that being diversified internationally can give you safety for your company financially. Jakks Pacific had this problem in past years not having a large presence outside the United States. In 2012, their fourth quarter net loss was $119.5 million and their share price declined at 5.45 per share (Businesswire). Mattel and Hasbro were also hurt by the poor economy in the United States but not even close to as bad. This is because Mattel and Hasbro had an international presence that cushioned the blow of the poor US economy. Mattel Figure 3: Monthly Disposable Income 2010-2014 Figure 4: Growth in developed markets vs china 8 Intro Analysis Key Factors Recommen dations Conclusion References Appendix
  • 14.
    Key Success Factors DecisionModel Innovation Emerging Markets Licensing Rank Weight Raw Score Rank Weight Raw Score Rank Weight Raw ScoreTotal Mattel Inc. 6 40% 2.4 6.5 30% 1.95 4 30% 1.2 5.55 Hasbro Inc. 8 40% 3.2 7 30% 2.1 9 30% 2.7 8 Jakks Pacific Inc. 2 40% 0.8 3 30% 0.9 5 30% 1.5 3.2 Key Success Factor #2 Licensing a brands rights’ when they’re available is a big deal between toy companies. The best time to gain a brand’s rights’ is right before that brand becomes popular. In an article by Matt Townsend and Christopher Palmeri, big companies like Mattel and Hasbro were fighting for the movie Frozen’s intellectual property back when the movie came out in 2013. They described the outcome of the battle by saying “Even better for Hasbro is that it’s taking the rights to make Elsa and Cinderella figurines from larger rival, Mattel Inc.” (Townsend and Palmeri, 2014). This proved to be beneficial to Hasbro because the profitability with this licensing deal was substantial. The toy sales based off of Frozen merchandise earned a total of $5.3 billion as of the summer of 2014, at that time it was ranked third in all time sales among licensed toys behind Star Wars and Cars.(refer to Appendix G) (Matsuo, 2014). If a franchise becomes popular enough, like Frozen, Star Wars, or Transformers, they will always be popular. Toy companies like Mattel, Hasbro, and Jakks Pacific realize this, so they try to get their hands on them as soon as they possibly can, so that they can endure the brand’s success for as long as possible. Therefore, getting the intellectual rights as quickly as possible is very crucial for toy companies because there is always a chance for a specific toy brand to be a fad. What’s most important to notice when a company such as Mattel wants to license a certain brand, is how the brand resonates with the consumer market. The most important thing to look at is how a movie does at the box office when it’s in the theaters and how many ratings a certain T.V. show gets. One of the greatest franchises of all time is Star Wars, and it has made $12 million in toy sales. The reason for this, according to Wired.Co.Uk is that Star Wars is about friendship, gadgets, contains real world elements, is culturally significant, and nostaligic (Wired.Co.Uk, 2015). The market for Star Wars is huge because of all of these elements that resonate with audiences, but especially with children and collectors. People relate to the product they buy when it is a licensed toy. Frozen has quickly risen to be the second highest licensed toy seller of all time behind Star Wars. Maryam Kia-Keating, Ph.D. and Yalda T. Uhls, MBA, Ph.D. say that the biggest reasons behind this is because of the magical realism and the family and friendship morals that are in the movie. It connects to people through many elements like many other big franchises (Kia-Keating, Ph.D, and Uhls, MBA, Ph.D, 2015). People buy licensed brands because they connect to the product on an emotional level. They see the movies and the T.V. shows and fall in love with the characters that are associated with them because they feel like they already know them. The biggest licensed toy franchises as of 2014, (refer to Appendix G), sold and still sell so well because people personally love the creativity, the realism, and the connection to the characters and the concept of these brands. Toy companies like Mattel and Hasbro need to be able to recognize this so they know which brands to invest in, in order to make money over a long period of time. 9 Success of licensing Relating to People Intro Analysis Key Factors Recommen dations Conclusion References Appendix Key Success Factor 2: Licensing with Companies Advantageous to the Sales of Toys
  • 15.
    Key Success Factor#2 Another main aspect to licensing is being able to land the rights to a brand. Hasbro was able to buy the rights to Disney and Marvel brands in the summer of 2013. Ever since that purchase, as well as winning Frozen from Mattel, gaining Star Wars, and Disney Princesses, their stock price has risen from 44.83 on June 23, 2013 to 73.77 on February 1, 2016 (refer to Appendix D). On the other side of the spectrum, Mattel has been on a huge decline since the summer of 2013. Their stock price was 40.35 on June 23, 2013 when Hasbro bought the Disney and Marvel rights, then it regained control and was 46.99 December 23, 2013, and then started plummeting once again. As of February 1, 2016, Mattel’s stock price is only at 26.76 (Refer to Appendix H). With the amount of revenue that can be made on certain licensing brands, toy companies like Hasbro and Mattel spend a lot of money just to get their hands on some popular brands. For example, on June 15, 1998 Mattel paid $700 million to buyout Pleasant company, a privately owned company, who was known primarily for making the American Girl dolls. Today, American Girl has sold more than 27 million dolls since it was created in 1986 (Fogle, 2016). It is one of Mattel’s most successful brands and made up $620,654,000 of Mattel’s total revenue of $6,023,819,000 in 2014. (Mattel Annual Report, 2015). Therefore, it is a key partnership that Mattel has with American Girl because of all the money that it brings in. Mattel has been recently lacking in the licensing department. So far, Hasbro has been pretty dominant in terms of being able to find partnerships and using popular brands. While Mattel still has major brands like Barbie, Hot Wheels, American Girl, and many others, the major brands that Mattel has have not been performing well. They are failing to make more licensing deals while companies like Hasbro are making big deals. With the big partnerships that Hasbro has made like Disney and Disney Princesses, they continue to see success while Mattel is trying to keep up and compete. However, with their new ideas and plenty of brand opportunities available, they should still be a major frontrunner in this industry. Mattel Figure 5: Total Star Wars Revenue segments 10 Control is key Intro Analysis Key Factors Recommen dations Conclusion References Appendix
  • 16.
    Key Success Factor#3 Key Success Factors Decision Model Innovation Emerging Markets Licensing Rank Weight Raw Score Rank Weight Raw Score Rank Weight Raw ScoreTotal Mattel Inc. 6 40% 2.4 6.5 30% 1.95 4 30% 1.2 5.55 Hasbro Inc. 8 40% 3.2 7 30% 2.1 9 30% 2.7 8 Jakks Pacific Inc. 2 40% 0.8 3 30% 0.9 5 30% 1.5 3.2 Innovating new technology is key within the toy industry. Specifically, we identified our third and final key success factor as extending brands through digital entertainment. This includes developing and adapting to the increasing demand for electronic toys, as well as moving traditional toy products onto the big screen. According to a review of the Toy and Game Industry, 41.7% of the industry is made up of electronic toys (IBIS World). Adapting to this growing demand for electronic toys is crucial for any company to succeed. In another article on LinkedIn, Mattel’s president, Neil Friedman also noted the importance of innovation and developing new product lines to attract new customers, “Innovation is key in the toy industry and to succeed one must create a ‘wow’ moment for kids by designing toys that have fun, innovative features and include new technologies and engaging content” (Guzzi, 2015). With the toy industry always expanding and adapting new technologies, it is important to capitalize upon moving towards advanced toys and attracting new customers through digital entertainment. Other industries display the profitability that extending into digital entertainment provides Companies that are able to extend their brands through digital entertainment are more often than not, going to have a successful business plan, especially with the growing age of technologically advanced users. This can be seen outside of the toy industry, in the company Netflix. Netflix is global brand, which allows for consumers to stream thousands of television shows and movies with the click of a button. Netflix has expanded its brand through digital entertainment in recent years by creating unique, original content to add to its pre-existing shows and movies. In fact, shows like House of Cards, Orange is the New Black, and Daredevil, are among the most popular shows available to watch on Netflix. According to Variety.com, the original series Daredevil was watched by the most Netflix subscribers in its first day available than any other series. The figure below shows that on the first day available, 3% of Netflix subscribers viewed Daredevil. According to Statista.com, Netflix had 70 million subscribers worldwide in 2015. This means that on its first day alone, one of Netflix’s original series brought in over 2 million viewers. This shows the importance of extending a brand through digital content. Digital content not only brings in new users, but it also increases the interest of existing users, and develops product loyalty. This can be applied to the toy industry, because toys are focused around stories and the imagination of their customers. Digital content adds to this. Digital content provides an avenue to guide consumers down and drive them back to stores to continue to buy products of characters and stories they feel an attachment to. Key Success Factor 3: Extending brands through digital entertainment 11 Intro Analysis Key Factors Recommen dations Conclusion References Appendix
  • 17.
    Improving technology allowsfor new development in popular toys Developing effective product lines through licensed products is very important for companies in determining whether they will succeed or not. Companies such as Mattel, have significantly increased their brand with the innovations they have implemented through their most successful product line, the Barbie doll. Recently, Mattel has incorporated a plan to increase sales with the Barbie doll. This plan is centered around the development of a technologically advanced voice control doll called “Hello Barbie”. According to an article on Euromonitor.com, “Hello Barbie can also be used to play interactive games and tell stories and jokes. The doll requires a wireless internet connection and can provide an hour’s worth of playtime when fully charged” (Shore, 2015). In fact the introduction of Hello Barbie has paid dividends for Mattel. According to CNN Money, “shares of Mattel soared 14% Tuesday after the company reported its first holiday sales increase since 2012” (La Monica, 2016). This shows how the development of new technology in toys can benefit and result in a boost in sales. The development of toys like this are aimed to attract customers to new, more engaging toys which consumers can build a relationship with. Expanding on popular brands, such as Barbie is also important to pique the interest not only of new consumers, but also past consumers who have purchased products. The chart below shows the frequency of children twelve years old and under, and their preferred play type. The figure shows that touch screens are used most frequently, with game consoles used second most compared to the rest of the options. This shows just how significant it is for toy companies to innovate into touch screen, and advanced games. These numbers will continue to grow as technology further develops, and if companies don’t keep up with the changes, they will become obsolete. Success in the toy industry shows that digital entertainment is a necessity Within the toy industry, Lego has been very successful through storytelling with their recent success in The Lego Movie. According to International Business Times, “The wildly popular film increased sales of Lego toys by 11 percent during the first six months of 2014”. (Mintz, 2014). This is an example of how extending brands through digital entertainment can increase sales within the toy industry. The Lego Movie made $257 million at the box office because it resonated well along with many other movies and video games based on the Lego brand. (Mintz, 2014). Another upcoming project that Lego is currently working on is The Lego Batman Movie set for release in the year 2017. (IMDB, 2015). With this business model, Lego looks to increase it’s storytelling ability by making movies that audiences will enjoy, and furthermore, build a brand among families that will continue to increase sales. Figure 6: children entertainment segment trends Key Success Factor #3 12 Intro Analysis Key Factors Recommen dations Conclusion References Appendix
  • 18.
    Recommendation’s Our recommendation toMattel is to expand its global and international sales by entering into successful retail stores in growing markets. The two main markets we focused on were India, and China. We have identified two of the more profitable retail stores in India and China. In India, we suggest that Mattel partners with V- Mart, a retail store in India. In China, we identified Wumart, as a store Mattel should partner with We identified V-Mart as an important retailer for Mattel, because V-Mart is a large scale retailer in India, and are currently focused on getting into smaller cities to create more brand awareness in the country. According to the India Brief Equity Foundation, the company is focused on a jump in revenue of up to $391 million by 2020, and the key driver of this jump is integrating into smaller cities (IBEF, 2016). This would be a worthwhile company to partner with because of their control of the India market. The projected jump in sales is also important because it shows that they continue to grow. Wumart is a well-known retail store in central China and has recently expanded to 565 stores all across China. According to the Wall Street Journal, Wumart has begun to struggle in the market with “net profit margins declining to 1.5% in the 12 months to June from 2.1% a year earlier”. This net profit decrease is credited to the rapid expansion of this company since 2012. We found this to be a good opportunity to partner with this company because it will benefit both companies. It benefits Wumart by jumpstarting the company with new products like Barbie and Hot Wheels. This helps Mattel by gaining a higher share of the international market with a store that is also expanding at a fast pace. Partner with Local Retailers Collaborate with an innovative App development Company Figure 7: Wumart’s Net profit margin over time. Mattel needs to partner with app company to develop its electronic toys, and we believe the company Electronic Arts is a perfect match, “Electronic Arts Inc. is a leading global interactive entertainment software company. EA delivers games, content and online services for Internet-connected consoles, personal computers, mobile phones and tablets.” (EA, 2015). Electronic Arts is most known for their EA Sports branch complete with game franchises like Madden and FIFA. However, Electronic Arts still has multiple games across multiple platforms, including apps on IOS devices. They already have a partnership with Hasbro for making games like Monopoly, Scrabble, Boggle, and many more. Even though Hasbro is partnered with them, Mattel could still partner with them. Mattel shouldn’t focus on making games with EA however; they should focus on making interactive mobile apps. Recently, Mattel announced an upcoming Talking Barbie interactive toy that increased their market share, so Mattel should focus more on this because this is what people are expecting.EA is a great company to execute this with because they are a well-known company and are very profitable. EA’s total net revenue is $4,515,000,000 in 2015, and mobile games made up $72 million of this total (Electronic Arts Annual Report, 2015). EA has also stated in their annual report that they know that technology changes rapidly in their industry, so they have invested and will continue to invest in new business strategies, products, andtechnologies (Electronic Arts Annual Report, 2015). They understand that there are certain risks involved with developing new technologies, but Mattel’s interactive toy’s have proven to spike interest and raise their stock price.Therefore, Mattel should reach out to Electronic Arts with an idea to develop a mobile app that interacts with a toy.It would prove beneficial to both companies to partner up and make interactive products together. 13 Intro Analysis Key Factors Recommen dations Conclusion References Appendix
  • 19.
    Mattel should workon getting the licensing rights to the upcoming Universal Studios movie The Secret Life of Pets. The movie is set to come out on July 8, 2016 and is made by the same people who wrote the Despicable Me movies. Mattel should consider this because of how successful the Despicable Me movies are. The total global box office earnings of Despicable Me, Despicable Me 2, and even Minions are $2,462,987,001. (The-Numbers, 2015). Based on the huge success of all the Despicable Me movies, Mattel should consider buying the rights to the upcoming movieThe Secret Life of Pets. Universal Studios and Illumination Entertainment, the company that made Despicable Me, have had great success with their kid friendly animation movies. The imagination elements that come with these movies offer great storylines and it offers a great opportunity for Mattel to get a licensing deal for something that could resonate well with kids and adults alike. If The Secret Life of Pets is as creative and imaginative as the Despicable Me movies then it will be immensely popular and will give Mattel a great opportunity to be apart of the success. Recommendation’s 14 Intro Analysis Key Factors Recommen dations Conclusion References Appendix Get Master Licensing to large potential Blockbusters
  • 20.
    Conclusion This report hasincluded extensive research on the toy industry as a whole with a focus on its biggest company, Mattel, Inc. We also did analysis on each of its largest competitors which are JAKKS Pacific, Inc. and Hasbro, Inc. With further research on Mattel’s strengths and weaknesses we constructed three key recommendations for them to focus on in the future. These recommendations include:  Partnering with Electronic Arts to create an interactive app for Mattel’s toys  Obtaining the license for the Universal Studios movie Secret Life of Pets  Partnering with Indian retail company V-Mart and Chinese retail company WuMart to sell toys in their stores We found that partnering with Electronic Arts will be the biggest impact on the company because they have not used this technology before. We believe that innovating away from the average toy to the interactive toy will be beneficial for Mattel going forward. This app will make it to where a child can use a phone/tablet to control the toy and play with it in a whole new way. This will create a new way of selling a product due to almost every child moving away from the traditional toys to the digitally entertaining toys. Obtaining the license for the upcoming movie Secret Life of Pets would be crucial for Mattel, Inc. If they could obtain this license it would create a large amount of untapped revenue that they could take advantage of. Universal studios also created the Minions movie which has generated $2.4B in box office earnings. This shows that if they can take advantage of this movie now, that they can make an enormous amount of revenue. We concluded that partnering with retail stores in China and India would be very helpful for our company. Not only would doing so be good for Mattel, it would also be helpful to V-Mart and WuMart. This partnership will put our products on the shelf in places where they haven’t been in the past, creating more revenue than ever seen before. Using these three recommendations we conclude that Mattel, Inc. will be a more successful and lucrative company. They will remain at the top of the industry and keep Hasbro and other competitors at a good distance. Conclusion 15 Intro Analysis Key Factors Recommen dations Conclusion References Appendix
  • 21.
  • 22.
    17  1st NationalBank. (2004). How to Enter an Emerging Foreign Market. Retrieved from 1stnationalbank.com.  Back, A. (October 21, 2015). Everyday Low Price Prompts Buyout for China’s Wal-Mart Wannabe. Retrieved from The Wall Street Journal.  Benitez-Eves, T. (July 1, 2015). The Toy Industry’s New Leader. Retrieved from web.a.ebscohost.com.proxy.library.ohiou.edu  Benitez-Eves, T. (December 1, 2015). The Year in Toys: A Look Ahead to 2016. Retrieved from web.a.ebscohost.com.proxy.library.ohiou.edu  Bogoslaw, David. (2007, August 02). Mattel Takes a Hit on Toy Recall Retrieved from Bloombergbusiness.com  Brown, Abram. (April 17, 2013). Life After Barbie: Why Mattel Isn’t Scared of iPads and Video Games Retrieved from Forbes.com  Business Source Complete. (November 2015). Toys and Games in Asia-Pacific Retrieved from Business Source Complete Database  Business Source Complete (2015, November). Industry Profile – Europe. Retrieved from Business Source Complete Database  Business Source Complete (2015, November). Global Toys and Games. Retrieved from Business Source Complete Database  Business Source Complete (November 2015) Toys and Games in France Retrieved from Business Source Complete Database  Business Source Complete (2015, November). Toy and Games industry profile – Japan. Retrieved from Business Source Complete  BusinessWire (February 21, 2013). Jakks Pacific Reports Fourth Quarter and Year-End Results for 2012. Retrieved from Businesswire.com  Chakraborty, Shruti (September 25, 2014). As China eats into its market, India’s toy industry pins hope on e-commerce Retrieved from QZ.com  Chen, Celia (2014, October 29) Toy Makers Ride on Mainland Baby Boom Retrieved from Lexis Nexis  CIA (February 3, 2016). The World Factbook. Retrieved from CIA.gov
  • 23.
    18  D’innocenzio, A.(November 11, 2015). Toy sales take off, thanks to technology, Hollywood; Barbies that can talk, items tied to new Star Wars film part of $19.9B market in 2015. Retrieved from global-factivia.com  Dolter, Amanda (2014, December 18) Traditional Toys Still Rattle the Market Retrieved from lexisnexis.com  Dow Jones. (December 30, 2015). High Out-of-Stocks Good for Toy Industry- Market Talks. Retrieved from global-factivia.com  Duffy, Julie (April 5, 2012). Hasbro Studios Signs Multi-Year Deal with Netflix to Provide Its Award-Winning Content across Multiple Platforms in the U.S. Retrieved from Investor.Hasbro.com  Ed. Lynn M. Pearce. (2005). SIC 3944 Games, Toy’s, and Children’s Vehicles. Encyclopedia of American Industries. Retrieved from Gale Virtual Reference Library.  Einhorn, B. (November 6, 2014). India vs. China: The Battle for Global Manufacturing. Retrieved from Bloombergbusiness.com.  Fedwa Malti-Douglas. (2007). Toys. Encyclopedia of Sex and Gender. Retrieved from Gale Virtual Reference Library  Feliciano, A. (February 21, 2013). JAKKS Pacific® Reports Fourth Quarter and Year-End Results for 2012. Retrieved from Investor Relations.  First Research (2015, December). Toy & Hobby Stores. Retrieved from ABI- INFORM Database.  First Research. (January 1, 2016). Toy & Game Manufacturing. Retrieved From First Research.  First Research. (December 14, 2016). Electronic Toys & Games Manufacturing. Retrieved from First Research.  Foger, A. (January 4, 2016). 13 Things You Didn’t Know About American Girl Dolls. Retrieved from Americangirl.com  Gaille, B. (October 22, 2013). 23 Toy Industry Statistics and Trends. Retrieved from brandongaille.com.
  • 24.
    19  Golovko, M.(April 21, 2015). Licensing Slows Mattel Inc. Revenue Decline, but Core Brands Remain Problematic. Retrieved from www.portal.euromonitor.com  Golovko, M (2015, November 24) Deepening Recession in Brazil Weighs Toy Sales Retrieved from www.portal.euromonitor.com  Gottlieb, R. (March 1, 2014). Touch Screens vs. Toys; the Fight for Play Time. Retrieved from the Global Toy News Webpage.  Guzzi, L. (December 14, 2015). Innovation: How Do We Revitalize The Toy Industry?. Retrieved from Laura Guzzi’s LinkedIn account.  Haiden, Z. (May, 2015). Toy, Doll & Game Manufacturing in the US. Retrieved from Ibis World.  Hasbro (2015, February). Hasbro Reports Revenue, Operating Profit and Net Earnings Growth for Full Year 2014. Retrieved from http://investor.com  Hoover’s (2016) Electronic Toys and Games Manufacturing Retrieved from Hoover’s database  Hoover’s. (2015, December 14) Toy and Hobby Stores. Retrieved from Hoover’s database  Hudak, Matthew (2015, December 04) Small but Growing Market Towards Gender Neutrality in Toys Retrieved from www.portal.euromonitor.com  IMDb. (August 14, 2015). The Lego Batman Movie. Retrieved from www.imdb.com  Johnston, M. (March 21, 2015). The Disposable Income of People in Every Country of the World in Fantastic Infographic. Retrieved from Business Insider.  Kia-Keating, Ph.D, M and Uhls, MBA, Ph.D, Y (January 6, 2015). The Science of Why Your Kids Can’t Resist Frozen. Retrieved from time.com  La Monica, Paul (February 2, 2016). Nobody puts Barbie in a corner. Mattel soars Retrieved from Money.CNN.com  License Global. (January 22, 2016). U.S. Toy Industry Shines in 2015. Retrieved from www.licensemag.com
  • 25.
    20  MarketLine. (November2015). Global Toys & Games. Retrieved from Business Source Complete Database.  Matsuo, A. (August 30, 2014). 10 Movies That Sold The Most Merchandise Retrieved from www.therichest.com  Mattel (2015, January). Mattel Reports Fourth Quarter and Full Year 2014 Financial Results. Retrieved from Mattel.com  Mehta, T. (February 5, 2015). App usage – smartphones versus tablets Computerworld.com  Mergent Online. (2016). Hasbro, Inc. (NMS: HAS). Retrieved from http://www.mergentonline.com  Mergent Online. (2016). Mattel Inc. (NMS: MAT). Retrieved from http://www.mergentonline.com  Mergent. (December 14, 2015). Toys & Hobby Stores. Retrieved from http://mergentonline.com  Mintel. (October 2015). Character Merchandising. Retrieved from http://academic.mintel.com  Mintel. (April 2015). Marketing to Kids. Retrieved from http://academic.mintel.com  Mintel (2014, April). Traditional Toys and Games. Retrieved from http://academic.mintel.com  Mintz, Z. (September 4, 2014). ‘Lego Movie’ Boosts Sales of Popular Toy, Danish Company Says. Retrieved from www.ibtimes.com  Morris, C (2016, January 20) The Top Selling Toy in America Retrieved from Fortune.com  Nazarli, A (2014, December 23) Toys and Children Retrieved from www.lexisnexis.com  Passport (2015, November). Deepening recession in Brazil weighs in on toy sales. Retrieved from http://www.portal.euromonitor.com  Passport. (April 17, 2013). Corporate Strategies in Emerging Toy Markets. Retrieved from http://www.portal.euromonitor.com
  • 26.
    21  Passport. (August24, 2014). Global Licensing Continues to Stimulate Traditional Toys and Games. Retrieved from http://www.portal.euromonitor.com  Passport (2015, October). Hasbro’s Exchange Rate Struggles. Retrieved from http://www.portal.euromonitor.com  Passport (2015, November). The High Tech Future of Radio/Remote Controlled Toys. Retrieved from http://www.portal.euromonitor.com  Passport. (July 1, 2015). The Influence of Technology in Toys and Games: Corporate Strategies. Retrieved from portal.euromonitor.com.  Passport. (October 21, 2015). Traditional Toys: The Growth of STEM and Physical Development Toys. Retrieved from portal.euromonitor.com  Passport. (August 6, 2015). Toys and Games: Global Trends, Developments, and Prospects. Retrieved from portal.euromonitor.com.  Pearce, L. (2011). SIC 3942: Dolls and Stuffed Toys. Retrieved from Gale Virtual Reference Library.  Pearce, L. (2011). SIC 5945: Hobby, Toy, and Game Shops. Retrieved from Gale Virtual Reference Library.  Phillips, J (2015 May) The Retail Market for Toys in the U.S Retrieved from Ibisworld.com  Shapiro, K (2011, September 28) UH OH: Little Tikes Recalls 1.7 Million Toy Nails for Choking Hazard Retrieved from Businessinsider.com  Shore, D. (March 10, 2015). Mattel Takes Barbie Online in an Effort to Revive Flagging Sales. Retrieved from portal.euromonitor.com  Smith, A (April 1, 2015). U.S. Smartphone Use in 2015 Retrieved from Pewinternet.org  StatisticBrain. (January 1, 2016). Star Wars Total Franchise Revenue. Retrieved from http://www.statisticbrain.com
  • 27.
    22  Statista (2014).Statistics and facts on the toy industry. from http://www.statista.com  Statista (2014, February). Toy retails sales revenue in the U.S. 2005-2013. Retrieved from http://www.statista.com  Tansel, U (2015, September 22) Asia Pacific: World’s Most Heavily Licensed Toy Market Retrieved from www.portal.euromonitor.com  The Numbers. (2015). Box Office History for Despicable Me Movies. Retrieved from the-numbers.com.  Thielman,, S. (February 23, 2015). The Rise and Fall and Rise of Hasbro’s TV Strategy What Went Wrong With The Hub, and what the Toymaker Hopes Will Go Right. Retrieved from www.adweek.com  Townsend, M and Palmeri, C. (September 25, 2014). Hasbro Wins Disney Frozen Toy Licenses in Blow to Mattel. Retrieved from http://www.bloomberg.com  Tradegood. (February 18, 2014). Emerging Markets Hold the Key for Further Success in Toys and Games. Retrieved from Tradegood.  Turks, A. (January 24, 2011). 9 Dumbest Fads to Ever Make Money. Retrieved from http://www.bcbusiness.ca/  United States Security and Exchange Commission. (May 21, 2015). Electronic Arts, Inc. Annual Report. Retrieved from the Electronic Arts Homepage.  United States Security and Exchange Commission. (December 18, 2015). Hasbro, Inc. Annual Report. Retrieved from the Investor Annual database.  United States Security and Exchange Commission. (December 31, 2014). JAKKS Pacific Annual Report. Retrieved from the JAKKS Pacific webpage.  United States Security and Exchange Commission. (February 25, 2015). Mattel, Inc. Annual Report. Retrieved from the Shareholder Database.  V-Mart (2016). About Us. Retrieved from IBEF.org
  • 28.
    23  Venturi, V(June 8, 2015). JAKKS Pacific Secures Licensing Agreement with Warner Bros. Consumer Products for Batman v Superman: Dawn of Justice Retrieved from Investors.Jakks.com  Wallenstein, A. (April 28, 2015). Netflix Ratings Revealed: New Data Sheds Light on Original Series’Audience Levels. Retrieved from the Variety webpage.  Westgarth, J. (March, 2014). Toy Retailing-UK. Retrieved January 13, 2016 from Mintel.  White, Daniel (January 20, 2016). Star Wars Toys Brought in $700 Million in 2015 Retrieved from Time.com  Whitney, Erin (April 28, 2015). The Most-Watched Netflix Show May Surprise You Retrieved from Huffingtonpost.com  Wired.Co.Uk (December 15, 2016). Why We Love Star Wars: An Explainer For ‘Normal’ People. Retrieved February 4, 2016 f rom Wired.Co.Uk  Yahoo Finance. (2016). Hasbro, Inc. Retrieved from Yahoo Finance.  Yahoo Finance. (2016). JAKKS Pacific, Inc. Retrieved from Yahoo Finance.  Yahoo Finance. (2016). Mattel, Inc. Retrieved from Yahoo Finance.
  • 29.
    Overview The toy industryis an evolving marketplace in which toys are manufactured and sold to children. The industry is run by a few major companies that include Mattel, Hasbro, and JAKKS Pacific. Many underlying companies include Geobra Brandstätte (Germany) and Namco Bandai (Japan). According to First Research database, “global toy sales exceed $80 billion”. These toy sales come from major markets including the United States, France, Germany, and Great Britain. Due to economic hardships over the past years, the European market has declined as well as the US market. This left openings for “developing countries in Asia, South America, and Africa” (First Research, 2016). See figure 1 for an extended view. The manufacturing process for the toy industry is quite different compared to the markets who do all of the heavy lifting. Like many other markets worldwide, China is the number one distributor and growing at a fast rate. While, The US toy market, is growing but at a slower rate, as of 2015. Percent of World Toy market by Region Current State The toy industry today is growing into a larger market. According to the NPD Group, “In the first half of 2015, the U.S. toy industry grew by 6.5 percent, or about $400 million” (2015). They predicted that the back half of the year would be up over $1 billion. The major companies are taking advantage of new trending “fads” like Frozen, Paw Patrol, and StarWars. Appendix A 29% 28%3% 28% 3% 9% Toy Sales by Region North America Europe Africa Asia South America Other 24
  • 30.
    Future Prospects: The futureis looking up for the toy industry worldwide. With a major incline in online shopping and cyber-related toys, the toy industry has not reached its full potential yet. The maturity of the industry will come when they fully incorporate online shopping into their campaign. These toy companies need to create their future now and move into the online market before the opportunity passed up. The online market generates a whole new customer base due to the convenience of buying from their homes. No more waiting in line at retail stores for 20 minutes at a time (Davis, 2015). According to the NPD Group, “For several years, many in the industry have been raving about the opportunities offered by online trading, satisfied that their performance online was good enough because they were recording double-digit increases”. As of right now the European markets are far ahead of the American toy markets. The toy industry is already growing by 15% but if the online market was executed correctly the market would grow upwards of 50% (NPD Group, 2016). Refer to figure 2 for the market shares of the online toy industry. Retail Market Share in 2012 Appendix A 25
  • 31.
    Industry Trends: The toyindustry is a forever trending marketplace due to children’s interest changing instantaneously. One of the fastest growing trends in the toy industry is the “Maker Movement”. This is the process of creating toys that children can build whatever they want with them. These toys include things like Legos and Mega Blocks. “According to 2014 point-of-sales data from The NPD Group, the Building Sets and Arts & Crafts categories grew by 13% and 3%, respectively, proving that kids love to create interesting structures, designs, inventions and other projects that will set them apart from others and let their talents shine through”(Toy Industry Association, 2015). Another trending idea is “Smart Play”, which focuses solely on educational toys for young children. These toys teach kids mathematics, science and reading skills. Some include games like Leap Frog and educational board games. (Toy Industry Association, 2015) The most trending item, by far, is anything Star Wars. Disney launched its Star Wars toy campaign in the first full week of September. It was reported that “about $1 of every $11 for the week (of Sept. 4) was spent on a Star Wars toy” (Cioletti, 2015). Figure 3 shows how Star Wars merchandise has increased. With these trends becoming more and more abundant, it is mandatory for companies to take advantage of them. total Star wars Toy Sales Appendix A 26
  • 32.
    Appendix B: PESTLE Thetoy industry is an industry that is very large, with many different areas to analyze. Using the PESTLE approach, we found many different factors that affect the industry. We looked at six specific areas in this analysis; Political forces, economical forces, social forces, technological forces, legal forces, and environmental forces, and how each of these areas affects the toy industry Political Political forces in the toy industry are very important to companies, as these are the factors that determine the extent to which a government may influence the industry. Specifically, we found that lobbying for tariffs on imported toys, as well as corruption in the government causing political divide, are very integral to the success companies endure. Corruption in Brazil’s government has led to a recent recession, causing spending on discretionary items to decrease, and with it, causing the demand for toys to decrease as well. This is an example of how a government can influence the industry. Political divide causes the economy to suffer, and as the economy suffers, industries such as toy manufacturing, do not succeed. We also found that lobbying for tariffs on imported toys affects the toy industry. Reducing the costs of tariffs on imported goods is important because it allows companies to manufacture their toys at a cheaper price, and thus increase their profit margins. Economic The toy industry is also affected by economic factors. What we identified in this area is the trends within seasonal spending. Spending in this industry sees a majority of its revenues during holiday seasons, specifically in the fourth quarter of the year. Specifically, Fortune.com identified Christmas week as the most important week for toy companies. This past year, Christmas week generated 8% of the annual sales in the toy industry. Another trend we identified in the economics sector was the differentiation in spending among income levels. This is evident in the recession in Brazil, where the lower class represents 54% of the economy, and is not spending money on anything other than the essentials to survive. Income levels are very important to identify in order to succeed in the toy industry. Social In the social sector of the toy industry, we identified that trends were apparent when it comes to moving away from traditional toys, as well as attracting the child population. We found that many companies are moving away from the traditional toys, and favoring toys that are more technologically advanced. Toys such as iPads, and other tablets have become more attractive in the industry, and are using an educational aspect to drive consumers into purchasing them. We also noted that the child population is the key to the toy industry. While they may not actually be purchasing the product, children are the most influential in the industry. Figure 3 in the appendix shows a chart of the market segmentation in the industry, and from this we can conclude that appealing to the older population, is important, but much of this is reliant on the influence of the younger population. 27
  • 33.
    Appendix B: PESTLE Technology Wealso look the technology sector in toys, and we found that developing a supply chain system, as well as emerging to online markets, is very important in the industry. We found that “the growth of technology is being fueled by increasing popularity of collectibles. Toys based on Hollywood blockbuster films and technology that allows toys to do such things as talk back.” Another thing we found out is that children growing up in a technology based environment “has created a generation of digital natives; children who are very comfortable using technology and increasingly interested in video games, as well as traditional toys and games that incorporate some virtual component.” Technology is important in this industry, because creating an enhanced product, will likely improve a company’s ability to increase their sales and develop a relationship with its customers. Legal From the legal aspect, we found that the industry is very focused on producing safe products, but important areas we targeted were safety issues-recalls, as well as intellectual property rights. Safety issue recalls are important to identify, because there are sunk costs that companies have. Not only can companies lose millions of dollars due to recalls, but they also risk losing the trust they have built up with their customers. In 2012, there were an estimated 262,300 toy-related injuries treated in United States hospital emergency rooms. Of these injuries, seventy percent involved children 12 years old or younger. There were also 13 reports of toy-related deaths of children younger than 15 years old. Toy recalls pose a major threat to companies, and by reducing these, a company can gain a leg up on the competition as well as keep their brand as a reliable company. We also found that intellectual property rights were important for companies to gain. In this past year, licensing contracts with Star Wars, as well as other popular movies and shows, have fueled millions of dollars for companies. According to Fortune.com, Star Wars already has made over $700 million in toy sales and is only continuing to grow. By obtaining these rights, as well as by continuing to produce entertaining products with the rights, companies are able to attract customers from many different markets, and sell their products without competition, all over the world. Environmental The final factor of the PESTLE analysis we researched was environmental. In the environmental aspect, we identified waste production and environmentally friendly toys as key areas among the industry. Environmentally friendly toys have been a growing trend over the past few years because of the concern for cleaning up the environment. Because of this, many consumers have gone out of their way to buy only eco-friendly products. This is important to identify, because eco-friendly toys cost more than the traditional toys, but the demand within the industry could make a potential transition to eco-friendly toys a lucrative investment. 28
  • 34.
    Appendix C: Porters Competitive Rivalry Threatof New Entry Buyer Power Threat of substitutes Supplier Power Threat of new Entry: LOW  Highly concentrate  Top 50 companies control 80% of global toy sales (FirstResearch)  Brand/Product loyalty  Ex. Barbie  Very high initial investment Buyer Power: Moderate  Dependency on contracts  Large amount of channels for distribution.  Ex. Retail stores, department stores, toy stores, etc. Supplier Power: Moderate  Depend mostly on supplies that are easily attainable  Ex. Paper, plastic, etc.  Prices can fluctuate based on economy of plastic and oil. Threat of Substitutes: High  New Technology  Ex. Gaming, Apps, etc.  Toys = Entertainment  Abundant forms of entertainment. Competitive Rivalry: Very High  Consolidated industry  3-4 Major Players  Demand for new toys  Many toys are short-lived  Intellectual Property Rights (licensing) 29
  • 35.
  • 36.
    Appendix E top tenGDP’s worldwide currently Top ten countries in population size 30
  • 37.
  • 38.
  • 39.
    Appendix H Mattel HasbroJAKKS Pacific As of 8/31/2016 $27.59 $74.28 $7.45 2015 $26.90 $74.59 $9.85 2014 $38.83 $59.20 $8.76 2013 $45.56 $55.01 $13.06 2012 $36.62 $38.17 $19.07 Yahoo finance Mattel Hasbro JAKKS Pacific 2014 $498 $415 $21 2013 $903 $286 $(53) 2012 $776 $335 $(104) Mattel Hasbro JAKKS Pacific 2014 $209.5 $222.56 - 2013 $201.9 $207.59 - 2012 $195.1 $201.2 - 2014 Annual Reports of Mattel, Hasbro, and Jakks 2014 Annual Reports of Mattel, Hasbro, and Jakks 33
  • 40.
    Appendix I Key PartnersKey Activities Key Resources Value Propositions Customer Relationships Customer Segments Channels Cost Structure Revenue Streams Who are our Key Partners? Who are our key suppliers? Which Key Resources are we acquiring from partners? Which Key Activities do partners perform? What Key Activities do our Value Propositions require? Our Distribution Channels? Customer Relationships? Revenue streams? What value do we deliver to the customer? Which one of our customer’s problems are we helping to solve? What bundles of products and services are we offering to each Customer Segment? Which customer needs are we satisfying? What type of relationship does each of our Customer Segments expect us to establish and maintain with them? Which ones have we established? How are they integrated with the rest of our business model? How costly are they? For whom are we creating value? Who are our most important customers? What Key Resources do our Value Propositions require? Our Distribution Channels? Customer Relationships? Revenue Streams? Through which Channels do our Customer Segments want to be reached? How are we reaching them now? How are our Channels integrated? Which ones work best? Which ones are most cost-efficient? How are we integrating them with customer routines? What are the most important costs inherent in our business model? Which Key Resources are most expensive? Which Key Activities are most expensive? For what value are our customers really willing to pay? For what do they currently pay? How are they currently paying? How would they prefer to pay? How much does each Revenue Stream contribute to overall revenues? The Business Model Canvas Designed for: Designed by: On: dd/mm/yyyy Iteration # www.businessmodelgeneration.com d t e d t e -Barbie -Hotwheels -WWE -Boom Co. -Ever After High -Sony -Pixar -THQ -Monster High -Gameloft -Electrocomponents -DC Comics -Warner Bros. -Netflix -Promotions -Entertainment -Toys -Events -Brand Status -Parents with children under the age of ten -Toy Collectors -Invested Gamers -American Girl -Promotions -Production -Events -Make a Wish Foundation -Childrens Hospital Association -Other charities -Mattel Children’s Hospital UCLA -The Special Olympics -Partnerships -Sponsorships -Plastic -Rubber -Stockholders -TV -Radio -E-Mail -Newspapers -Word of Mouth -Mail -Toys -Partnerships -Sponsors -TV -Inventory -Salaries -Travel -Electricity Mattel, Inc. MID107 Team 4 2/1/2016 1t 34
  • 41.
    Appendix K- FinancialData Company Mattel 2014 Mattel 2013 Mattel 2012 Sales $6,023,819 $6,484,892 $6,420,881 Cost of Goods Sold $3,022,797 $3,006,009 $3,011,684 Current Assests $3,185,951 $3,377,993 $3,556,805 Inventory $562,047 $568,843 $465,057 Accounts Receivable $1,093,180 $1,260,105 $1,226,833 Current liabilities $1,088,949 $1,047,440 $1,716,012 Operating Income $653,714 $1,168,103 $1,021,015 Net Profit (before Taxes) $586,910 $1,099,128 $945,045 Net Income $498,874 $903,944 $776,464 Total Assests $6,722,046 $6,439,626 $6,526,785 Total liabilities $3,772,975 $3,188,067 $3,459,741 Stockholders equity $2,949,071 $3,251,559 $3,067,044 Company Hasbro 2014 Hasbro 2013 Hasbro 2012 Sales $4,277,207 $4,082,157 $4,088,983 Cost of Goods Sold $1,698,372 $1,672,901 $1,671,980 Current Assests $2,719,100 $2,480,457 $2,508,202 Inventory $339,572 $348,794 $316,049 Accounts Receivable $1,094,673 $1,093,620 $1,029,959 Current liabilities $1,074,934 $1,363,280 $960,435 Operating Income $635,375 $467,093 $551,785 Net Profit (before Taxes) $539,988 $351,822 $453,402 Net Income $415,930 $286,198 $335,999 Total Assests $4,532,142 $4,402,267 $4,325,387 Total liabilities $3,023,748 $2,674,479 $2,818,008 Stockholders equity $1,465,664 $1,682,343 $1,507,379 Company Jakks 2014 Jakks 2013 Jakks 2012 Sales $810,060 $632,925 $666,762 Cost of Goods Sold $574,253 $477,146 $468,825 Current Assests $437,593 $320,932 $406,056 Inventory $78,827 $46,784 $59,690 Accounts Receivable $234,516 $101,223 $105,455 Current liabilities $191,348 $184,595 $219,475 Operating Income $31,327 $(44,532) $(13,222) Net Profit (before Taxes) $25,224 $(51,295) $(18,649) Net Income $21,509 $(53,906) $(104,800) Total Assests $561,782 $449,844 $554,825 Total liabilities $416,698 $301,159 $347,605 Stockholders equity $145,084 $148,685 $207,220 36
  • 42.
    Appendix L -Ratios profitability 2005-12 2006-12 2007-12 2008-12 2009-12 2010-12 2011-12 2012-12 2013-12 2014-12 TTM Tax Rate % 36.04 13.28 14.70 22.20 19.90 19.13 20.83 17.84 17.76 15.00 25.74 Net Margin % 8.05 10.49 10.05 6.41 9.74 11.69 12.26 12.09 13.94 8.28 5.34 Asset Turnover (Average) 1.13 1.21 1.22 1.25 1.15 1.15 1.13 1.05 1.00 0.92 0.84 Return on Assets % 9.14 12.71 12.29 8.01 11.18 13.43 13.86 12.73 13.94 7.58 4.49 Financial Leverage (Average) 2.08 2.04 2.08 2.21 1.89 2.06 2.17 2.13 1.98 2.28 2.58 Return on Equity % 18.59 26.15 25.32 17.16 22.75 26.55 29.34 27.35 28.61 16.09 10.79 Return on Invested Capital % 15.19 21.27 19.79 13.52 18.41 20.54 20.55 19.30 20.44 11.31 7.19 Interest Coverage — — — 6.95 10.19 14.06 13.89 11.64 15.00 8.40 5.84 Mattel Profitability 2005-12 2006-12 2007-12 2008-12 2009-12 2010-12 2011-12 2012-12 2013-12 2014-12 TTM Tax Rate % 31.79 32.63 27.98 30.45 29.22 21.66 20.77 25.89 19.30 23.46 23.65 Net Margin % 6.87 7.30 8.68 7.63 9.22 9.94 8.99 8.22 7.01 9.72 10.42 Asset Turnover (Average) 0.94 0.99 1.21 1.26 1.15 1.00 1.04 0.97 0.94 0.96 0.94 Return on Assets % 6.48 7.19 10.51 9.58 10.61 9.96 9.37 7.95 6.56 9.31 9.81 Financial Leverage (Average) 1.92 2.01 2.34 2.28 2.44 2.53 2.91 2.87 2.62 3.09 2.97 Return on Equity % 12.61 14.11 22.79 22.10 25.12 24.78 25.41 22.98 17.95 26.43 29.33 Return on Invested Capital % 10.24 10.67 15.70 15.05 17.18 15.87 14.95 13.02 11.84 15.24 16.28 Interest Coverage — — — 10.36 9.60 7.18 6.46 5.97 4.33 6.80 7.02 Hasbro MorningStar 37
  • 43.
    Appendix L (continued) Profitability2005-12 2006-12 2007-12 2008-12 2009-12 2010-12 2011-12 2012-12 2013-12 2014-12 TTM Tax Rate % 34.30 31.68 31.30 14.45 — 5.41 — — — 14.73 10.83 Net Margin % 9.60 9.46 10.38 8.42 -47.97 6.30 1.25 -15.72 -8.52 2.66 4.23 Asset Turnover (Average) 0.91 0.94 0.92 0.90 0.97 1.18 1.09 1.14 1.26 1.60 1.28 Return on Assets % 8.75 8.85 9.55 7.56 -46.39 7.42 1.36 -17.91 -10.73 4.25 5.42 Financial Leverage (Average) 1.44 1.45 1.42 1.38 1.70 1.54 1.56 2.68 3.03 3.89 3.77 Return on Equity % 13.01 12.77 13.69 10.58 -68.90 11.99 2.10 -34.89 -30.29 14.67 22.51 Return on Invested Capital % 10.76 10.84 11.77 9.20 -56.56 10.64 2.74 -23.12 -13.58 9.91 11.49 Interest Coverage — — — 37.66 -59.05 8.39 0.93 -1.02 -4.16 3.02 4.17 Jakks MorningStar 38

Editor's Notes

  • #37 Why? World toy market 28% Asia 28% Europe In developed economies the growth is increasing at a very slow rate 7 of the top ten GDPs r emerging economies 7 top population countries are in top ten in GDP 9 of top ten child populated countries are emerging economies So if the economy is doing well, and there is more consumers, preferably children, these emerging economies have huge potential. Then recomending certain areas that show the most potential- is average amount parents spend on their child China and India are emerging markets They have 2/3 of the worlds population And with there economies being in the top three in GDP Creates a huge growth opportunity