Profitable Growth is What Matters
•
5 likes•1,100 views

World Class Benchmarking measures the financial performance of a company through Profitable Growth. Our database includes about 27,000 companies worldwide and each company is benchmarked versus all its global sector peers. Learn more about it in this post, and why Profitable Growth is what matters to you as an investor. Learn more at: http://becomeabetterinvestor.net/blog/profitable-growth-is-what-matters/

Recommended
Recommended
More Related Content
What's hot
What's hot (20)
Similar to Profitable Growth is What Matters
Similar to Profitable Growth is What Matters (20)
More from Andrew Stotz, PhD, CFA
More from Andrew Stotz, PhD, CFA (20)
Recently uploaded
Recently uploaded (20)
Profitable Growth is What Matters
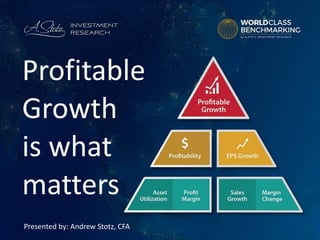
- 1. Profitable Growth is what matters Presented by: Andrew Stotz, CFA
- 2. 215 June 2016 '11 '12 '13 '14 PTM 5 4 5 4 2 '11 '12 '13 '14 PTM '11 '12 '13 '14 PTM 4 4 4 4 2 6 5 8 4 2 '11 '12 '13 '14 PTM '11 '12 '13 '14 PTM '11 '12 '13 '14 PTM '11 '12 '13 '14 PTM 2 2 3 5 4 6 6 5 4 4 9 7 10 10 4 4 4 4 2 2 Benchmarked against 1,130 Info Tech companies worldwide. Profitable Growth Asset utilization Profit margin Sales growth Margin change Profitability Growth Source: A. Stotz Investment Research Notes: 1 = top ranking and 10 = worst. *Past 12 months of published data. This is what you need to know about financial performance
- 3. 315 June 2016 Global universe of about 27,000 companies in 10 sectors Rank the company on Profitable Growth from 1 (best) to 10 (worst), against all sector peers of similar size Share price performance of superior Profitable Growth companies has beaten peers Companies with large improvements in Profitable Growth rank yielded outstanding share price returns The bottom of the triangle shows the strengths and weaknesses of the company and builds up to the Profitable Growth ranking Source: A. Stotz Investment Research Executive summary
- 4. 415 June 2016 Profitable Growth is what matters Why Profitable Growth matters Classifying peer group How to read the Triangle
- 5. 515 June 2016 Why Profitable Growth matters Superior Profitable Growth companies beat their peers Companies with large improvements in Profitable Growth rank yield outstanding returns Here is an academic-style study we did
- 6. 615 June 2016 We started this study with 93,500 companies that were listed at any point in time, anywhere in the world from March 1995 to March 2015 This left us with about 19,500 stocks listed on different markets across the world 19,500 companies across the world We removed 4,000 stocks that did not have the fundamental data needed to calculate A. Stotz Profitable Growth metrics We then removed financial companies and companies with a market capitalization of less than US$50m which left us with 23,500 nonfinancial companies worldwide
- 7. 715 June 2016 Methodology We grouped all companies by size within the 10 different sectors: Large: Companies with either assets or sales of more than US$700m Small: Companies with either assets or sales of less than or equal to US$130m Medium: Companies that are not large or small If the sales and assets for a company showed conflicting results we let the size of the sales determine the group A company that had sales of a large company, but assets of a medium one we classified as large and a company with medium sales and large assets we classified as medium The remaining one percent of all companies, either had large sales and small assets or small sales and large assets, were classified as medium companies
- 8. 815 June 2016 Methodology (cont.) First we calculated the two components of our A. Stotz Profitable Growth measure: We ranked the companies in deciles on our combined Profitable Growth score relative to all their sector peers of similar size across the world in each year from 1995 to 2015 𝑃𝑟𝑜𝑓𝑖𝑡𝑎𝑏𝑖𝑙𝑖𝑡𝑦 = 𝑁𝑒𝑡 𝑖𝑛𝑐𝑜𝑚𝑒 (𝐵𝑒𝑔𝑖𝑛𝑛𝑖𝑛𝑔 𝑡𝑜𝑡𝑎𝑙 𝑎𝑠𝑠𝑒𝑡𝑠 + 𝐸𝑛𝑑𝑖𝑛𝑔 𝑡𝑜𝑡𝑎𝑙 𝑎𝑠𝑠𝑒𝑡𝑠)/2 𝐺𝑟𝑜𝑤𝑡ℎ = 𝐶𝑢𝑟𝑟𝑒𝑛𝑡 𝑦𝑒𝑎𝑟′ 𝑠 𝑒𝑎𝑟𝑛𝑖𝑛𝑔𝑠 𝑝𝑒𝑟 𝑠ℎ𝑎𝑟𝑒 𝐸𝑃𝑆 − 𝑃𝑟𝑖𝑜𝑟 𝑦𝑒𝑎𝑟′ 𝑠 𝐸𝑃𝑆 𝐴𝑏𝑠𝑜𝑙𝑢𝑡𝑒 𝑣𝑎𝑙𝑢𝑒 𝑜𝑓 𝑝𝑟𝑖𝑜𝑟 𝑦𝑒𝑎𝑟′ 𝑠 𝐸𝑃𝑆
- 9. 915 June 2016 Methodology (cont.) We calculated the one-year stock price return from the prior year’s reporting date, for example for Dec 2013 results, if we assume that the company announced its financial results by Mar 2014 then its one-year price return was from Mar 2013-Mar 2014 Then we calculated the simple average price return for each Profitable Growth decile and the compound annual price return during Mar 1995-Mar 2015 To eliminate outliers, we excluded 1% of the observations, which meant stocks that had a price change of more than 500% or less than -85% in any one year We repeated this process for each size group; large, medium and small and look at the results separately
- 10. 1015 June 2016 Methodology (cont.) The final number of companies included in each size group after excluding all companies that didn’t have year-end in December and adjusting for outliers: Large: 3,600 companies Medium: 4,400 companies Small: 4,000 companies Total: 12,000 companies
- 11. 1115 June 2016 The higher deciles yielded higher returns versus the lower deciles Over the time period studied, even the worst decile showed an average annual return that was positive But the decile with the best Profitable Growth returned 15x higher annual return than the worst Large: Superior Profitable Growth companies beat their peers Sources: A. Stotz Investment Research, Thomson Reuters 31 24 21 18 17 16 12 10 6 2 16 - 5 10 15 20 25 30 35 Best 2 3 4 5 6 7 8 9 Worst Simple average Average of all groups Price return from Mar 1995 - Mar 2015 (%, p.a.)
- 12. 1215 June 2016 The higher ranked deciles yielded higher returns For medium sized companies the difference between best and worst were even more significant than for large The two worst deciles showed a negative average annual return Medium: Superior Profitable Growth companies beat their peers Sources: A. Stotz Investment Research, Thomson Reuters 34 26 19 15 12 8 5 2 (1) (7) 12 (10) (5) - 5 10 15 20 25 30 35 40 Best 2 3 4 5 6 7 8 9 Worst Simple average Average of all groups Price return from Mar 1995 - Mar 2015 (%, p.a.)
- 13. 1315 June 2016 Again, the higher ranked deciles yielded higher returns The Profitable Growth rank shows a clear relationship with share price A high rank means a high share price, i.e. a higher Profitable Growth rank means a higher value of the business This holds true for large, medium and small companies Small: Superior Profitable Growth companies beat their peers Sources: A. Stotz Investment Research, Thomson Reuters 33 22 18 14 9 5 4 2 (5) (12) 9 (15) (10) (5) - 5 10 15 20 25 30 35 40 Best 2 3 4 5 6 7 8 9 Worst Simple average Average of all groups Price return from Mar 1995 - Mar 2015 (%, p.a.)
- 14. 1415 June 2016 Methodology part 2 We analyzed the share price performance of the companies that changed their Profitable Growth rankings in each size group We calculated the change in decile ranking from the prior year in each group, for example, if the company was ranked in the 3rd decile this year versus the 4th decile last year, the company improved by one step Then we grouped the companies that showed no change in decile rank as the starting point. After that we grouped every company that showed an incremental one, two or three step improvement into another group. From this we ended up with seven groups, each containing a different number of companies Then we calculated the simple average price change of each group each year, assuming that we started to invest in each group every year in March, from Mar 1995-Mar 2015 and compounded the annual returns of each group
- 15. 1515 June 2016 The Profitable Growth group that improved by 7-9 steps, returned 33% p.a., more than a double return compared to the group that showed no improvement The Profitable Growth group that fell 7-9 steps in decile rank displayed a slightly negative price performance Large: Companies with large improvements in Profitable Growth rank yield outstanding returns Sources: A. Stotz Investment Research, Thomson Reuters 33 28 23 16 8 3 (0) (5) - 5 10 15 20 25 30 35 +7-9 +4-6 +1-3 Same -1-3 -4-6 -7-9 Simple average Price return from Mar 1996 - Mar 2015 (%, p.a.)
- 16. 1615 June 2016 It looks similar for medium sized companies as for large The Profitable Growth groups that improved by 4-9 steps, returned 31% The Profitable Growth groups that fell 4-9 steps in decile rank displayed a negative price performance, losing on average 4-5% The market is less discerning, strong improvement means almost equally strong share price performance Medium: Companies with large improvements in Profitable Growth rank yield outstanding returns Sources: A. Stotz Investment Research, Thomson Reuters 31 31 21 13 4 (5) (4) (10) (5) - 5 10 15 20 25 30 35 +7-9 +4-6 +1-3 Same -1-3 -4-6 -7-9 Simple average Price return from Mar 1996 - Mar 2015 (%, p.a.)
- 17. 1715 June 2016 For small companies the group that improved 4-6 steps returned more than the group that improve 7-9 steps It seemed like the market was more skeptical to extreme improvements for small companies The market rewards improvements in Profitable Growth and this holds true for large, medium and small companies Small: Companies with large improvements in Profitable Growth rank yield outstanding returns Sources: A. Stotz Investment Research, Thomson Reuters 24 27 17 11 3 (3) (10) (15) (10) (5) - 5 10 15 20 25 30 +7-9 +4-6 +1-3 Same -1-3 -4-6 -7-9 Simple average Price return from Mar 1996 - Mar 2015 (%, p.a.)
- 18. 1815 June 2016 Results from our research looking at 12,000 companies across the world Share price performance of superior Profitable Growth companies beat their peers Companies with large improvements in Profitable Growth rank yield outstanding share price returns This holds true for large, medium and small companies Source: A. Stotz Investment Research What you have learned about why Profitable Growth matters
- 19. 1915 June 2016 Classifying the peer group What is the size of the business? What sector does the company operate in?
- 20. 2015 June 2016 • Size does matter • Because small companies tend to grow faster than large • First we group the company into one of the following three size categories: • Small, medium or large What is the size of the business?
- 21. 2115 June 2016 • Large firms • Either asset or revenue more than US$700m • Small firms • Either asset or revenue less than US$130m • Medium firms • Either assets or revenue between large and small Large, medium or small?
- 22. 2215 June 2016 • No two companies are alike, but some are more alike than others • We use The Global Industry Classification Standard (GICS®) developed by MSCI & Standard & Poor's • Currently there are 10 Sectors and 24 Industry Groups • We rank the company within one of the ten major sectors There are ten major sectors in the world
- 23. 2315 June 2016 1. Consumer discretionary (Cons. Disc.) – Ford 2. Consumer Staples (Cons. Staples) – Wal-Mart 3. Energy – Exxon Mobil 4. Health Care – Johnson & Johnson 5. Industrials – General Electric 6. Information Technology (Info. Tech.) – Google 7. Materials – Monsanto 8. Real Estate – Simon Property Group 9. Telecom – AT&T 10.Utilities – Duke Energy What sector does the company operate in?
- 24. 2415 June 2016 • We first classify the business based on it size (Small, medium, large) • A large company should not be compared against a small company and vice versa • We then classify the company into a Global sector • A consumer company should not be compared against an energy company • The company is then assigned a 1 (best) to 10 (worst) ranking within its size category of its sector What you have learned about classifying the peer group
- 25. 2515 June 2016 How to read the Triangle The top of the triangle is what matters The results at the top of the triangle are explained by the results below Level two and three explain what is driving Profitable Growth
- 26. 2615 June 2016 Source: A. Stotz Investment Research The top of the triangle is what matters: Profitable Growth
- 27. 2715 June 2016 Source: A. Stotz Investment Research Notes: 1 = top ranking and 10 = worst. PTM = Past 12 months of published data. We rank the company from 1 (best) to 10 (worst) Best '11 '12 '13 '14 PTM 1 1 2 1 2 1 3 2 3 2 4 3 4 3 1 5 4 5 4 2 6 5 6 5 3 7 6 7 6 4 8 7 8 7 5 9 8 9 8 6 10 9 10 9 7 10 10 8 9 10 Profitable Growth Worst Subject company The company is grouped into deciles based on financial performance
- 28. 2815 June 2016 Source: A. Stotz Investment Research Notes: 1 = top ranking and 10 = worst. PTM = Past 12 months of published data. We track the company for 5 periods, updated quarterly Five periods of ranking In the past 12 months the company’s decile ranking among its peers improved to No. 2 from No. 4 Company was ranked in the 4th decile in 2014 Best '11 '12 '13 '14 PTM 1 1 2 1 2 1 3 2 3 2 4 3 4 3 1 5 4 5 4 2 6 5 6 5 3 7 6 7 6 4 8 7 8 7 5 9 8 9 8 6 10 9 10 9 7 10 10 8 9 10 Profitable Growth Worst Subject company
- 29. 2915 June 2016 '11 '12 '13 '14 PTM 5 4 5 4 2 '11 '12 '13 '14 PTM '11 '12 '13 '14 PTM 4 4 4 4 2 6 5 8 4 2 '11 '12 '13 '14 PTM '11 '12 '13 '14 PTM '11 '12 '13 '14 PTM '11 '12 '13 '14 PTM 2 2 3 5 4 6 6 5 4 4 9 7 10 10 4 4 4 4 2 2 Benchmarked against 1,130 Info Tech companies worldwide. Profitable Growth Asset utilization Profit margin Sales growth Margin change Profitability Growth Source: A. Stotz Investment Research Notes: 1 = top ranking and 10 = worst. *Past 12 months of published data. We put the company’s 1 to 10 rank into the triangle '11 '12 '13 '14 PTM 1 1 2 1 2 1 3 2 3 2 4 3 4 3 1 5 4 5 4 2 6 5 6 5 3 7 6 7 6 4 8 7 8 7 5 9 8 9 8 6 10 9 10 9 7 10 10 8 9 10 Profitable Growth
- 30. 3015 June 2016 Source: A. Stotz Investment Research Profitable Growth comes from a combination of the company’s score on profitability and growth Profitable growth is explained by the two measures below it
- 31. 3115 June 2016 Source: A. Stotz Investment Research Strong profit growth with minimum asset use is great This Profitable Growth drives truly sustainable long-run value in the business Reduced asset driven earnings growth is great, because this decreases the need for new capital injections
- 32. 3215 June 2016 Source: A. Stotz Investment Research Let’s review the first driver of Profitable Growth: Profitability
- 33. 3315 June 2016 Source: A. Stotz Investment Research Profitability – Strong profitability means generating more profit from assets in place Profit divided by assets = Return on Assets Getting more out of assets means the company needs less capital BEWARE: Very high profitability, with no growth, is not sustainable
- 34. 3415 June 2016 Source: A. Stotz Investment Research Let’s review the second driver of Profitable Growth: EPS growth
- 35. 3515 June 2016 Source: A. Stotz Investment Research Growth – Earnings per share growth, the market values it and so should you Annual percent change in profit per share This shows that customers want the company’s product and that it can be produced profitably BEWARE: High growth, but low profitability is often waste of money
- 36. 3615 June 2016 '11 '12 '13 '14 PTM 5 4 5 4 2 '11 '12 '13 '14 PTM '11 '12 '13 '14 PTM 4 4 4 4 2 6 5 8 4 2 '11 '12 '13 '14 PTM '11 '12 '13 '14 PTM '11 '12 '13 '14 PTM '11 '12 '13 '14 PTM 2 2 3 5 4 6 6 5 4 4 9 7 10 10 4 4 4 4 2 2 Benchmarked against 1,130 Info Tech companies worldwide. Profitable Growth Asset utilization Profit margin Sales growth Margin change Profitability Growth Source: A. Stotz Investment Research Notes: 1 = top ranking and 10 = worst. *Past 12 months of published data. Level two explains what is driving Profitable Growth
- 37. 3715 June 2016 Source: A. Stotz Investment Research The results at the top of the triangle are explained by the results below Each measure is explained by the two measures below it
- 38. 3815 June 2016 Source: A. Stotz Investment Research Let’s review the two measures that drive profitability
- 39. 3915 June 2016 Source: A. Stotz Investment Research Asset utilization is the amount of revenue the company generates from the assets in place Sales divided by assets Getting more revenue from the assets is one way to increase profitability Careful asset growth preserves capital BEWARE: Too-tight asset growth policy prevents sales growth
- 40. 4015 June 2016 Source: A. Stotz Investment Research Profit margin shows how good the company is at cost control Profit divided by sales A strong profit margin shows that products that customers want is delivered profitably This is one measure of the strength of the management team BEWARE: Too-tight cost control can constrict growth
- 41. 4115 June 2016 Source: A. Stotz Investment Research Let’s review the two measures that drive EPS growth
- 42. 4215 June 2016 Source: A. Stotz Investment Research Sales growth proves that customers want the product Annual change in sales This is the part of EPS growth that is externally driven Essential to grow the business, no sales growth means no customer demand BEWARE: Growth without profit ends painfully
- 43. 4315 June 2016 Source: A. Stotz Investment Research Improving the profit margin is one of the fastest routes to strong EPS growth Annual change in net profit margin Margin improvement comes from management team’s focused effort It means the company is getting more profit from every sale BEWARE: Too high prices, or low costs could hurt sales growth
- 44. 4415 June 2016 '11 '12 '13 '14 PTM 5 4 5 4 2 '11 '12 '13 '14 PTM '11 '12 '13 '14 PTM 4 4 4 4 2 6 5 8 4 2 '11 '12 '13 '14 PTM '11 '12 '13 '14 PTM '11 '12 '13 '14 PTM '11 '12 '13 '14 PTM 2 2 3 5 4 6 6 5 4 4 9 7 10 10 4 4 4 4 2 2 Benchmarked against 1,130 Info Tech companies worldwide. Profitable Growth Asset utilization Profit margin Sales growth Margin change Profitability Growth Source: A. Stotz Investment Research Notes: 1 = top ranking and 10 = worst. *Past 12 months of published data. Level two and three explain what is driving Profitable Growth
- 45. 4515 June 2016 Results at the top of the triangle are explained by results below The company is ranked against peers on six different measures, four of them on the bottom of the triangle 1. Asset utilization is the revenue generated from assets in place 2. Profit margin shows how good the company is at cost control 3. Sales growth proves that customers want the product 4. A rising profit margin is an internal driver of EPS growth Level two and three explain what is driving Profitable Growth Source: A. Stotz Investment Research What you have learned about how to read the Triangle
- 46. 4615 June 2016 Global universe of about 27,000 companies in 10 sectors Rank the company on Profitable Growth from 1 (best) to 10 (worst), against all sector peers of similar size Share price performance of superior Profitable Growth companies beat their peers Companies with large improvements in Profitable Growth rank yield outstanding share price returns The bottom of the triangle shows the strengths and weaknesses of the company and builds up to the Profitable Growth ranking Source: A. Stotz Investment Research What you have learned about World Class Benchmarking
- 47. 15 June 2016 47 Join us at: becomeabetterinves tor.net/join
Editor's Notes
- D:\SKD\Testing\Test ROA and EPS growth.xlsx
- D:\SKD\Testing\Test ROA and EPS growth.xlsx
- D:\SKD\Testing\Test ROA and EPS growth.xlsx
- D:\SKD\Testing\Test ROA and EPS growth.xlsx
- D:\SKD\Testing\Test ROA and EPS growth.xlsx
- D:\SKD\Testing\Test ROA and EPS growth.xlsx