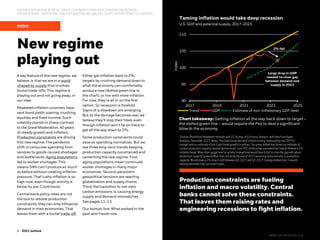
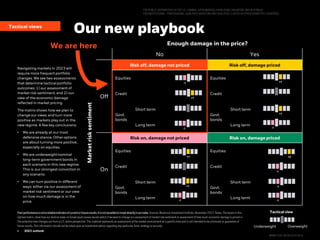
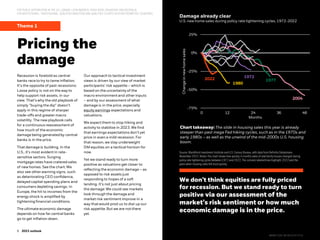
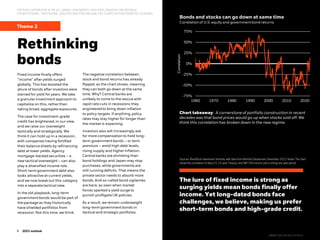
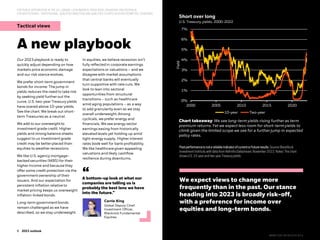
The document discusses a new investment playbook for 2023 in light of a new macroeconomic regime characterized by greater volatility and inflation. Key points:
- Central banks are deliberately causing recessions through aggressive rate hikes to reduce inflation, making recession likely. However, inflation will remain above targets.
- The first investment theme is "pricing the damage," as what matters most is how much economic damage is already reflected in market prices. Equity valuations do not yet reflect expected damage.
- The second theme is "rethinking bonds," as this regime calls for higher yields. Short-term government bonds and mortgage securities are favored for income.
- The third theme is "living with inflation," as
China Exit or Co-Investment Opportunities for German PE InvestorsL.E.K. Consulting
L.E.K.'s Karin von Kienlin recently presented at BVK on a study conducted by L.E.K. Munich and Shanghai. They wished to:
- Understand developments in Chinese equity investments in both the domestic China / pan-Asian market and cross-border investments between China and Germany / Europe
- Identify trends in likely future investment behavior and its drivers
- Defining success factors both for Chinese and German investors / corporates as to how to benefit from the potential opportunities of cross-border investments and cooperation
Learn more in the presentation here.
EY's European Banking Barometer – 2015 identifies the views of 226 senior European bankers across 11 markets regarding their views of the macro-economic outlook and the impact they think it will have on the banking industry in 2015.
For further information visit: www.ey.com/ebb
The Fourth Annual Global Mobility Study [hyperlink] by L.E.K. Consulting, Vision Mobility and CuriosityCX highlights that there is a much greater uptake of ride-hailing and other new mobility options in India and China than in mature western economies. With relatively low levels of car ownership and less developed public transport systems in these Asian countries, new mobility use is now comparable with and set to overtake traditional transport for a segment of the population.
TMT Outlook 2017: A new wave of advances offer opportunities and challengesDeloitte United States
Important trends continue to shape the technology, media, and telecommunications (TMT) industry. What developments should you anticipate in 2017? https://subscriptions.deloitte.com/default.aspx?eventid=1323075
Summary: Even in a time of high biopharma valuations, adopting an activist mentality adds rigor to capital allocation and strategic decision-making, improving not just returns to shareholders but long-term value creation. Therefore, biopharma management teams and boards of directors should proactively assess the “fitness” of their capital allocation strategies and their alignment with operational performance goals by taking an outsider’s view of the business even when times are good — and before a material stumble provides a compelling reason for an outsider to act. For more on this topic, go to http://www.ey.com/GL/en/Industries/Life-Sciences/EY-vital-signs-how-fit-is-your-capital-allocation-strategy.
On June 21st, PwC’s Health Research Institute (HRI) released its annual Medical Cost Trend: Behind the Numbers 2017 report. PwC’s HRI anticipates a 6.5% growth rate for 2017—the same as was projected for 2016. The report identifies the key inflators and deflators as well as historical context to better understand the medical cost trend for 2017. Increases in the trend due to utilization of convenient care access points and an uptick in behavioral healthcare benefits for employees are being offset by more aggressive strategies by pharmacy benefit
The Diversity Imperative: 14th Annual Australian Chief Executive StudyPwC's Strategy&
This report provides insight into the 2013 Australian Chief Executive Study findings, compares the results to the global market and identifies trends. Our analysis looks at trends relating to performance and tenure; reasons for CEO turnover; and the number of insider appointments versus outsider appointments.
18th Annual Global CEO Survey - Technology industry key findingsPwC
Tech CEOs are optimistic about the global economy and both near term and future revenue growth. They view strategic alliances, including partnering with competitors, as a primary means to grow their businesses. We invite you to explore the analysis and contact us to discuss how we can help your business capitalise on the new - but challenging - opportunities for growth. Learn more http://pwc.to/1DaolqY
Website: http://www.pwc.com/gx/en/ceo-survey/2015/industry/technology.jhtml
Joining Forces: Interagency Collaboration and "Smart Power"Booz Allen Hamilton
Has U.S. defense, diplomacy and development adopted a “smart power” approach? In this follow-up to a 2010 report, the Government Business Council (GBC) evaluates progress towards increased interagency collaboration and how budget pressures may change foreign policy. Moderator is GBC's Associate Director of Research Erin Dian Dumbacher and Speakers include Booz Allen senior associate's Cheryl Steele and Jonathan Allen. Download the full report here: http://www.govexec.com/gbc/report/smart_power_2011/
Learn more about Smart Power: http://www.boozallen.com/smartpower
Since last year ended on such a strong note, many of us were optimistic about the prospects for Q1. Though not as strong as the fourth quarter of 2014, the first quarter of 2015 kicked off on a positive note, with 23 technology companies raising US$6.1billion* in proceeds from their IPOs. That’s the second highest first quarter proceeds in the past five years and impressive given the increased US market volatility and consistent with the high pre-IPO valuations we’ve seen recently. Granted, if you look at the year over year comparison, offerings were down 12% and proceeds declined 11%. And sequentially, the number of technology IPOs declined 32% while proceeds fell by 19%. Still, it’s a promising start for 2015. Learn more at www.pwc.com/globaltechipo
*Deal size greater than US$40 million
The FDA and industry: A recipe for collaborating in the New Health EconomyPwC
Pharmaceutical and life science companies and their chief regulator – the FDA – must find new ways to collaborate to meet 21st century demands.
Web Page: http://www.pwc.com/us/en/health-industries/health-research-institute/hri-pharma-life-sciences-fda.jhtml
Apache Hadoop Summit 2016: The Future of Apache Hadoop an Enterprise Architec...PwC
Hadoop Summit is an industry-leading Hadoop community event for business leaders and technology experts (such as architects, data scientists and Hadoop developers) to learn about the technologies and business drivers transforming data. PwC is helping organizations unlock their data possibilities to make data-driven decisions.
A.T. Kearney 2017 State of Logistics Report: Accelerating into UncertaintyKearney
2017 could be a pivotal year for logistics. Demand patterns are shifting, technological advances are altering industry economics, and new competitors are challenging old business models. This year could bring significant moves that reshape individual sectors and even the industry as a whole. Major business combinations, large-scale shifts in distribution flows, deep capacity cuts, massive infrastructure investments–anything is possible. Here are the ten key takeaways from the 2017 State of Logistics report, as well as the four potential scenarios for the future of logistics.
EY Price Point: global oil and gas market outlook, Q2 | April 2022EY
The theme for this quarter is rearrangement. The loss, or potential loss, of Russian oil and gas supplies is forcing producers, refiners and traders to rethink the flow of crude oil and refined products from the wellhead to the gas pump in light of sanctions, potential sanctions and the risk of reputational damage. Countries, companies and consumers will all be searching for ways to adapt, and the outcome of the race to bring alternatives to market could alter the global energy landscape for years to come.
It is likely crude oil and LNG prices will remain elevated for some time. The process of diverting Russian oil through countries unwilling to sanction it will take time and there is little indication OPEC members are willing (or able) to increase production to make up for the loss of Russian crude. Spare capacity sat at 3.7 mbpd at the end of 2021, just above where it was in January 2020. Currently, sanctioned Venezuelan and Iranian production (about 3 mbpd below their peak) could fill the gap, but political and commercial obstacles remain. At today’s prices, US shale production is attractive, but the fastest the industry has been able to grow is between 1mbpd and 2mbpd per year. The LNG infrastructure was already stretched before the war in Ukraine and there is little prosect of finding new supplies soon.
As the largest buyer of Russian energy, Europe will be the epicenter. There is a deeply embedded bias there in favor for renewable energy, and the current crisis is certain to result in an all-out effort to accelerate the build-out of wind and solar power. The capacity to add new green energy is limited though by the project pipeline and supply chains for solar panels and wind turbines, and it is likely that much of the shortfall will be made up with the new LNG infrastructure.
MAPS2018 Keynote address on EY report: Life Sciences 4.0 – Securing value thr...EY
Summary: This keynote address presented by Pamela Spence, EY Global Life Sciences Leader (pspence2@uk.ey.com) at MAPS 2018 – the annual meeting for Medical Affairs Professional Society – discusses our latest life sciences report and the industry demands for a customer-focused, data driven approach to health care. We describe the accelerating pace of change as technological advances and the escalating expectations of payers, physicians and patient consumers are combining to disrupt the life sciences business model. Data and algorithms that maximize health outcomes based on individual needs and preferences are becoming the ultimate health care consumable. To create value now and in a future that we call Life Sciences 4.0, life sciences companies must build – or participate in – interoperable information systems that collect, combine and share data. For more on our report, Progressions 2018 – Life Sciences 4.0, please go to www.ey.com/progressions
Intelligent Operations for Future-Ready Businesses | Accentureaccenture
Accenture reveals that the relationship between intelligent operations and business value creation is key to becoming a future-ready organization. Read More.
Digital and Innovation Strategies for the Infrastructure Industry: Tim McManu...Smart City
Productivity in the engineering and construction industry has been stagnant for decades. The proliferation of digital solutions has made it difficult for users to develop a coherent strategy. Companies who are able to successfully navigate the new digital landscape are on the brink of a transformation that will see top performers reduce overall project costs by 20-45%. However, digital transformations require developing digital capability across all aspects of the organization. Therefore, each entity involved in the industry must understand its critical challenges in order to guide its path to increased digital capability.
Although a majority of executives say sustainability is necessary to be competitive, most companies still aren't profiting from their sustainability efforts. BCG and MIT Sloan Management Review present the results of their 2013 sustainability survey, including a look at companies that "walk the talk" when it comes to sustainability issues.
Five years after the worst economic crisis of our lifetimes, we are still feeling the after-shocks around the world.
Our recent financial past seems to herald one certainty for our collective
financial future: The investment world we grew up with has changed utterly.
Conventional wisdoms shaped by decades of high-return investing — first in equities from 1982 to 2000, then in fixed income markets over most of this century — need to be reexamined, revised, or even scrapped.
Pacific Asset Management is sub-advisor to the AdvisorShares Pacific Asset Enhanced Floating Rate ETF (FLRT)*
2014 has seen the consensus of higher Treasury yields and economic activity fail to materialize. Lower rates and risk premiums have led to strong returns year-to-date. In this commentary, Portfolio Managers David Weismiller, Michael Marzouk, and Bob Boyd discuss the current market environment, outlook, and portfolio positioning.
*Effective but not available for sale at this time. Go to www.advisorshares.com for more information.
By Principal
Global outlook: Slowing growth but a world in better health. We expect the global economy to grow at a slower pace in 2022 as fiscal and monetary tailwinds fade. Inflation, supply chains, and central banking policies will be key for investors in an environment where pandemic-induced changes and disruptions continue to reverberate.
Inflation: Persistent or transient? We believe inflation is likely to remain elevated in 2022 and recommend investors be open-minded on the impact to their portfolio construction and rebalancing needs. Once supply chain bottlenecks and labor pressures ease, we expect inflation to moderate.
Monetary policy will be in the crosshairs. Central banks have indicated that the clock is ticking down on extraordinary monetary policies in response to COVID-19. Given the uncertainty around inflation, policy shifts
will be challenging to execute and there will be significant pressure on central banks to get policy “just right”.
Change induced by the pandemic is creating investment opportunities.
Our investment strategy identifies key themes and strategic drivers that have been strengthened by the pandemic. Niche, or non-traditional sectors, that remained particularly resilient are one of the most significant
investment opportunities emerging from the pandemic.
Office demand has weakened and may rebalance the sector. Lower-quality or poorly located offices in urban markets are clearly disrupted and need to be treated with caution. Investors need to enhance their
opportunity set to markets that offer a compelling mix of lifestyle, talent, and demographics while focusing on high-quality assets that are positioned to meet the evolving environmental, social, and governance (ESG) needs of tenants.
Etude PwC 2013 sur les fusions-acquisitions dans le secteur des assurancesPwC France
http://pwc.to/16IfpG5
Ce nouveau rapport de PwC met en évidence la reprise des fusions-acquisitions dans le secteur de l’assurance, dont l’importance stratégique commence à augmenter à travers le monde.
Expert Stock Market Forecasts: What Investors Can Expect in 2024ABBO News
The stock market can be both a beacon of opportunity and a source of anxiety for investors. The S&P 500, for instance, generated an impressive total return of 26.29% in 2023, following a setback of 18.11% in 2022. Predicting the stock market forecast for 2024 is a challenging endeavor due to numerous complex factors. However, examining economic conditions, market trends, and expert forecasts can provide valuable insights into potential trajectories. Understanding projections and preparing for volatility are crucial for both beginners and seasoned investors to navigate 2024 successfully. https://abbonews.com/us-markets/stock-market-forecasts-predictions-and-crashes-a-beginner-to-expert-guide/
DSS Inc. (NYSE American: DSS) is a multinational company operating business segments in blockchain security, direct marketing, healthcare, consumer packaging, real estate, renewable energy, and securitized digital assets. Its business model is based on a distribution sharing system in which shareholders will receive shares in its subsidiaries as DSS strategically spins them out into IPOs. DSS is led by its seasoned leaders with decades of industry experience.
The Future According to Crypto Currency Expertsmindsrelax
What Is Cryptocurrency?
A cryptocurrency is a digital or virtual currency that is secured by cryptography, which makes it nearly impossible to counterfeit or double-spend. Many cryptocurrencies are decentralized networks based on blockchain technology—a distributed ledger enforced by a disparate network of computers. A defining feature of cryptocurrencies is that they are generally not issued by any central authority, rendering them theoretically immune to government interference or manipulation.
when will pi network coin be available on crypto exchange.DOT TECH
There is no set date for when Pi coins will enter the market.
However, the developers are working hard to get them released as soon as possible.
Once they are available, users will be able to exchange other cryptocurrencies for Pi coins on designated exchanges.
But for now the only way to sell your pi coins is through verified pi vendor.
Here is the telegram contact of my personal pi vendor
@Pi_vendor_247
The secret way to sell pi coins effortlessly.DOT TECH
Well as we all know pi isn't launched yet. But you can still sell your pi coins effortlessly because some whales in China are interested in holding massive pi coins. And they are willing to pay good money for it. If you are interested in selling I will leave a contact for you. Just telegram this number below. I sold about 3000 pi coins to him and he paid me immediately.
Telegram: @Pi_vendor_247
USDA Loans in California: A Comprehensive Overview.pptxmarketing367770
USDA Loans in California: A Comprehensive Overview
If you're dreaming of owning a home in California's rural or suburban areas, a USDA loan might be the perfect solution. The U.S. Department of Agriculture (USDA) offers these loans to help low-to-moderate-income individuals and families achieve homeownership.
Key Features of USDA Loans:
Zero Down Payment: USDA loans require no down payment, making homeownership more accessible.
Competitive Interest Rates: These loans often come with lower interest rates compared to conventional loans.
Flexible Credit Requirements: USDA loans have more lenient credit score requirements, helping those with less-than-perfect credit.
Guaranteed Loan Program: The USDA guarantees a portion of the loan, reducing risk for lenders and expanding borrowing options.
Eligibility Criteria:
Location: The property must be located in a USDA-designated rural or suburban area. Many areas in California qualify.
Income Limits: Applicants must meet income guidelines, which vary by region and household size.
Primary Residence: The home must be used as the borrower's primary residence.
Application Process:
Find a USDA-Approved Lender: Not all lenders offer USDA loans, so it's essential to choose one approved by the USDA.
Pre-Qualification: Determine your eligibility and the amount you can borrow.
Property Search: Look for properties in eligible rural or suburban areas.
Loan Application: Submit your application, including financial and personal information.
Processing and Approval: The lender and USDA will review your application. If approved, you can proceed to closing.
USDA loans are an excellent option for those looking to buy a home in California's rural and suburban areas. With no down payment and flexible requirements, these loans make homeownership more attainable for many families. Explore your eligibility today and take the first step toward owning your dream home.
The Evolution of Non-Banking Financial Companies (NBFCs) in India: Challenges...beulahfernandes8
Role in Financial System
NBFCs are critical in bridging the financial inclusion gap.
They provide specialized financial services that cater to segments often neglected by traditional banks.
Economic Impact
NBFCs contribute significantly to India's GDP.
They support sectors like micro, small, and medium enterprises (MSMEs), housing finance, and personal loans.
how to sell pi coins effectively (from 50 - 100k pi)DOT TECH
Anywhere in the world, including Africa, America, and Europe, you can sell Pi Network Coins online and receive cash through online payment options.
Pi has not yet been launched on any exchange because we are currently using the confined Mainnet. The planned launch date for Pi is June 28, 2026.
Reselling to investors who want to hold until the mainnet launch in 2026 is currently the sole way to sell.
Consequently, right now. All you need to do is select the right pi network provider.
Who is a pi merchant?
An individual who buys coins from miners on the pi network and resells them to investors hoping to hang onto them until the mainnet is launched is known as a pi merchant.
debuts.
I'll provide you the Telegram username
@Pi_vendor_247
Currently pi network is not tradable on binance or any other exchange because we are still in the enclosed mainnet.
Right now the only way to sell pi coins is by trading with a verified merchant.
What is a pi merchant?
A pi merchant is someone verified by pi network team and allowed to barter pi coins for goods and services.
Since pi network is not doing any pre-sale The only way exchanges like binance/huobi or crypto whales can get pi is by buying from miners. And a merchant stands in between the exchanges and the miners.
I will leave the telegram contact of my personal pi merchant. I and my friends has traded more than 6000pi coins successfully
Tele-gram
@Pi_vendor_247
how can I sell pi coins after successfully completing KYCDOT TECH
Pi coins is not launched yet in any exchange 💱 this means it's not swappable, the current pi displaying on coin market cap is the iou version of pi. And you can learn all about that on my previous post.
RIGHT NOW THE ONLY WAY you can sell pi coins is through verified pi merchants. A pi merchant is someone who buys pi coins and resell them to exchanges and crypto whales. Looking forward to hold massive quantities of pi coins before the mainnet launch.
This is because pi network is not doing any pre-sale or ico offerings, the only way to get my coins is from buying from miners. So a merchant facilitates the transactions between the miners and these exchanges holding pi.
I and my friends has sold more than 6000 pi coins successfully with this method. I will be happy to share the contact of my personal pi merchant. The one i trade with, if you have your own merchant you can trade with them. For those who are new.
Message: @Pi_vendor_247 on telegram.
I wouldn't advise you selling all percentage of the pi coins. Leave at least a before so its a win win during open mainnet. Have a nice day pioneers ♥️
#kyc #mainnet #picoins #pi #sellpi #piwallet
#pinetwork
What website can I sell pi coins securely.DOT TECH
Currently there are no website or exchange that allow buying or selling of pi coins..
But you can still easily sell pi coins, by reselling it to exchanges/crypto whales interested in holding thousands of pi coins before the mainnet launch.
Who is a pi merchant?
A pi merchant is someone who buys pi coins from miners and resell to these crypto whales and holders of pi..
This is because pi network is not doing any pre-sale. The only way exchanges can get pi is by buying from miners and pi merchants stands in between the miners and the exchanges.
How can I sell my pi coins?
Selling pi coins is really easy, but first you need to migrate to mainnet wallet before you can do that. I will leave the telegram contact of my personal pi merchant to trade with.
Tele-gram.
@Pi_vendor_247
what is the best method to sell pi coins in 2024DOT TECH
The best way to sell your pi coins safely is trading with an exchange..but since pi is not launched in any exchange, and second option is through a VERIFIED pi merchant.
Who is a pi merchant?
A pi merchant is someone who buys pi coins from miners and pioneers and resell them to Investors looking forward to hold massive amounts before mainnet launch in 2026.
I will leave the telegram contact of my personal pi merchant to trade pi coins with.
@Pi_vendor_247
Even tho Pi network is not listed on any exchange yet.
Buying/Selling or investing in pi network coins is highly possible through the help of vendors. You can buy from vendors[ buy directly from the pi network miners and resell it]. I will leave the telegram contact of my personal vendor.
@Pi_vendor_247
What price will pi network be listed on exchangesDOT TECH
The rate at which pi will be listed is practically unknown. But due to speculations surrounding it the predicted rate is tends to be from 30$ — 50$.
So if you are interested in selling your pi network coins at a high rate tho. Or you can't wait till the mainnet launch in 2026. You can easily trade your pi coins with a merchant.
A merchant is someone who buys pi coins from miners and resell them to Investors looking forward to hold massive quantities till mainnet launch.
I will leave the telegram contact of my personal pi vendor to trade with.
@Pi_vendor_247
1. BlackRock
Investment
Institute
FOR PUBLIC DISTRIBUTION IN THE U.S., CANADA, LATIN AMERICA, HONG KONG, SINGAPORE AND AUSTRALIA.
FOR INSTITUTIONAL, PROFESSIONAL, QUALIFIED INVESTORS AND QUALIFIED CLIENTS IN OTHER PERMITTED COUNTRIES.
A new investment playbook
2023 Global
outlook
BIIM1122U/M-2612147-1/16
2. 2
2 2022 midyear outlook
Contents
2 2023 outlook
The Great Moderation, the four-decade period of largely stable activity
and inflation, is behind us. The new regime of greater macro and market
volatility is playing out. A recession is foretold; central banks are on
course to overtighten policy as they seek to tame inflation. This keeps us
tactically underweight developed market (DM) equities. We expect to
turn more positive on risk assets at some point in 2023 – but we are not
there yet. And when we get there, we don’t see the sustained bull markets
of the past. That’s why a new investment playbook is needed.
Philipp Hildebrand
Vice Chairman —
BlackRock
First words
Summary
New regime plays
out
New playbook
Themes
Pricing the damage
Rethinkingbonds
Living with inflation
2-3
2
3
4
5-7
5
6
7
Jean Boivin
Head — BlackRock
Investment Institute
Alex Brazier
Deputy Head — BlackRock Investment
Institute
Vivek Paul
Head of Portfolio Research —
BlackRock Investment Institute
Investment views
Tactical
Strategic
Regime drivers
Aging workforces
A new world order
Faster transition
Private markets
View summary
8-9
8
9
10-12
10
11
12
13
14-15
We laid out in our 2022 midyear outlook
why we had entereda new regime – and are
seeing it play out in persistent inflation and
output volatility, central banks pushing
policy rates up to levels that damage
economic activity, rising bond yields and
ongoing pressure on risk assets.
Centralbankers won’t ride to the rescue
when growth slows in this new regime,
contrary to what investors have come to
expect. They are deliberately causing
recessions by overtightening policy to try to
rein in inflation. That makes recession
foretold. We see central banks eventually
backing off from rate hikes as the economic
damage becomes reality. We expect
inflation to cool but stay persistently higher
than centralbank targets of 2%.
What mattersmost, we think, is how much
of the economic damage is already reflected
in market pricing. This is why pricing the
damage is our first 2023 investment theme.
Case in point: Equity valuations don’t yet
reflect the damage ahead, in our view. We
will turn positive on equities when we think
the damage is priced or our view of market
risk sentiment changes. Yet we won’t see
this as a prelude to anotherdecade-long
bull market in stocks and bonds.
This new regime calls for rethinking bonds,
our second theme. Higher yields are a gift to
investors who have long been starved for
income. And investors don’t have to go far up
the risk spectrum to receive it. We like short-
term governmentbonds and mortgage
securities for that reason. We favor high-
grade credit as we see it compensating for
recession risks. On the other hand, we think
long-term government bonds won’t play their
traditional role as portfolio diversifiers due to
persistent inflation. And we see investors
demanding higher compensation for holding
them as centralbanks tighten monetary
policy at a time of record debt levels.
Our third theme is living with inflation. We
see long-term drivers of the new regime such
as aging workforces keeping inflation above
pre-pandemic levels. We stay overweight
inflation-linked bonds on both a tactical and
strategic horizon as a result.
Our bottom line: The new regime requires a
new investment playbook. It involves more
frequent portfolio changesby balancing
views on risk appetite with estimates of how
markets are pricing in economic damage. It
also calls for taking more granular views by
focusing on sectors, regions and sub-asset
classes, rather than on broad exposures.
FOR PUBLIC DISTRIBUTION IN THE U.S., CANADA, LATIN AMERICA, HONG KONG, SINGAPORE AND AUSTRALIA.
FOR INSTITUTIONAL, PROFESSIONAL, QUALIFIED INVESTORS AND QUALIFIED CLIENTS IN OTHER PERMITTED COUNTRIES.
Scott Thiel
Chief Fixed Income Strategist —
BlackRock Investment Institute
Wei Li
Global Chief Investment Strategist —
BlackRock Investment Institute
BIIM1122U/M-2612147-2/16
3. 3
3 2022 midyear outlook
3 2023 outlook
FOR PUBLIC DISTRIBUTION IN THE U.S., CANADA, LATIN AMERICA, HONG KONG, SINGAPORE AND AUSTRALIA.
FOR INSTITUTIONAL, PROFESSIONAL, QUALIFIED INVESTORS AND QUALIFIED CLIENTS IN OTHER PERMITTED COUNTRIES.
New regime
playing out
A key feature of the new regime, we
believe, is that we are in a world
shaped by supply that involves
brutal trade-offs. This regime is
playing out and not going away, in
our view.
Repeatedinflation surprises have
sent bond yields soaring, crushing
equities and fixed income. Such
volatility stands in sharp contrast
to the Great Moderation, 40 years
of steady growth and inflation.
Production constraints are driving
this new regime: The pandemic
shift in consumer spending from
services to goods caused shortages
and bottlenecks.Aging populations
led to worker shortages. This
means DMs can’t produce as much
as before without creatinginflation
pressure. That’s why inflation is so
high now, even though activity is
below its pre-Covid trend.
Centralbank policy rates are not
the tool to resolve production
constraints; they can only influence
demand in their economies. That
leaves them with a brutal trade-off.
Either get inflation back to 2%
targets by crushing demand down to
what the economy can comfortably
produce now (dotted green line in
the chart), or live with more inflation.
For now, they’re all in on the first
option. So recession is foretold.
Signs of a slowdown are emerging.
But as the damage becomes real, we
believe they’ll stop their hikes even
though inflation won’t be on track to
get all the way down to 2%.
Some production constraintscould
ease as spending normalizes. But we
see three long-term trends keeping
production capacity constrainedand
cementing the new regime. First,
aging populations mean continued
worker shortagesin many major
economies. Second, persistent
geopolitical tensions are rewiring
globalization and supply chains.
Third, the transition to net-zero
carbon emissions is causing energy
supply and demand mismatches.
See pages 11-13.
Our bottom line: What worked in the
past won’t work now.
Production constraints are fueling
inflation and macro volatility. Central
banks cannot solve these constraints.
That leaves them raising rates and
engineering recessions to fight inflation.
Intro U.S. GDP and potential supply, 2017-2025
Sources: BlackRock Investment Institute and U.S. Bureau of Economic Analysis, with data from Haver
Analytics, November 2022.Notes: The chart shows demand in the economy, measured by real GDP (in
orange) and our estimateof pre-Covid trend growth (in yellow).The green dottedline shows our estimate of
current production capacity, derived by how much core PCE inflation has exceededthe Federal Reserve’s 2%
inflation target. When then gauge how far activity (orange line) would have to fall to close the gap with where
production capacity (green dotted line),will be by the end of 2023 assuming somerecovery in production
capacity. We estimatea 2% drop in GDP between Q3 2022 and Q3 2023 (orange dottedline). Forward-
lookingestimatesmay not come to pass.
Taming inflation would take deep recession
Chart takeaway: Getting inflation all the way back down to target –
the dotted green line – would require the Fed to deal a significant
blow to the economy.
90
95
100
105
110
2017 2019 2021 2023 2025
Index
Trend GDP Estimate of non-inflationary GDP level
Large drop in GDP
needed to close gap
between demand and
supply in 2023
2% fall
BIIM1122U/M-2612147-3/16
4. 4
4 2022 midyear outlook
4
Our new playbook
Tactical views
FOR PUBLIC DISTRIBUTION IN THE U.S., CANADA, LATIN AMERICA, HONG KONG, SINGAPORE AND AUSTRALIA.
FOR INSTITUTIONAL, PROFESSIONAL, QUALIFIED INVESTORS AND QUALIFIED CLIENTS IN OTHER PERMITTED COUNTRIES.
Navigating markets in 2023 will
require more frequent portfolio
changes. We see two assessments
that determine tactical portfolio
outcomes: 1) our assessment of
market risk sentiment, and 2) our
view of the economic damage
reflected in market pricing.
The matrix shows how we plan to
change our views and turn more
positive as markets play out in the
new regime. A few key conclusions:
• We are already at our most
defensive stance. Otheroptions
are about turning more positive,
especially on equities.
• We are underweightnominal
long-term government bonds in
each scenario in this new regime.
This is our strongest conviction in
any scenario.
• We can turn positive in different
ways: either via our assessment of
market risk sentiment or our view
on how much damage is in the
price.
Pastperformanceis nota reliableindicatorofcurrentorfutureresults.It is notpossibletoinvestdirectlyinanindex. Sources: Blackrock Investment Institute, November 2022.Notes: The boxes in this
stylizedmatrix show how our tactical views on broad asset classes would switch if we were to change our assessment of market risk sentiment or assessment of how much economic damage is priced in.
The potential view changes are from a U.S. dollar perspective. This material represents an assessment of the market environment at a specifictime and is not intended to be a forecast or guarantee of
future results. This information should not be reliedupon as investment advice regarding any particular fund, strategy or security.
Enough damage in the price?
No Yes
Market
risk
sentiment
Off
Risk off, damage not priced Risk off, damage priced
Equities Equities
Credit Credit
Govt.
bonds
Short term
Govt.
bonds
Short term
Long term Long term
On
Risk on, damage not priced Risk on, damage priced
Equities Equities
Credit Credit
Govt.
bonds
Short term
Govt.
bonds
Short term
Long term Long term
We are here
2023 outlook
Underweight Overweight
Tacticalview
BIIM1122U/M-2612147-4/16
5. 5
5 2022 midyear outlook
5 2023 outlook
FOR PUBLIC DISTRIBUTION IN THE U.S., CANADA, LATIN AMERICA, HONG KONG, SINGAPORE AND AUSTRALIA.
FOR INSTITUTIONAL, PROFESSIONAL, QUALIFIED INVESTORS AND QUALIFIED CLIENTS IN OTHER PERMITTED COUNTRIES.
Theme 1
Damage already clear
Pricing the
damage
Recession is foretold as central
banks race to try to tame inflation.
It’s the opposite of past recessions:
Loose policy is not on the way to
help support risk assets, in our
view. That’swhy the old playbook of
simply “buying the dip” doesn’t
apply in this regime of sharper
trade-offs and greatermacro
volatility. The new playbook calls
for a continuousreassessment of
how much of the economic
damage being generatedby central
banks is in the price.
That damage is building. In the
U.S., it’s most evident in rate-
sensitive sectors. Surging
mortgage rates have crateredsales
of new homes. See the chart. We
also see other warning signs, such
as deteriorating CEO confidence,
delayed capital spending plans and
consumers depleting savings. In
Europe, the hit to incomes from the
energy shock is amplified by
tightening financial conditions.
The ultimate economic damage
depends on how far central banks
go to get inflation down.
Our approach to tactical investment
views is driven by our view of market
participants’ risk appetite – which is
based on the uncertainty of the
macro environmentand other inputs
– and by our assessment of what
damage is in the price, especially
equity earnings expectationsand
valuations.
We expect them to stop hiking and
activity to stabilize in 2023. We find
that earnings expectationsdon’t yet
price in even a mild recession. For
that reason, we stay underweight
DM equities on a tactical horizon for
now.
Yet we stand ready to turn more
positive as valuations get closer to
reflecting the economic damage – as
opposed to risk assets just
responding to hopes of a soft
landing. It’s not just about pricing
the damage: We could see markets
look through the damage and
market risk sentiment improve in a
way that would prod us to dial up our
risk appetite. But we are not there
yet.
We don’t think equities are fully priced
for recession. But we stand ready to turn
positive via our assessment of the
market’s risk sentiment or how much
economic damage is in the price.
Source: BlackRock Investment Institute and U.S. Census Bureau, with data from RefinitivDatastream,
November 2022.Notes: The chart shows how quickly in months sales of new family houses changed during
policy rate tightening cycles between1972 and 2022.The colored, labeledlines highlight 2022and the
years when housing sales fell most quickly.
U.S. new home sales during policy rate tightening cycles, 1972-2022
Chart takeaway: The slide in housing sales this year is already
steeper than past mega Fed hiking cycles, such as in the 1970s and
early 1980s – as well as the unwind of the mid-2000s U.S. housing
boom.
-75%
-50%
-25%
0%
25%
0 12 24 36 48
Change
in
new
home
sales
Months
2022
1980
1972
1977
2004
BIIM1122U/M-2612147-5/16
6. 6
6 2022 midyear outlook
6
FOR PUBLIC DISTRIBUTION IN THE U.S., CANADA, LATIN AMERICA, HONG KONG, SINGAPORE AND AUSTRALIA.
FOR INSTITUTIONAL, PROFESSIONAL, QUALIFIED INVESTORS AND QUALIFIED CLIENTS IN OTHER PERMITTED COUNTRIES.
Theme 2
The negative correlation between
stock and bond returns has already
flipped, as the chart shows, meaning
they can both go down at the same
time. Why? Central banks are
unlikely to come to the rescue with
rapid rate cuts in recessions they
engineeredto bring down inflation
to policy targets. If anything, policy
rates may stay higher for longer than
the market is expecting.
Investors also will increasingly ask
for more compensation to hold long-
term governmentbonds – or term
premium – amid high debt levels,
rising supply and higher inflation.
Centralbanks are shrinking their
bond holdings and Japan may stop
purchases, while governmentsare
still running deficits. That means the
private sector needs to absorb more
bonds. And so-called bond vigilantes
are back, as seen when market
forces sparked a yield surge to
punish profligate UK policies.
As a result, we remain underweight
long-term government bonds in
tactical and strategic portfolios.
Bonds and stocks can go down at same time
Sources: BlackRock Investment Institute, with data from RefinitivDatastream, November 2022.Notes: The chart
shows the correlation of daily U.S. 10-year Treasury and S&P 500 returns over a rolling one-year period.
The lure of fixed income is strong as
surging yields mean bonds finally offer
income. Yet long-dated bonds face
challenges, we believe, making us prefer
short-term bonds and high-grade credit.
Correlation of U.S. equity and governmentbond returns
Chart takeaway: A cornerstoneof portfolio construction in recent
decades was that bond prices would go up when stocks sold off. We
think this correlation has broken down in the new regime.
Rethinking
bonds
Fixed income finally offers
“income” after yields surged
globally. This has boosted the
allure of bonds after investors were
starved for yield for years. We take
a granular investment approach to
capitalize on this, rather than
taking broad, aggregate exposures.
The case for investment-grade
credit has brightened, in our view,
and we raise our overweight
tactically and strategically. We
think it can hold up in a recession,
with companies having fortified
their balance sheets by refinancing
debt at lower yields. Agency
mortgage-backedsecurities – a
new tactical overweight – can also
play a diversified income role.
Short-termgovernment debt also
looks attractive at current yields,
and we now break out this category
into a separate tactical view.
In the old playbook, long-term
governmentbonds would be part of
the package as they historically
have shielded portfolios from
recession. Not this time, we think.
-75%
-50%
-25%
0%
25%
50%
75%
1960 1970 1980 1990 2000 2010 2020
Correlation
2023 outlook
BIIM1122U/M-2612147-6/16
7. 7
7 2022 midyear outlook
7 2023 outlook
FOR PUBLIC DISTRIBUTION IN THE U.S., CANADA, LATIN AMERICA, HONG KONG, SINGAPORE AND AUSTRALIA.
FOR INSTITUTIONAL, PROFESSIONAL, QUALIFIED INVESTORS AND QUALIFIED CLIENTS IN OTHER PERMITTED COUNTRIES.
Theme 3
Persistent inflation
Living with
inflation
High inflation has sparked cost-of-
living crises, putting pressure on
central banks to tame inflation –
whateverit takes. Yet there has
been little debate about the
damage to growth and jobs.
We think the “politics of inflation”
narrative is on the cusp of
changing. The cycle of outsized
rate hikes will stop without inflation
being back on track to return fully
to 2% targets, in our view. As the
damage becomes clear, the
“politics of recession” will take over.
Plus, central banks may be forced
to stop tightening to prevent
financial cracks from becoming
floodgates, as seen in the UK when
investors took fright of fiscal
stimulus plans. Result? Even with a
recession coming, we think we are
going to be living with inflation.
We do see inflation cooling as
spending patterns normalize and
energy prices relent – but we see it
persisting above policy targetsin
coming years. More volatile and
persistent inflation is not yet priced
in by markets, we think.
We stay overweight inflation-linked
bonds and like real assets. The old
playbook principle that recession
drives below-targetinflation and
looser monetary policy is gone.
Beyond Covid-relatedsupply
disruptions, we see three long-term
constraints keeping the new regime
in place and inflation above pre-
pandemic levels: aging populations,
geopolitical fragmentationand the
transition to a lower-carbon world.
Our strategic views have reflectedthe
new regime, with an overweight to
inflation-protectedbonds for a few
years now. Market expectationsand
economist forecasts have only
recently started to appreciatethat
inflation will be more persistent. See
the gray lines in the chart. We think
the old playbook means markets
underappreciateinflation. See the
yellow dot. The market’s wishful
thinking on inflation is why we have a
high conviction, maximum
overweight to inflation-linked bonds
in strategic portfolios and maintain a
tactical overweight no matter how the
new regime plays out.
We see central banks pausing rate hike
campaigns once the damage becomes
clearer. Long-term drivers of the new
regime will keep inflation persistently
higher, in our view.
U.S. core CPI inflation, forecasts and breakevenrates, 2020-2025
Sources: BlackRock Investment Institute, with data from Refinitiv Datastream, November 2022.Note: The
gray lines show consensus economist projections of CPI inflationpolledby Reuters. The yellowdot shows
current market impliedfive-year-aheadinflation expectations.Forward lookingestimatesmay not come to
pass.
Wishful thinking on inflation
Chart takeaway: Consensus forecasts have kept underestimating
how high inflation would go – and at first overestimatedhow quickly
it would return closer to pre-pandemic levels. We think inflation will
be persistently higher, unlike market pricing.
0
2
4
6
2020 2021 2022 2023 2024 2025
Core
CPI
(%)
Reported U.S. core CPI Economist median forecasts
Current 5-year breakeven
BIIM1122U/M-2612147-7/16
8. 8
8 2022 midyear outlook
8 2023 outlook
A new playbook
FOR PUBLIC DISTRIBUTION IN THE U.S., CANADA, LATIN AMERICA, HONG KONG, SINGAPORE AND AUSTRALIA.
FOR INSTITUTIONAL, PROFESSIONAL, QUALIFIED INVESTORS AND QUALIFIED CLIENTS IN OTHER PERMITTED COUNTRIES.
Tactical views
Carrie King
Global Deputy Chief
Investment Officer,
Blackrock Fundamental
Equities
A bottom-up look at what our
companies are telling us is
probably the best lens we have
into the future.”
Our 2023 playbook is ready to
quickly adjust depending on how
markets price economic damage
and our risk stance evolves.
We prefer short-term government
bonds for income: The jump in
yields reduces the need to take risk
by seeking yield furtherout the
curve. U.S. two-year Treasury yields
have soared above 10-year yields.
See the chart. We break out short-
term Treasuriesas a neutral.
We add to our overweight to
investment grade credit. Higher
yields and strong balance sheets
suggest to us investment grade
credit may be betterplaced than
equities to weatherrecessions.
We like U.S. agency mortgage-
backed securities (MBS) for their
higher income and because they
offer some credit protection via the
governmentownership of their
issuers. And our expectation for
persistent inflation relative to
market pricing keeps us overweight
inflation-linked bonds.
Long-term governmentbonds
remain challenged as we have
described, so we stay underweight.
In equities, we believe recession isn’t
fully reflectedin corporate earnings
expectationsor valuations – and we
disagree with market assumptions
that central banks will eventually
turn supportive with rate cuts. We
look to lean into sectoral
opportunities from structural
transitions – such as healthcare
amid aging populations – as a way
to add granularity even as we stay
overall underweight. Among
cyclicals, we prefer energy and
financials. We see energy sector
earnings easing from historically
elevatedlevels yet holding up amid
tight energy supply. Higher interest
rates bode well for bank profitability.
We like healthcaregiven appealing
valuations and likely cashflow
resilience during downturns.
Short over long
Pastperformanceisnota reliableindicatorofcurrentorfutureresults. Source:BlackRock
InvestmentInstitute,withdata from RefinitivDatastream,November2022. Notes:The chart
showsU.S. 10-yearandtwo-yearTreasuryyields.
We expect views to change more
frequently than in the past. Our stance
heading into 2023 is broadly risk-off,
with a preference for income over
equities and long-term bonds.
Chart takeaway: We see long-term yields rising furtheras term
premium returns. Yet we expect less room for short-termyields to
climb given the limited scope we see for a furtherjump in expected
policy rates.
U.S. Treasury yields, 2000-2022
0%
1%
2%
3%
4%
5%
6%
7%
2000 2005 2010 2015 2020
Yield
10-year Two-year
BIIM1122U/M-2612147-8/16
9. 9
9 2022 midyear outlook
9 2023 outlook
FOR PUBLIC DISTRIBUTION IN THE U.S., CANADA, LATIN AMERICA, HONG KONG, SINGAPORE AND AUSTRALIA.
FOR INSTITUTIONAL, PROFESSIONAL, QUALIFIED INVESTORS AND QUALIFIED CLIENTS IN OTHER PERMITTED COUNTRIES.
Strategic views
A new strategic
approach
The Great Moderation allowed for
relatively stable strategic
portfolios. That won’t work in the
new regime: We think they will need
to be more nimble.
We don’t see a return to conditions
that will sustain a joint bull market
in stocks and bonds of the kind we
experiencedin the prior decade.
The asset mix has always been
important, yet our analysis posits
that getting the mix wrong could be
as much as four times as costly as
versus the Great Moderation. See
the difference betweenthe orange
bar and yellow markers on the
chart. Zero or even positive
correlation betweenthe returns of
stocks and bonds means it will take
higher portfolio volatility to achieve
similar levels of return as before.
We see private markets as a core
holding for institutional investors.
The asset class isn’t immune to
macro volatility and we are broadly
underweightas we think valuations
could fall, suggesting better
opportunities in coming years than
now. See more on page 13.
Our strategic views stay modestly
overweight DM equities as we
estimate the overall return of stocks
will be greaterthan fixed-income
assets over the coming decade.
Staying invested in stocks is one way
to get more granular with structural
trends impacting sectors.
We stay overweight inflation-linked
bonds and underweightnominal DM
governmentbonds. Within
governmentbonds, we like short
maturities to harvest yield for
income and avoid interest rate risk.
Within fixed income, we prefer to
take risk in credit – and we prefer
public credit to private.
Asset mix matters more in new regime
Forillustrativepurposesonly.Thesedo notrepresent actualportfoliosanddonotconstituteinvestment
advice.Source: BlackRock Investment Institute, with data from RefinitivDatastream and Morningstar,
November 2022.Notes: The chart illustrates the contrast betweenestimatedaverage annual relative
performance of two hypothetical portfolios against a 60-40global equity-global bond portfolioover the
coming decade where we see a regime of higher macro and market volatility(orange) and estimated
performance over the Great Moderationera (1990-2019)ofstable growth and inflation(yellowbars). We
show hypothetical performance of portfolioscomprising a 40%-globalequity-60% global bond split and an
80% global equity-20%global bond mix.Index proxies:MSCI AC Worldfor equities and the Bloomberg
Global Aggregate Index for bonds. An inherent limitationof hypothetical results is that allocationdecisions
reflectedin the performance record were notmade under actual market conditions. They cannot completely
account forthe impact of financial risk in actual portfolio management. Indexes are unmanaged and do not
account forfees.It is not possibleto invest directly in an index.
Our strategic views are positioned for
the new regime. We think even strategic
portfolios need to be more dynamic –
and getting the asset mix wrong can be
even more costly.
Estimated returns in new regime vs. Great Moderation
Chart takeaway: The cost of getting the asset mix wrong is likely
to be much higher in the new regime – as much as four times
versus the Great Moderation – by our estimates.
Simona Paravani-
Mellinghoff
Global CIO of Solutions,
BlackRock Multi-Asset
Strategies & Solutions
It’s undeniable the new regime
requires a new approach to
portfolios. The strategic asset
mix will matter more.”
-1.0%
-0.5%
0.0%
0.5%
1.0%
40/60 equity-bond 80/20 equity-bond
Estimated
return
New regime Great Moderation
BIIM1122U/M-2612147-9/16
10. 10
10 2022 midyear outlook
10 2023 Outlook
FOR PUBLIC DISTRIBUTION IN THE U.S., CANADA, LATIN AMERICA, HONG KONG, SINGAPORE AND AUSTRALIA.
FOR INSTITUTIONAL, PROFESSIONAL, QUALIFIED INVESTORS AND QUALIFIED CLIENTS IN OTHER PERMITTED COUNTRIES.
Regime drivers
Aging workforces
We have laid out three long-term
drivers of production constraintsin
the new regime. The first is aging
populations. The effects are long in
the making but are becoming more
binding now.
Why? Aging populations mean
shrinking workforces. An ever-
increasing share of the U.S.
population is aged 65 or older
when most leave the workforce.
This is one key reason the supply of
U.S. labor is currently struggling to
keep up with demand for labor.
Just like students and stay-at-
home parents, retirees are “outside
the labor force.” That’smainly why
the share of the adult population
that’sinside the labor force –
meaning in work or looking for
work – is still well below where it
was when the pandemic began.
That share is also referred to as the
participation rate. See the orange
line on the chart.
The initial sharp drop was driven by
Covid shutdowns: Many who lost
their job didn’t look for anotherone
right away given healthcare worries
or care-giving responsibilities.
Some of that drop in the workforce
has now unwound. But the yellow
line shows that the part not made up
is almost entirely down to aging –
the increasing share of the
population that is of retirement age
– ratherthan pandemic-specific
effects. That’swhy we don’t expect
an improvement in the participation
rate from here, and so no material
easing of the worker shortage that is
contributing to inflation.
Aging is bad news for future
economic growth, too. The available
workforce will expand much more
slowly in coming years than it has in
the past. Economies won’t be able to
produce as much. And we don’t think
aging populations consume
substantially less either, particularly
when you factor in healthcare
demand. That means continued
inflation pressure, as reduced
production capacity struggles to
keep up with demand. We also see
rising government spending on care
for the elderly adding to debt.
Within equities, we like healthcareas
a sector developing medicine and
equipment to help meet aging
population needs.
A workforce not recovered
Aging populations are negative for
economic growth. Production capacity
will grow less quickly in the future as an
ever-larger share of the population is
past retirement age and not working.
Aging populations are negative for economic growth. Production
capacity will grow less quickly in the future as populations age and
younger generationsfail to replace them.
Sources: BlackRock Investment Institute, U.S. Bureau of Labor Statistics, October 2022.Notes: The orange line
shows the U.S. labor force participation rate, definedas the share of the adult population (aged16 and over)
that is in work oractively lookingforwork. The yellowline shows how much the aging population has
contributed to the decline in the participation rate since 2008. It is calculated by fixing participation rates for
each age group and changing the weights as observedin the population dataover the chart sample period.
Chart takeaway: The labor force participation rate fell dramatically
in the pandemic as the economy shut down. Many people who left
the workforce haven’t come back – and won’t.
-6
-5
-4
-3
-2
-1
0
60
62
64
66
2008 2010 2012 2014 2016 2018 2020 2022
Contribution
of
aging
(percentage
points)
Participation
rate
(%)
Participation rate Contribution of aging (right)
A workforce not recovered
Contribution of aging to U.S. labor force participation rate drop, 2008-2021
BIIM1122U/M-2612147-10/16
11. 11
11 2022 midyear outlook
11 2023 outlook
FOR PUBLIC DISTRIBUTION IN THE U.S., CANADA, LATIN AMERICA, HONG KONG, SINGAPORE AND AUSTRALIA.
FOR INSTITUTIONAL, PROFESSIONAL, QUALIFIED INVESTORS AND QUALIFIED CLIENTS IN OTHER PERMITTED COUNTRIES.
We’re in a new world order of
geopolitical fragmentation, a
full break with the post-Cold
War era.”
A new world order
We’ve enteredinto a new world
order. This is, in our view, the most
fraught global environment since
World War Two – a full break from
the post-Cold War era. We see
geopolitical cooperation and
globalization evolving into a
fragmentedworld with competing
blocs. That comes at the cost of
economic efficiency. Sourcing
more locally may be costlier for
firms, and we could also see fresh
mismatches in supply and demand
as resources are reallocated.
A prime example is the response to
Russia’s invasion of Ukraine.
Western sanctions have triggered a
pursuit of economic self-
sufficiency. Energy security is now
a priority: As Europe weans itself
off Russian oil and gas, we’ve seen
energy shortages and higher
prices. In the U.S., we see a push to
favor trading partners when
sourcing the metals and materials
neededin the net-zero transition.
Strategic competition betweenthe
U.S. and China has intensified. A
tough stance toward China has
bipartisan support in Washington.
The U.S is trying to restrict China’s
access to high-end technology.
China’srecent party congress was a
pivotal event, both politically and
economically, in our view. China
looks set to de-emphasize economic
growth as it pursues self-sufficiency
in energy, food and technology. We
see slower growth compounded by
the effects of an aging population
over time.
Geopolitical fragmentation is likely
to foster a permanent risk premium
across asset classes, rather than
have only a fleeting effect on
markets as in the past. Market
attentionis likely to stay fixated on
geopolitical risks. See the chart.
All this will likely contribute to the
new regime of greatermacro and
market volatility – and persistently
higher inflation.
Geopolitical risk grabs market attention
This is the most fraught geopolitical
environment since WW II, in our view.
The world is splitting up into competing
blocs that pursue self-reliance.
Forward-lookingestimatesmaynot cometo pass. Source: BlackRock Investment Institute. October 2022.The
BlackRock GeopoliticalRisk Indicator (BGRI) tracks the relative frequency of brokerage reports (via Refinitiv) and
financial news stories (DowJones News) associatedwith specific geopoliticalrisks. We adjust for whether the
sentiment in the text of articles is positive or negative, and then assign a score. This score reflects the level of market
attention to each risk versus a five-year history. We use a shorter historical window for our COVID risk due to its
limitedage. We assign a heavier weight to brokerage reports than other media sources since we want to measure the
market's attention to any particular risk, not the public’s.
BlackRock Geopolitical Risk Indicator (BGRI), 2018-2022
Tom Donilon
Chairman, BlackRock
Investment Institute
Regime drivers
Chart takeaway: We have seen a surge in market interest in
geopolitical risk in recent months, highlighting how fraught the
current environmentis.
-1
-0.5
0
0.5
1
1.5
2
2.5
2018 2019 2020 2021 2022
BGRI
Score
WHO declares
COVID-19 a global
pandemic
U.S.
presidential
election
Russia
invasion of
Ukraine
BIIM1122U/M-2612147-11/16
12. 12
12 2022 midyear outlook
12 2023 outlook
FOR PUBLIC DISTRIBUTION IN THE U.S., CANADA, LATIN AMERICA, HONG KONG, SINGAPORE AND AUSTRALIA.
FOR INSTITUTIONAL, PROFESSIONAL, QUALIFIED INVESTORS AND QUALIFIED CLIENTS IN OTHER PERMITTED COUNTRIES.
Regime drivers
Hannah Johnson
Portfolio Manager, Natural
Resources, BlackRock
Fundamental Equity
We find good opportunities by
getting ahead of where the
green investments are going.”
Faster transition
We track the transition to net-zero
carbon emissions like we track any
other driver of investment risks and
opportunities, such as monetary
policy. We take a view on how it is
likely to play out, not how it should
play out. We assess its implications
for financial risks and returns.
Our research suggests the global
transition could accelerate,
boosted by significant climate
policy action, by technological
progress reducing the cost of
renewable energy and by shifting
societal preferences as physical
damage from climate change – and
its costs – become more evident.
Europe has intensified its efforts to
build clean energy infrastructureas
it seeks to wean itself off Russian
energy. The clearest example of
that is the European Commission’s
RePowerEUPlan. Furtherimpetus
is likely to come from higher
traditional energy prices, which are
exacerbating the cost-of-living
crisis and have shifted the
economics decisively in favor of
cleaner energy sources. In the U.S.,
the Inflation Reduction Act is
poised to unleash enormous
investment.
We see it cutting clean technology
costs and spurring domestic
manufacturing.
We see opportunities in transition-
ready investments. Infrastructureis
one way to play into that. See page
13. Yet the transition is set to add to
production constraints, in our view.
It involves a huge reallocation of
resources. Oil and gas will still be
needed to meet future energy
demand under any plausible
transition. If high-carbon production
falls faster than low-carbon
alternativesare phased in, shortages
could result, driving up prices and
disrupting economic activity. The
faster the transition, the more out of
sync the handoff could be –
meaning more volatile inflation and
economic activity.
Policy helping accelerate the transition
Source: BlackRock Investment Institute and International Energy Agency (IEA), November 2022.Notes: The
chart shows IEA estimatesof past and planned annual green investment, in trillions of U.S. dollars. Forward-
lookingestimatesmay not come to pass.
We track the transition to net-zero
carbon emissions as we track any other
driver of investment risks and
opportunities.
Total annual green investment,past and planned, 2015-2030
Chart takeaway: Global investmentin the net-zero transition is
set to step up notably in coming years – largely thanks to key
policy action.
0
0.5
1
1.5
2
2.5
2015 2016 2017 2018 2019 2020 2021 2030
U.S.
dollar
trillion
Developed economies China Emerging economies
BIIM1122U/M-2612147-12/16
13. 13
13 2022 midyear outlook
13 2023 outlook
FOR PUBLIC DISTRIBUTION IN THE U.S., CANADA, LATIN AMERICA, HONG KONG, SINGAPORE AND AUSTRALIA.
FOR INSTITUTIONAL, PROFESSIONAL, QUALIFIED INVESTORS AND QUALIFIED CLIENTS IN OTHER PERMITTED COUNTRIES.
Private markets
Anne Valentine
Andrews
Global Head, BlackRock
Alternatives, Infrastructure
and Real Estate
Asset selection is vital, in our
view, given the high dispersion
of performance even within
the infrastructure asset class.”
The long view on
infrastructure
In private markets, valuations have
not caught up with the public
market selloff, reducing their
relative appeal. We are
underweightprivate markets in our
strategic views, particularly
segments such as private equity
that have seen heavy inflows. But
we think private markets – a
complex asset class not suitable
for all investors – should be a
larger allocation than what we see
most qualified investors hold.
We see some opportunitiesin
infrastructure.From roads to
airports and energy infrastructure,
these assets are essential to
industry and households alike.
Infrastructure has the potentialto
benefit from increaseddemand for
capital over the long term, powered
by structuraltrends such as the
energy crunch and digitalization.
The chart shows World Bank data
pointing to a gap of about $15
trillion between existing
investmentsand what’sneededto
meet global infrastructuredemand
over coming decades.
The U.S. Inflation Reduction Act
alone earmarks nearly $400 billion
of investment and incentives in
sustainable infrastructureand
supply chains.
We believe infrastructurecan help
diversify returns and provide stable
long-term cashflows – even with
risks such as governments imposing
artificial price caps amid political
pressure. Infrastructureearnings are
often less tied to economic cycles
than corporate assets. Contractscan
be long-term and span decades. And
infrastructure assets can help hedge
against inflation, with fixed costs
and prices linked to inflation.
Sources:BlackRockInvestmentInstituteandWorldBank,2017. Notes:The chartshows
estimatedinfrastructureinvestmentfor50 countriesthrough2040. The yellowlineshows
investmentneededannually.The orangelineshowsinvestmenttrends assumingcountriesinvest
inlinewithcurrent trends,accordingto the WorldBank.The cumulativetotalof $95 trillionisfor
investmentneededvs.$80 trillionincurrenttrends.Forwardlookingestimatesmaynot cometo
pass.
Private markets are not immune to
macro volatility. Yet for strategic
investors, asset classes such as
infrastructure could provide a way to
play into structural trends.
Infrastructure investment,2007-2040
Chart takeaway: Structural trends – the reshaping global energy
supply, digitalization and decarbonization – entail a sizeable step-
up in the pace of infrastructureinvestments.
1
2
3
4
5
2007 2017 2027 2037
U.S.
dollar
trillion
Current pace Projected need
$95t
$80t
Cumulative
Investment gap
BIIM1122U/M-2612147-13/16
14. 14
14 2022 midyear outlook
14 2023 outlook
Getting
granular
Our new investment playbook – both strategic and
tactical – calls for greatergranularity to capture
opportunities arising from greater dispersion and
volatility we anticipate in coming years.
Take equities. We are tactically underweight DM equities.
We break this down as an underweightin the U.S., Europe
and UK and a neutral on Japan. But we take it a step
further via sectoral preferencesthat we think will be key
in the new regime. We like energy, financials and
healthcareover staples, utilities and consumer
discretionary. On a strategic horizon, we are overweight
equities with a preferencefor DM. We think DM equities
are one way to get more granularand benefit from
structural trends. We believe DM equity indexes are
better positioned for the net-zerotransition, for instance,
with heavierweights in lower carbon-intensive sectors
such as tech and healthcare.
In fixed income, the return of income and carry has
boosted the allure of certain bonds, especially short term.
We don’t think leaning into broad indexes or asset
allocation blocks is the correct approach. We stay
underweightlong-term nominal bonds as we see term
premium returning due to persistent inflation, high debt
loads and thinning market liquidity. For those reasons,
they won’t play the same safe-havenrole as in the old
playbook. These factors matterless for short-term bonds,
in our view. We also have a high conviction overweight to
investment grade credit – relative to a neutral on high
yield – and we still like inflation-linked over nominal
bonds in both tactical and strategic views.
Directional views Strategic (long-term) and tactical (6-12 month) views on broad asset classes, November2022
Note:Viewsarefroma U.S. dollarperspective,November2022. Thismaterialrepresents anassessmentofthe marketenvironmentata
specifictime andisnotintendedto be a forecastoffutureevents ora guaranteeoffutureresults.Thisinformationshould notbe relied
uponby the readerasresearchor investmentadvice regardingany particularfunds,strategy or security.
Directional views
FOR PUBLIC DISTRIBUTION IN THE U.S., CANADA, LATIN AMERICA, HONG KONG, SINGAPORE AND AUSTRALIA.
FOR INSTITUTIONAL, PROFESSIONAL, QUALIFIED INVESTORS AND QUALIFIED CLIENTS IN OTHER PERMITTED COUNTRIES.
Asset Strategic view Tacticalview
Equities
We are overweight equities in our strategic views
as we estimate the overall return of stocks will be
greater than fixed-income assets over the
coming decade. Valuations on a long-horizon do
not appear stretched to us. Tactically, we’re
underweight DM stocks as central banks look set
to overtighten policy – we see recessions
looming. Corporate earnings expectations have
yet to fully reflect even a modest recession.
Credit
Strategically, we add to our overweight to global
investment grade credit on attractive valuations
and income potential given higher yields. We turn
neutral high yield as we see the asset class as
more vulnerable to recession risks. Tactically,
we’re also overweight investment grade and
neutral high yield. We prefer to be up in quality.
We cut EM debt to neutral after its strong run. We
see better opportunities for income in DMs.
Govt
Bonds
The underweight in our strategic view on
government bonds reflects a big spread: max
underweight nominal, max overweight inflation-
linked and an underweight on Chinese bonds. We
think markets are underappreciating the
persistence of high inflation and the implications
for investors demanding a higher term premium.
Tactically, we are underweight long-dated DM
government bonds as we see term premium
driving yields higher, yet we are neutral short-
dated government bonds as we see a likely peak
in pricing of policy rates. The high yields offer
relatively attractive income opportunities.
Private
Markets
We’re underweight private growth assets and
neutral on private credit, from a starting
allocation that is much larger than what most
qualified investors hold. Private assets are not
immune to higher macro and market volatility or
higher rates, and public market selloffs have
reduced their relative appeal. Private allocations
are long-term commitments, however, and we see
opportunities as assets reprice over time. Private
markets are a complex asset class not suitable
for all investors.
Underweight Neutral Overweight n Previous view
BIIM1122U/M-2612147-14/16
15. 15
15 2022 midyear outlook
15 2023 outlook
Equities View Commentary
Developed
markets
We are underweight. Neither earnings expectations
nor valuations fully reflect the coming recession.
We prefer to take a sectoral approach – and prefer
energy, financials and healthcare.
United States
We are underweight. The Fed is set to raise rates
into restrictive territory. Earnings downgrades are
starting, but don’t yet reflect the coming recession.
Europe
We are underweight. The energy price shock and
policy tightening raise stagflation risks.
UK
We are underweight. We find valuations expensive
after the strong relative performance versus other
DM markets thanks to energy sector exposure.
Japan
We are neutral. We like still-easy monetary policy
and increasing dividend payouts. Slowing global
growth is a risk.
China
We are neutral. Activity is restarting, but we see
China on the path to lower growth. Tighter state
control of the economy makes Chinese assets
riskier, in our view.
Emerging markets
We are neutral. Slowing global growth will weigh on
EMs. Within the asset classes, we lean toward
commodity exporters over importers.
Asia ex-Japan
We are neutral. China’s near-term cyclical rebound
is a positive, yet we don’t see valuations compelling
enough to turn overweight.
Tactical granular views
Six to 12-month tactical views on selected assets vs. broad global asset classes by level of conviction, November2022
Pastperformanceis nota reliableindicatorofcurrentorfutureresults.It is notpossibletoinvestdirectlyinanindex. Note:Views are from a U.S. dollar perspective. This material represents an assessment of the market environment at a specific timeand is
not intended to be a forecast or guarantee of future results. This information should not be reliedupon as investment advice regarding any particular fund, strategy or security.
FOR PUBLIC DISTRIBUTION IN THE U.S., CANADA, LATIN AMERICA, HONG KONG, SINGAPORE AND AUSTRALIA.
FOR INSTITUTIONAL, PROFESSIONAL, QUALIFIED INVESTORS AND QUALIFIED CLIENTS IN OTHER PERMITTED COUNTRIES.
Fixed
income
View Commentary
Long U.S.
Treasuries
We are underweight. We see long-term yields moving up
further as investors demand a greater term premium.
Short U.S.
Treasuries
We are neutral. We remain invested in the front end due to
attractive income potential.
Global
inflation-
linked bonds
We are overweight. We see breakeven inflation rates
underpricing the persistent inflation we expect.
European
government
bonds
We turn underweight the long end. We expect a return of
term premium to push long-term yields up. We see higher
inflation persisting and sharp rate hikes as a risk to
peripheral spreads.
UK gilts
We are underweight. Perceptions of fiscal credibility have
not fully recovered. We prefer short-dated gilts for income.
China govt
bonds
We are neutral. Policymakers have been slow to loosen
policy to offset the slowdown, and they are less attractive
than DM bonds.
Global IG
credit
We add to our overweight. High-quality corporates’ strong
balance sheets imply IG credit could weather a recession
better than stocks.
U.S. agency
MBS
We are overweight. We see the asset class as a high-quality
exposure within a diversified bond allocation. Soaring U.S.
mortgage rates have boosted potential income.
Global high
yield
We are neutral. We prefer up-in-quality credit exposures
amid a worsening macro backdrop.
EM hard
currency
We are neutral. We see support from higher commodities
prices yet it is vulnerable to rising U.S. yields.
EM
local currency
We cut EM debt to neutral after its strong run. We see
better opportunities for income in DMs.
Asia fixed
income
We are neutral amid a worsening macro outlook. We don’t
find valuations compelling enough yet to turn more
positive on the asset class.
Underweight Neutral Overweight n Previous view
BIIM1122U/M-2612147-15/16