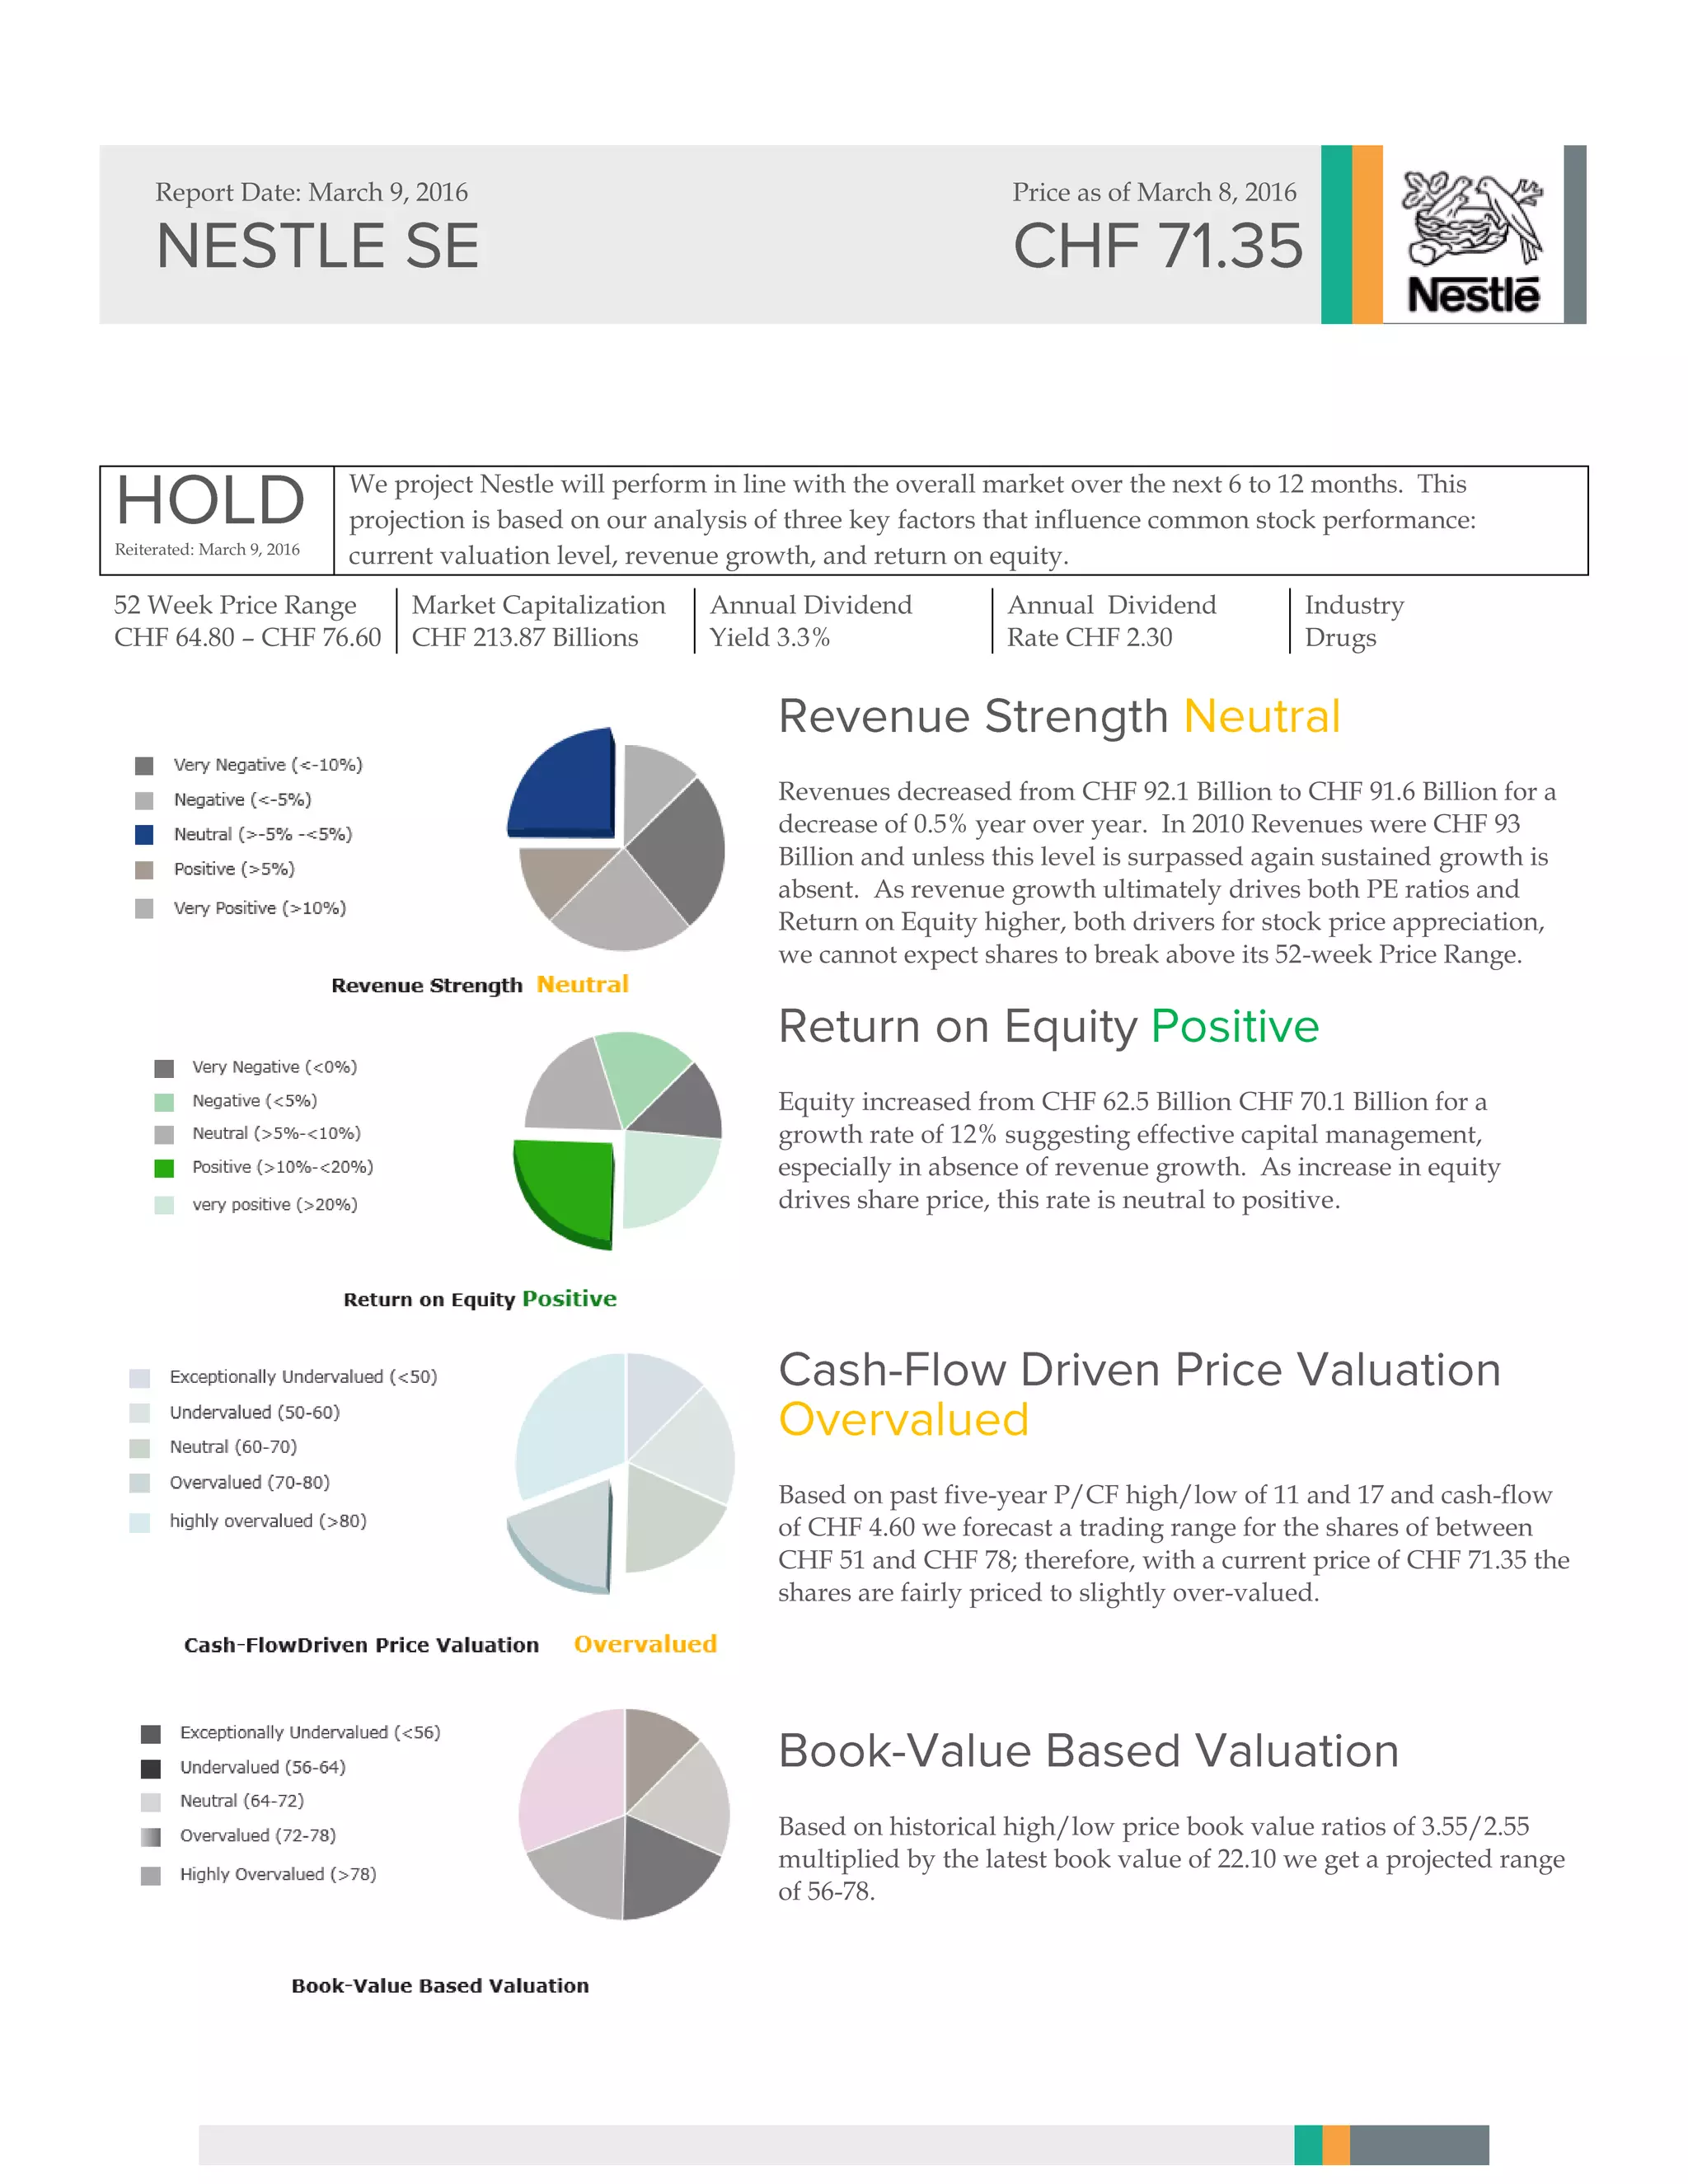
SlideShare a Scribd company logo
Reiterated: March 9, 2016
We project Nestle will perform in line with the overall market over the next 6 to 12 months. This
projection is based on our analysis of three key factors that influence common stock performance:
current valuation level, revenue growth, and return on equity.
52 Week Price Range
CHF 64.80 – CHF 76.60
Market Capitalization
CHF 213.87 Billions
Annual Dividend
Yield 3.3%
Annual Dividend
Rate CHF 2.30
Industry
Drugs
Revenues decreased from CHF 92.1 Billion to CHF 91.6 Billion for a
decrease of 0.5% year over year. In 2010 Revenues were CHF 93
Billion and unless this level is surpassed again sustained growth is
absent. As revenue growth ultimately drives both PE ratios and
Return on Equity higher, both drivers for stock price appreciation,
we cannot expect shares to break above its 52-week Price Range.
Equity increased from CHF 62.5 Billion CHF 70.1 Billion for a
growth rate of 12% suggesting effective capital management,
especially in absence of revenue growth. As increase in equity
drives share price, this rate is neutral to positive.
Based on past five-year P/CF high/low of 11 and 17 and cash-flow
of CHF 4.60 we forecast a trading range for the shares of between
CHF 51 and CHF 78; therefore, with a current price of CHF 71.35 the
shares are fairly priced to slightly over-valued.
Based on historical high/low price book value ratios of 3.55/2.55
multiplied by the latest book value of 22.10 we get a projected range
of 56-78.
Report Date: March 9, 2016 Price as of March 8, 2016
2
that owns a vas line-up of well-known brands with the most recognizable being: Carnation, Coffee-Mate, Dreyer’s, Friskies,
Gerber, Gourmet, HäagenDazs, KitKat, Maggi, Mövenpick, Nescafe, Perrier, Purina, S. Pellegrino, Smarties, Thomy.
Cash-Flow Valuation Bands
Valuation bands are based on the highest and lowest
Price/CF ratio in the past five years applied to the trailing
12-month cash-flow. Price (CHF)
0
20
40
60
80
100
2011 2012 2013 2014 2015
Lower Band Upper Band
Report Date: March 9, 2016 Price as of March 8, 2016
3
Book Value Valuation Bands
Valuation Bands are based on highest and lowest
price/book value ratios based on trailing 12 month book-
value
2010 2011 2012 2013 2014
REVENUE GROWTH -14% -10% 7% 3% -1%
CASH 4.00 3.20 4.90 4.70 4.60
RETURN ON EQUITY 26% -8% 7% 3% 12%
BOOK VALUE 18.40 17.80 19.10 19.60 22.10
DIVIDEND PAID 1.85 1.95 2.05 2.15 2.20
DIVIDEND YIELD 3.3% 3.6% 3.4% 3.3% 3.0%
0
20
40
60
80
100
2011 2012 2013 2014 2015 2016
Lower Band Upper Band
4
Meier's Hold recommendation on Nestle is the result of our systematic analysis on four basic characteristics: revenue
strength, relative valuation, book value, and return on equity. The company has generated a negative trend in revenue
growth over the past 5 years and hasn’t surpassed the level reached in 2009. However, while the company hasn’t reached its
downwards revised forecast several times, Nestle has improved its return on equity and increased its dividends
continuously. Based on its current valuation, the company is neutrally priced and doesn’t offer opportunistic capital
appreciation potential over the next 12 months. Due to the maturity and size of the company we focus on book value price
bands. The company has a constant and predictable price velocity around BV and should only be aggressively bought if they
fall below 56 CHF. The shares demonstrate low volatility and have a yield over 3% and could be interesting for fixed income
investors,
Revenue Strength is Negative
Return on Equity is a key fundamental measure for the
health of a business. For blue chip companies with high
value brands this measure should be above 15% year after
year. And although over the last period a positive rate of
12% was reached, the recent history was disappointing with
negative to single digits ROE. The decline since the 26%
recorded in 2010, demonstrates weakness. We assign a
neutral rating in this respect only due to the last period
return to double digit ROE.
Return on Equity is Neutral
Return on Equity is a key fundamental measure for the
health of a business. For blue chip companies with high
value brands this measure should be above 15% year after
year. And although over the last period a positive rate of
12% was reached, the recent history was disappointing with
negative to single digits ROE. The decline since the 26%
recorded in 2010, demonstrates weakness. We assign a
neutral rating in this respect only due to the last period
return to double digit ROE.
Cash-flow Strength is Negative
Cash-Flow has not had much growth in the last 5 years and
has decreased in the last period. The loss of cash-flow
generating power and lack of ability to overcome 2012 levels
show weakness. And although 2012 was promising with
positive cash-flow growth, 2013 was negative again. This
persistent weakness combined with the recent down-turn is
an indication of weakness that could lead to poor stock
performance.
Historical research shows that cash-flow strength is an
important factor driving stock price appreciation. Meier
measures cash-flow growth, and momentum changes to get
an early indication of changing cash-flow patterns.
Meier does its valuation work not based on future estimates,
which are pure guesswork, but on factual historical data,
analyzed to project future potential.
Book-Value strength is Positive
Mature companies can be accurately valued based on price
book value historical velocity. And a growing book value is
a good indicator that shares will appreciate in line with it.
Prices have shown a narrow trading range around book
value with high/low factors of 2.55 and 3.55 over the last five
years. So the increase over the last period of 13% is a positive
indicator that share-prices will appreciate in line with book
value growth momentum, all else being equal.
Report Date: March 9, 2016 Price as of March 8, 2016
5
Report Date: March 9, 2016 Price as of March 8, 2016
Meier Stock Ratings: Meier covers stocks traded on
the Swiss Exchange using a proprietary quantitative model
that evaluates a company’s revenue and cash-flow strength,
its relative valuation, such as price/cash-flow historical
velocity, and price book-value historical velocity. Meier’s five
recommendation ratings include strong buy, buy, hold, sell,
strong sell. For all stocks in our coverage universe, ratings
are generated each quarter and reflect the fundamental and
price data as of the last trading day of the quarter.
Quality Rating: Quality Rating is based on factors that
indicate a company’s overall financial strength and earnings
predictability. Each company in the Meier database is
assigned a quality rating ranging from A+ to C- based on
size, debt level, earnings history and industry stability. High
quality stocks tend to have higher average market
capitalizations and annual sales, as well as lower average
levels of debt as a percent of equity and lower earnings
variability. High quality stocks also tend to have lower
standard deviations of annual returns. Accordingly, a firm’s
quality rating may be used to gauge the risk associated with
a particular stock. The Quality Rating letter grades are
translated into the following categories: A- and higher are
High Quality; B and B+ are Good Quality; B- is Average
Quality; C+ is Low Quality; C and lower are Very Poor
Quality.
Valuation Bands: The Ford Valuation Bands charts
shows the price performance of the stock over the past 5 year
period in relation to its historical price/cash-flow, and the
price/book-value valuation range. The red and green lines
indicate the highest and lowest P/CF&P/BV, respectively, in
the past 5 years multiplied by trailing 12-month cash-
flow/book-value per share at the plotted point. The end
point prices shows the current share price (in black) along
with the potential high price based on the highest realized
P/E & P/BVin the past 5 years (in red), potential low price
based on lowest realized P/E & P/BV in the past 5 years (in
green).
Disclaimer The reports and the ratings contained herein were prepared by Meier Equity Research solely for the use of its clients
and authorized subscribers. Reproduction or distribution of such reports or ratings in any form is prohibited without the
express prior written permission of Meier Equity Research. The reports and ratings are based on publicly available information
believed to be reliable. Meier Equity Research endeavors to present the timeliest and most accurate data possible, but accuracy
in not guaranteed. Additional information, such as corporate actions, industry and economic factors, and other events and
circumstances that may affect a stock’s price may not be reflected in the Meier Equity Research rating or in the data presented.
This report is for information purposes only and should not be construed as an offer to buy or sell any security.
Recommendations made in this report may not be suitable for all investors. Recommendations do not take into account the
individual user’s investment risk or return objectives or constraints. Meier is not responsible for the results of actions taken
based on the information presented. Opinions expressed herein are subject to change without notice. The research process used
is derived solely from a quantitative approach that uses historical data to produce a stock ranking system. Each covered stock is
assigned one of five ratings based on relative scores, Strong Buy, Buy, Hold,

More Related Content

What's hot

Report on Staple's
Report on Staple'sReport on Staple's
Report on Staple's
Jiaying Zhu
 
20010430 bonding with iceland
20010430 bonding with iceland20010430 bonding with iceland
20010430 bonding with iceland
Mar Wolfgang Mixa
 
Monthly Perspectives - Volatility - June 2016
Monthly Perspectives - Volatility - June 2016Monthly Perspectives - Volatility - June 2016
Monthly Perspectives - Volatility - June 2016
TD Wealth Private Investment Advice
 
Asset allocation update
Asset allocation updateAsset allocation update
Asset allocation update
Richard Woolhouse
 
Capital Markets Insights - Q4 2016
Capital Markets Insights - Q4 2016Capital Markets Insights - Q4 2016
Capital Markets Insights - Q4 2016
Duff & Phelps
 
otm-pham0914
otm-pham0914otm-pham0914
otm-pham0914
Peter Pham
 
2017 Pursuing a Better Investment Experience
2017 Pursuing a Better Investment Experience  2017 Pursuing a Better Investment Experience
2017 Pursuing a Better Investment Experience
Susan Linkous, AIF®
 
Valuation Insights: Second Quarter 2017
Valuation Insights: Second Quarter 2017Valuation Insights: Second Quarter 2017
Valuation Insights: Second Quarter 2017
Duff & Phelps
 
Essay apa-sample
Essay apa-sampleEssay apa-sample
Essay apa-sample
Cheap Custom Writing
 
Reliance Corporate Presentation
Reliance Corporate Presentation Reliance Corporate Presentation
Reliance Corporate Presentation
Ayushman Dutta
 
US Strategy Weekly
US Strategy Weekly US Strategy Weekly
US Strategy Weekly
Bennett Gordon Cfa Cfp
 
Wrhe 4 q2004 letter
Wrhe 4 q2004 letterWrhe 4 q2004 letter
Wrhe 4 q2004 letter
Michael Durante
 
James Hamer – Proactive Advisor Magazine – Volume 3, Issue 12
James Hamer – Proactive Advisor Magazine – Volume 3, Issue 12James Hamer – Proactive Advisor Magazine – Volume 3, Issue 12
James Hamer – Proactive Advisor Magazine – Volume 3, Issue 12
Proactive Advisor Magazine
 
Where to invest in 2015
Where to invest in 2015Where to invest in 2015
Where to invest in 2015
High Return Investments
 
‘Over the Horizon’ sharemarket commentary – October 2013
‘Over the Horizon’ sharemarket commentary – October 2013‘Over the Horizon’ sharemarket commentary – October 2013
‘Over the Horizon’ sharemarket commentary – October 2013
David Offer
 
Final Project International Financial Management -
Final Project International Financial Management -Final Project International Financial Management -
Final Project International Financial Management -
Alaa Sulaiman
 
SP Capital IQ European Insurers
SP Capital IQ European InsurersSP Capital IQ European Insurers
SP Capital IQ European Insurers
Roderick Wallace, CFA
 
Agf market outlook
Agf market outlookAgf market outlook
Agf market outlook
Kevin Cheng, CFA
 
A Study on Ratio Analysis
A Study on Ratio AnalysisA Study on Ratio Analysis
A Study on Ratio Analysis
ijtsrd
 
Instaforex brociur
Instaforex brociurInstaforex brociur

What's hot (20)

Report on Staple's
Report on Staple'sReport on Staple's
Report on Staple's
 
20010430 bonding with iceland
20010430 bonding with iceland20010430 bonding with iceland
20010430 bonding with iceland
 
Monthly Perspectives - Volatility - June 2016
Monthly Perspectives - Volatility - June 2016Monthly Perspectives - Volatility - June 2016
Monthly Perspectives - Volatility - June 2016
 
Asset allocation update
Asset allocation updateAsset allocation update
Asset allocation update
 
Capital Markets Insights - Q4 2016
Capital Markets Insights - Q4 2016Capital Markets Insights - Q4 2016
Capital Markets Insights - Q4 2016
 
otm-pham0914
otm-pham0914otm-pham0914
otm-pham0914
 
2017 Pursuing a Better Investment Experience
2017 Pursuing a Better Investment Experience  2017 Pursuing a Better Investment Experience
2017 Pursuing a Better Investment Experience
 
Valuation Insights: Second Quarter 2017
Valuation Insights: Second Quarter 2017Valuation Insights: Second Quarter 2017
Valuation Insights: Second Quarter 2017
 
Essay apa-sample
Essay apa-sampleEssay apa-sample
Essay apa-sample
 
Reliance Corporate Presentation
Reliance Corporate Presentation Reliance Corporate Presentation
Reliance Corporate Presentation
 
US Strategy Weekly
US Strategy Weekly US Strategy Weekly
US Strategy Weekly
 
Wrhe 4 q2004 letter
Wrhe 4 q2004 letterWrhe 4 q2004 letter
Wrhe 4 q2004 letter
 
James Hamer – Proactive Advisor Magazine – Volume 3, Issue 12
James Hamer – Proactive Advisor Magazine – Volume 3, Issue 12James Hamer – Proactive Advisor Magazine – Volume 3, Issue 12
James Hamer – Proactive Advisor Magazine – Volume 3, Issue 12
 
Where to invest in 2015
Where to invest in 2015Where to invest in 2015
Where to invest in 2015
 
‘Over the Horizon’ sharemarket commentary – October 2013
‘Over the Horizon’ sharemarket commentary – October 2013‘Over the Horizon’ sharemarket commentary – October 2013
‘Over the Horizon’ sharemarket commentary – October 2013
 
Final Project International Financial Management -
Final Project International Financial Management -Final Project International Financial Management -
Final Project International Financial Management -
 
SP Capital IQ European Insurers
SP Capital IQ European InsurersSP Capital IQ European Insurers
SP Capital IQ European Insurers
 
Agf market outlook
Agf market outlookAgf market outlook
Agf market outlook
 
A Study on Ratio Analysis
A Study on Ratio AnalysisA Study on Ratio Analysis
A Study on Ratio Analysis
 
Instaforex brociur
Instaforex brociurInstaforex brociur
Instaforex brociur
 

Similar to Equity report nestle

DIAS PRESENTATION.pptx
DIAS PRESENTATION.pptxDIAS PRESENTATION.pptx
DIAS PRESENTATION.pptx
HaritikaChhatwal1
 
Bhati fm202 unit2 trend analysis
Bhati fm202 unit2 trend analysisBhati fm202 unit2 trend analysis
Bhati fm202 unit2 trend analysis
ASM's IBMR- Chinchwad
 
trend analysis
trend analysistrend analysis
trend analysis
ASM's IBMR- Chinchwad
 
Financial analysis techniques
Financial analysis techniques  Financial analysis techniques
Financial analysis techniques
Neven Erfan
 
Luyao_Yang_COH_Report
Luyao_Yang_COH_ReportLuyao_Yang_COH_Report
Luyao_Yang_COH_Report
璐瑶 杨
 
Shopify Investor Deck - August 2016
Shopify Investor Deck - August 2016Shopify Investor Deck - August 2016
Shopify Investor Deck - August 2016
shopifyInvestors
 
Salesforce.com.pdf
Salesforce.com.pdfSalesforce.com.pdf
Salesforce.com.pdf
Stocktargetadvisor.com
 
Sleep country draft roadshow presentation
Sleep country   draft roadshow presentationSleep country   draft roadshow presentation
Sleep country draft roadshow presentation
SleepCountry
 
Sleep country draft roadshow presentation - updated as at nov 30 2017 v2
Sleep country   draft roadshow presentation - updated as at nov 30 2017 v2Sleep country   draft roadshow presentation - updated as at nov 30 2017 v2
Sleep country draft roadshow presentation - updated as at nov 30 2017 v2
SleepCountry
 
Capital Structure and Payout Policies of P&G
Capital Structure and Payout Policies of P&GCapital Structure and Payout Policies of P&G
Capital Structure and Payout Policies of P&G
Rawan Nadeem
 
Avant Garde wealth Mgmt - Quarterly letter - 1303
Avant Garde wealth Mgmt - Quarterly letter - 1303Avant Garde wealth Mgmt - Quarterly letter - 1303
Avant Garde wealth Mgmt - Quarterly letter - 1303
Gaurav Jalan
 
Strategic assignment v1
Strategic assignment v1Strategic assignment v1
Strategic assignment v1
Tabish Ahmad
 
2016 12-15 investor meeting final final web
2016 12-15 investor meeting final final web2016 12-15 investor meeting final final web
2016 12-15 investor meeting final final web
pinnaclefood
 
Abacus Weath Partners Investment slideshow
Abacus Weath Partners Investment slideshowAbacus Weath Partners Investment slideshow
Abacus Weath Partners Investment slideshow
Abacus Wealth Partners
 
PwC Case Challenge 2015 Report Summary
PwC Case Challenge 2015 Report SummaryPwC Case Challenge 2015 Report Summary
PwC Case Challenge 2015 Report Summary
Yexin (Olivia) Wan
 
DSP Midcap Fund
DSP Midcap FundDSP Midcap Fund
DSP Midcap Fund
DSP Mutual Fund
 
DSP Midcap Fund
DSP Midcap FundDSP Midcap Fund
DSP Midcap Fund
DSP Mutual Fund
 
DSP Midcap Fund Presentation March 23.pdf
DSP Midcap Fund Presentation March 23.pdfDSP Midcap Fund Presentation March 23.pdf
DSP Midcap Fund Presentation March 23.pdf
DSP Mutual Fund
 
Q1 2017 investor deck
Q1 2017 investor deckQ1 2017 investor deck
Q1 2017 investor deck
shopifyInvestors
 
9 Important Things To Consider In Quarterly Results Before Investing In Stock...
9 Important Things To Consider In Quarterly Results Before Investing In Stock...9 Important Things To Consider In Quarterly Results Before Investing In Stock...
9 Important Things To Consider In Quarterly Results Before Investing In Stock...
ZyloStar
 

Similar to Equity report nestle (20)

DIAS PRESENTATION.pptx
DIAS PRESENTATION.pptxDIAS PRESENTATION.pptx
DIAS PRESENTATION.pptx
 
Bhati fm202 unit2 trend analysis
Bhati fm202 unit2 trend analysisBhati fm202 unit2 trend analysis
Bhati fm202 unit2 trend analysis
 
trend analysis
trend analysistrend analysis
trend analysis
 
Financial analysis techniques
Financial analysis techniques  Financial analysis techniques
Financial analysis techniques
 
Luyao_Yang_COH_Report
Luyao_Yang_COH_ReportLuyao_Yang_COH_Report
Luyao_Yang_COH_Report
 
Shopify Investor Deck - August 2016
Shopify Investor Deck - August 2016Shopify Investor Deck - August 2016
Shopify Investor Deck - August 2016
 
Salesforce.com.pdf
Salesforce.com.pdfSalesforce.com.pdf
Salesforce.com.pdf
 
Sleep country draft roadshow presentation
Sleep country   draft roadshow presentationSleep country   draft roadshow presentation
Sleep country draft roadshow presentation
 
Sleep country draft roadshow presentation - updated as at nov 30 2017 v2
Sleep country   draft roadshow presentation - updated as at nov 30 2017 v2Sleep country   draft roadshow presentation - updated as at nov 30 2017 v2
Sleep country draft roadshow presentation - updated as at nov 30 2017 v2
 
Capital Structure and Payout Policies of P&G
Capital Structure and Payout Policies of P&GCapital Structure and Payout Policies of P&G
Capital Structure and Payout Policies of P&G
 
Avant Garde wealth Mgmt - Quarterly letter - 1303
Avant Garde wealth Mgmt - Quarterly letter - 1303Avant Garde wealth Mgmt - Quarterly letter - 1303
Avant Garde wealth Mgmt - Quarterly letter - 1303
 
Strategic assignment v1
Strategic assignment v1Strategic assignment v1
Strategic assignment v1
 
2016 12-15 investor meeting final final web
2016 12-15 investor meeting final final web2016 12-15 investor meeting final final web
2016 12-15 investor meeting final final web
 
Abacus Weath Partners Investment slideshow
Abacus Weath Partners Investment slideshowAbacus Weath Partners Investment slideshow
Abacus Weath Partners Investment slideshow
 
PwC Case Challenge 2015 Report Summary
PwC Case Challenge 2015 Report SummaryPwC Case Challenge 2015 Report Summary
PwC Case Challenge 2015 Report Summary
 
DSP Midcap Fund
DSP Midcap FundDSP Midcap Fund
DSP Midcap Fund
 
DSP Midcap Fund
DSP Midcap FundDSP Midcap Fund
DSP Midcap Fund
 
DSP Midcap Fund Presentation March 23.pdf
DSP Midcap Fund Presentation March 23.pdfDSP Midcap Fund Presentation March 23.pdf
DSP Midcap Fund Presentation March 23.pdf
 
Q1 2017 investor deck
Q1 2017 investor deckQ1 2017 investor deck
Q1 2017 investor deck
 
9 Important Things To Consider In Quarterly Results Before Investing In Stock...
9 Important Things To Consider In Quarterly Results Before Investing In Stock...9 Important Things To Consider In Quarterly Results Before Investing In Stock...
9 Important Things To Consider In Quarterly Results Before Investing In Stock...
 

More from Steve Paper

Music school for henrique square
Music school for henrique squareMusic school for henrique square
Music school for henrique square
Steve Paper
 
Terrallgae english
Terrallgae englishTerrallgae english
Terrallgae english
Steve Paper
 
Alpha extraction concept note
Alpha extraction   concept noteAlpha extraction   concept note
Alpha extraction concept note
Steve Paper
 
Tech prod b plan-sample
Tech prod   b plan-sampleTech prod   b plan-sample
Tech prod b plan-sample
Steve Paper
 
Ppt2 wip
Ppt2 wipPpt2 wip
Ppt2 wip
Steve Paper
 
Numbers biz brochure
Numbers biz brochureNumbers biz brochure
Numbers biz brochure
Steve Paper
 
Mango mobility final presentation
Mango mobility final presentationMango mobility final presentation
Mango mobility final presentation
Steve Paper
 
Klm after refresh
Klm after refreshKlm after refresh
Klm after refresh
Steve Paper
 
Adult adhd treatment research project
Adult adhd treatment research projectAdult adhd treatment research project
Adult adhd treatment research project
Steve Paper
 
Main
MainMain
Cv 2017 eng
Cv 2017 engCv 2017 eng
Cv 2017 eng
Steve Paper
 
Jason stevens.compressed
Jason stevens.compressedJason stevens.compressed
Jason stevens.compressed
Steve Paper
 
Dani resume
Dani resumeDani resume
Dani resume
Steve Paper
 
Cindy profile
Cindy profileCindy profile
Cindy profile
Steve Paper
 
Chelsea resume-v3
Chelsea resume-v3Chelsea resume-v3
Chelsea resume-v3
Steve Paper
 
Teoma strategic2-delivery
Teoma strategic2-deliveryTeoma strategic2-delivery
Teoma strategic2-delivery
Steve Paper
 
Pims ppt professional
Pims ppt professionalPims ppt professional
Pims ppt professional
Steve Paper
 
Oxygen message _creative_sparkle
Oxygen message _creative_sparkleOxygen message _creative_sparkle
Oxygen message _creative_sparkle
Steve Paper
 
Freewill yash arya
Freewill yash aryaFreewill yash arya
Freewill yash arya
Steve Paper
 
Novaempresappt
NovaempresapptNovaempresappt
Novaempresappt
Steve Paper
 

More from Steve Paper (20)

Music school for henrique square
Music school for henrique squareMusic school for henrique square
Music school for henrique square
 
Terrallgae english
Terrallgae englishTerrallgae english
Terrallgae english
 
Alpha extraction concept note
Alpha extraction   concept noteAlpha extraction   concept note
Alpha extraction concept note
 
Tech prod b plan-sample
Tech prod   b plan-sampleTech prod   b plan-sample
Tech prod b plan-sample
 
Ppt2 wip
Ppt2 wipPpt2 wip
Ppt2 wip
 
Numbers biz brochure
Numbers biz brochureNumbers biz brochure
Numbers biz brochure
 
Mango mobility final presentation
Mango mobility final presentationMango mobility final presentation
Mango mobility final presentation
 
Klm after refresh
Klm after refreshKlm after refresh
Klm after refresh
 
Adult adhd treatment research project
Adult adhd treatment research projectAdult adhd treatment research project
Adult adhd treatment research project
 
Main
MainMain
Main
 
Cv 2017 eng
Cv 2017 engCv 2017 eng
Cv 2017 eng
 
Jason stevens.compressed
Jason stevens.compressedJason stevens.compressed
Jason stevens.compressed
 
Dani resume
Dani resumeDani resume
Dani resume
 
Cindy profile
Cindy profileCindy profile
Cindy profile
 
Chelsea resume-v3
Chelsea resume-v3Chelsea resume-v3
Chelsea resume-v3
 
Teoma strategic2-delivery
Teoma strategic2-deliveryTeoma strategic2-delivery
Teoma strategic2-delivery
 
Pims ppt professional
Pims ppt professionalPims ppt professional
Pims ppt professional
 
Oxygen message _creative_sparkle
Oxygen message _creative_sparkleOxygen message _creative_sparkle
Oxygen message _creative_sparkle
 
Freewill yash arya
Freewill yash aryaFreewill yash arya
Freewill yash arya
 
Novaempresappt
NovaempresapptNovaempresappt
Novaempresappt
 

Recently uploaded

IMG_20240615_091110.pdf dpboss guessing
IMG_20240615_091110.pdf dpboss  guessingIMG_20240615_091110.pdf dpboss  guessing
High-Quality IPTV Monthly Subscription for $15
High-Quality IPTV Monthly Subscription for $15High-Quality IPTV Monthly Subscription for $15
High-Quality IPTV Monthly Subscription for $15
advik4387
 
DearbornMusic-KatherineJasperFullSailUni
DearbornMusic-KatherineJasperFullSailUniDearbornMusic-KatherineJasperFullSailUni
DearbornMusic-KatherineJasperFullSailUni
katiejasper96
 
Prescriptive analytics BA4206 Anna University PPT
Prescriptive analytics BA4206 Anna University PPTPrescriptive analytics BA4206 Anna University PPT
Prescriptive analytics BA4206 Anna University PPT
Freelance
 
Best Competitive Marble Pricing in Dubai - ☎ 9928909666
Best Competitive Marble Pricing in Dubai - ☎ 9928909666Best Competitive Marble Pricing in Dubai - ☎ 9928909666
Best Competitive Marble Pricing in Dubai - ☎ 9928909666
Stone Art Hub
 
❼❷⓿❺❻❷❽❷❼❽ Dpboss Matka Result Satta Matka Guessing Satta Fix jodi Kalyan Fin...
❼❷⓿❺❻❷❽❷❼❽ Dpboss Matka Result Satta Matka Guessing Satta Fix jodi Kalyan Fin...❼❷⓿❺❻❷❽❷❼❽ Dpboss Matka Result Satta Matka Guessing Satta Fix jodi Kalyan Fin...
❼❷⓿❺❻❷❽❷❼❽ Dpboss Matka Result Satta Matka Guessing Satta Fix jodi Kalyan Fin...
❼❷⓿❺❻❷❽❷❼❽ Dpboss Kalyan Satta Matka Guessing Matka Result Main Bazar chart
 
The Most Inspiring Entrepreneurs to Follow in 2024.pdf
The Most Inspiring Entrepreneurs to Follow in 2024.pdfThe Most Inspiring Entrepreneurs to Follow in 2024.pdf
The Most Inspiring Entrepreneurs to Follow in 2024.pdf
thesiliconleaders
 
The latest Heat Pump Manual from Newentide
The latest Heat Pump Manual from NewentideThe latest Heat Pump Manual from Newentide
The latest Heat Pump Manual from Newentide
JoeYangGreatMachiner
 
PM Surya Ghar Muft Bijli Yojana: Online Application, Eligibility, Subsidies &...
PM Surya Ghar Muft Bijli Yojana: Online Application, Eligibility, Subsidies &...PM Surya Ghar Muft Bijli Yojana: Online Application, Eligibility, Subsidies &...
PM Surya Ghar Muft Bijli Yojana: Online Application, Eligibility, Subsidies &...
Ksquare Energy Pvt. Ltd.
 
State of D2C in India: A Logistics Update
State of D2C in India: A Logistics UpdateState of D2C in India: A Logistics Update
State of D2C in India: A Logistics Update
RedSeer
 
AI Transformation Playbook: Thinking AI-First for Your Business
AI Transformation Playbook: Thinking AI-First for Your BusinessAI Transformation Playbook: Thinking AI-First for Your Business
AI Transformation Playbook: Thinking AI-First for Your Business
Arijit Dutta
 
2024.06 CPMN Cambridge - Beyond Now-Next-Later.pdf
2024.06 CPMN Cambridge - Beyond Now-Next-Later.pdf2024.06 CPMN Cambridge - Beyond Now-Next-Later.pdf
2024.06 CPMN Cambridge - Beyond Now-Next-Later.pdf
Cambridge Product Management Network
 
Unlocking WhatsApp Marketing with HubSpot: Integrating Messaging into Your Ma...
Unlocking WhatsApp Marketing with HubSpot: Integrating Messaging into Your Ma...Unlocking WhatsApp Marketing with HubSpot: Integrating Messaging into Your Ma...
Unlocking WhatsApp Marketing with HubSpot: Integrating Messaging into Your Ma...
Niswey
 
Registered-Establishment-List-in-Uttarakhand-pdf.pdf
Registered-Establishment-List-in-Uttarakhand-pdf.pdfRegistered-Establishment-List-in-Uttarakhand-pdf.pdf
Registered-Establishment-List-in-Uttarakhand-pdf.pdf
dazzjoker
 
list of states and organizations .pdf
list of  states  and  organizations .pdflist of  states  and  organizations .pdf
list of states and organizations .pdf
Rbc Rbcua
 
Sustainable Logistics for Cost Reduction_ IPLTech Electric's Eco-Friendly Tra...
Sustainable Logistics for Cost Reduction_ IPLTech Electric's Eco-Friendly Tra...Sustainable Logistics for Cost Reduction_ IPLTech Electric's Eco-Friendly Tra...
Sustainable Logistics for Cost Reduction_ IPLTech Electric's Eco-Friendly Tra...
IPLTech Electric
 
Satta Matka Dpboss Kalyan Matka Results Kalyan Chart
Satta Matka Dpboss Kalyan Matka Results Kalyan ChartSatta Matka Dpboss Kalyan Matka Results Kalyan Chart
Satta Matka Dpboss Kalyan Matka Results Kalyan Chart
Satta Matka Dpboss Kalyan Matka Results
 
Satta Matka Dpboss Kalyan Matka Results Kalyan Chart
Satta Matka Dpboss Kalyan Matka Results Kalyan ChartSatta Matka Dpboss Kalyan Matka Results Kalyan Chart
Satta Matka Dpboss Kalyan Matka Results Kalyan Chart
Satta Matka Dpboss Kalyan Matka Results
 
deft. 2024 pricing guide for onboarding
deft.  2024 pricing guide for onboardingdeft.  2024 pricing guide for onboarding
deft. 2024 pricing guide for onboarding
hello960827
 
Efficient PHP Development Solutions for Dynamic Web Applications
Efficient PHP Development Solutions for Dynamic Web ApplicationsEfficient PHP Development Solutions for Dynamic Web Applications
Efficient PHP Development Solutions for Dynamic Web Applications
Harwinder Singh
 

Recently uploaded (20)

IMG_20240615_091110.pdf dpboss guessing
IMG_20240615_091110.pdf dpboss  guessingIMG_20240615_091110.pdf dpboss  guessing
IMG_20240615_091110.pdf dpboss guessing
 
High-Quality IPTV Monthly Subscription for $15
High-Quality IPTV Monthly Subscription for $15High-Quality IPTV Monthly Subscription for $15
High-Quality IPTV Monthly Subscription for $15
 
DearbornMusic-KatherineJasperFullSailUni
DearbornMusic-KatherineJasperFullSailUniDearbornMusic-KatherineJasperFullSailUni
DearbornMusic-KatherineJasperFullSailUni
 
Prescriptive analytics BA4206 Anna University PPT
Prescriptive analytics BA4206 Anna University PPTPrescriptive analytics BA4206 Anna University PPT
Prescriptive analytics BA4206 Anna University PPT
 
Best Competitive Marble Pricing in Dubai - ☎ 9928909666
Best Competitive Marble Pricing in Dubai - ☎ 9928909666Best Competitive Marble Pricing in Dubai - ☎ 9928909666
Best Competitive Marble Pricing in Dubai - ☎ 9928909666
 
❼❷⓿❺❻❷❽❷❼❽ Dpboss Matka Result Satta Matka Guessing Satta Fix jodi Kalyan Fin...
❼❷⓿❺❻❷❽❷❼❽ Dpboss Matka Result Satta Matka Guessing Satta Fix jodi Kalyan Fin...❼❷⓿❺❻❷❽❷❼❽ Dpboss Matka Result Satta Matka Guessing Satta Fix jodi Kalyan Fin...
❼❷⓿❺❻❷❽❷❼❽ Dpboss Matka Result Satta Matka Guessing Satta Fix jodi Kalyan Fin...
 
The Most Inspiring Entrepreneurs to Follow in 2024.pdf
The Most Inspiring Entrepreneurs to Follow in 2024.pdfThe Most Inspiring Entrepreneurs to Follow in 2024.pdf
The Most Inspiring Entrepreneurs to Follow in 2024.pdf
 
The latest Heat Pump Manual from Newentide
The latest Heat Pump Manual from NewentideThe latest Heat Pump Manual from Newentide
The latest Heat Pump Manual from Newentide
 
PM Surya Ghar Muft Bijli Yojana: Online Application, Eligibility, Subsidies &...
PM Surya Ghar Muft Bijli Yojana: Online Application, Eligibility, Subsidies &...PM Surya Ghar Muft Bijli Yojana: Online Application, Eligibility, Subsidies &...
PM Surya Ghar Muft Bijli Yojana: Online Application, Eligibility, Subsidies &...
 
State of D2C in India: A Logistics Update
State of D2C in India: A Logistics UpdateState of D2C in India: A Logistics Update
State of D2C in India: A Logistics Update
 
AI Transformation Playbook: Thinking AI-First for Your Business
AI Transformation Playbook: Thinking AI-First for Your BusinessAI Transformation Playbook: Thinking AI-First for Your Business
AI Transformation Playbook: Thinking AI-First for Your Business
 
2024.06 CPMN Cambridge - Beyond Now-Next-Later.pdf
2024.06 CPMN Cambridge - Beyond Now-Next-Later.pdf2024.06 CPMN Cambridge - Beyond Now-Next-Later.pdf
2024.06 CPMN Cambridge - Beyond Now-Next-Later.pdf
 
Unlocking WhatsApp Marketing with HubSpot: Integrating Messaging into Your Ma...
Unlocking WhatsApp Marketing with HubSpot: Integrating Messaging into Your Ma...Unlocking WhatsApp Marketing with HubSpot: Integrating Messaging into Your Ma...
Unlocking WhatsApp Marketing with HubSpot: Integrating Messaging into Your Ma...
 
Registered-Establishment-List-in-Uttarakhand-pdf.pdf
Registered-Establishment-List-in-Uttarakhand-pdf.pdfRegistered-Establishment-List-in-Uttarakhand-pdf.pdf
Registered-Establishment-List-in-Uttarakhand-pdf.pdf
 
list of states and organizations .pdf
list of  states  and  organizations .pdflist of  states  and  organizations .pdf
list of states and organizations .pdf
 
Sustainable Logistics for Cost Reduction_ IPLTech Electric's Eco-Friendly Tra...
Sustainable Logistics for Cost Reduction_ IPLTech Electric's Eco-Friendly Tra...Sustainable Logistics for Cost Reduction_ IPLTech Electric's Eco-Friendly Tra...
Sustainable Logistics for Cost Reduction_ IPLTech Electric's Eco-Friendly Tra...
 
Satta Matka Dpboss Kalyan Matka Results Kalyan Chart
Satta Matka Dpboss Kalyan Matka Results Kalyan ChartSatta Matka Dpboss Kalyan Matka Results Kalyan Chart
Satta Matka Dpboss Kalyan Matka Results Kalyan Chart
 
Satta Matka Dpboss Kalyan Matka Results Kalyan Chart
Satta Matka Dpboss Kalyan Matka Results Kalyan ChartSatta Matka Dpboss Kalyan Matka Results Kalyan Chart
Satta Matka Dpboss Kalyan Matka Results Kalyan Chart
 
deft. 2024 pricing guide for onboarding
deft.  2024 pricing guide for onboardingdeft.  2024 pricing guide for onboarding
deft. 2024 pricing guide for onboarding
 
Efficient PHP Development Solutions for Dynamic Web Applications
Efficient PHP Development Solutions for Dynamic Web ApplicationsEfficient PHP Development Solutions for Dynamic Web Applications
Efficient PHP Development Solutions for Dynamic Web Applications
 

Equity report nestle

  • 1. Reiterated: March 9, 2016 We project Nestle will perform in line with the overall market over the next 6 to 12 months. This projection is based on our analysis of three key factors that influence common stock performance: current valuation level, revenue growth, and return on equity. 52 Week Price Range CHF 64.80 – CHF 76.60 Market Capitalization CHF 213.87 Billions Annual Dividend Yield 3.3% Annual Dividend Rate CHF 2.30 Industry Drugs Revenues decreased from CHF 92.1 Billion to CHF 91.6 Billion for a decrease of 0.5% year over year. In 2010 Revenues were CHF 93 Billion and unless this level is surpassed again sustained growth is absent. As revenue growth ultimately drives both PE ratios and Return on Equity higher, both drivers for stock price appreciation, we cannot expect shares to break above its 52-week Price Range. Equity increased from CHF 62.5 Billion CHF 70.1 Billion for a growth rate of 12% suggesting effective capital management, especially in absence of revenue growth. As increase in equity drives share price, this rate is neutral to positive. Based on past five-year P/CF high/low of 11 and 17 and cash-flow of CHF 4.60 we forecast a trading range for the shares of between CHF 51 and CHF 78; therefore, with a current price of CHF 71.35 the shares are fairly priced to slightly over-valued. Based on historical high/low price book value ratios of 3.55/2.55 multiplied by the latest book value of 22.10 we get a projected range of 56-78. Report Date: March 9, 2016 Price as of March 8, 2016
  • 2. 2 that owns a vas line-up of well-known brands with the most recognizable being: Carnation, Coffee-Mate, Dreyer’s, Friskies, Gerber, Gourmet, HäagenDazs, KitKat, Maggi, Mövenpick, Nescafe, Perrier, Purina, S. Pellegrino, Smarties, Thomy. Cash-Flow Valuation Bands Valuation bands are based on the highest and lowest Price/CF ratio in the past five years applied to the trailing 12-month cash-flow. Price (CHF) 0 20 40 60 80 100 2011 2012 2013 2014 2015 Lower Band Upper Band Report Date: March 9, 2016 Price as of March 8, 2016
  • 3. 3 Book Value Valuation Bands Valuation Bands are based on highest and lowest price/book value ratios based on trailing 12 month book- value 2010 2011 2012 2013 2014 REVENUE GROWTH -14% -10% 7% 3% -1% CASH 4.00 3.20 4.90 4.70 4.60 RETURN ON EQUITY 26% -8% 7% 3% 12% BOOK VALUE 18.40 17.80 19.10 19.60 22.10 DIVIDEND PAID 1.85 1.95 2.05 2.15 2.20 DIVIDEND YIELD 3.3% 3.6% 3.4% 3.3% 3.0% 0 20 40 60 80 100 2011 2012 2013 2014 2015 2016 Lower Band Upper Band
  • 4. 4 Meier's Hold recommendation on Nestle is the result of our systematic analysis on four basic characteristics: revenue strength, relative valuation, book value, and return on equity. The company has generated a negative trend in revenue growth over the past 5 years and hasn’t surpassed the level reached in 2009. However, while the company hasn’t reached its downwards revised forecast several times, Nestle has improved its return on equity and increased its dividends continuously. Based on its current valuation, the company is neutrally priced and doesn’t offer opportunistic capital appreciation potential over the next 12 months. Due to the maturity and size of the company we focus on book value price bands. The company has a constant and predictable price velocity around BV and should only be aggressively bought if they fall below 56 CHF. The shares demonstrate low volatility and have a yield over 3% and could be interesting for fixed income investors, Revenue Strength is Negative Return on Equity is a key fundamental measure for the health of a business. For blue chip companies with high value brands this measure should be above 15% year after year. And although over the last period a positive rate of 12% was reached, the recent history was disappointing with negative to single digits ROE. The decline since the 26% recorded in 2010, demonstrates weakness. We assign a neutral rating in this respect only due to the last period return to double digit ROE. Return on Equity is Neutral Return on Equity is a key fundamental measure for the health of a business. For blue chip companies with high value brands this measure should be above 15% year after year. And although over the last period a positive rate of 12% was reached, the recent history was disappointing with negative to single digits ROE. The decline since the 26% recorded in 2010, demonstrates weakness. We assign a neutral rating in this respect only due to the last period return to double digit ROE. Cash-flow Strength is Negative Cash-Flow has not had much growth in the last 5 years and has decreased in the last period. The loss of cash-flow generating power and lack of ability to overcome 2012 levels show weakness. And although 2012 was promising with positive cash-flow growth, 2013 was negative again. This persistent weakness combined with the recent down-turn is an indication of weakness that could lead to poor stock performance. Historical research shows that cash-flow strength is an important factor driving stock price appreciation. Meier measures cash-flow growth, and momentum changes to get an early indication of changing cash-flow patterns. Meier does its valuation work not based on future estimates, which are pure guesswork, but on factual historical data, analyzed to project future potential. Book-Value strength is Positive Mature companies can be accurately valued based on price book value historical velocity. And a growing book value is a good indicator that shares will appreciate in line with it. Prices have shown a narrow trading range around book value with high/low factors of 2.55 and 3.55 over the last five years. So the increase over the last period of 13% is a positive indicator that share-prices will appreciate in line with book value growth momentum, all else being equal. Report Date: March 9, 2016 Price as of March 8, 2016
  • 5. 5 Report Date: March 9, 2016 Price as of March 8, 2016 Meier Stock Ratings: Meier covers stocks traded on the Swiss Exchange using a proprietary quantitative model that evaluates a company’s revenue and cash-flow strength, its relative valuation, such as price/cash-flow historical velocity, and price book-value historical velocity. Meier’s five recommendation ratings include strong buy, buy, hold, sell, strong sell. For all stocks in our coverage universe, ratings are generated each quarter and reflect the fundamental and price data as of the last trading day of the quarter. Quality Rating: Quality Rating is based on factors that indicate a company’s overall financial strength and earnings predictability. Each company in the Meier database is assigned a quality rating ranging from A+ to C- based on size, debt level, earnings history and industry stability. High quality stocks tend to have higher average market capitalizations and annual sales, as well as lower average levels of debt as a percent of equity and lower earnings variability. High quality stocks also tend to have lower standard deviations of annual returns. Accordingly, a firm’s quality rating may be used to gauge the risk associated with a particular stock. The Quality Rating letter grades are translated into the following categories: A- and higher are High Quality; B and B+ are Good Quality; B- is Average Quality; C+ is Low Quality; C and lower are Very Poor Quality. Valuation Bands: The Ford Valuation Bands charts shows the price performance of the stock over the past 5 year period in relation to its historical price/cash-flow, and the price/book-value valuation range. The red and green lines indicate the highest and lowest P/CF&P/BV, respectively, in the past 5 years multiplied by trailing 12-month cash- flow/book-value per share at the plotted point. The end point prices shows the current share price (in black) along with the potential high price based on the highest realized P/E & P/BVin the past 5 years (in red), potential low price based on lowest realized P/E & P/BV in the past 5 years (in green). Disclaimer The reports and the ratings contained herein were prepared by Meier Equity Research solely for the use of its clients and authorized subscribers. Reproduction or distribution of such reports or ratings in any form is prohibited without the express prior written permission of Meier Equity Research. The reports and ratings are based on publicly available information believed to be reliable. Meier Equity Research endeavors to present the timeliest and most accurate data possible, but accuracy in not guaranteed. Additional information, such as corporate actions, industry and economic factors, and other events and circumstances that may affect a stock’s price may not be reflected in the Meier Equity Research rating or in the data presented. This report is for information purposes only and should not be construed as an offer to buy or sell any security. Recommendations made in this report may not be suitable for all investors. Recommendations do not take into account the individual user’s investment risk or return objectives or constraints. Meier is not responsible for the results of actions taken based on the information presented. Opinions expressed herein are subject to change without notice. The research process used is derived solely from a quantitative approach that uses historical data to produce a stock ranking system. Each covered stock is assigned one of five ratings based on relative scores, Strong Buy, Buy, Hold,