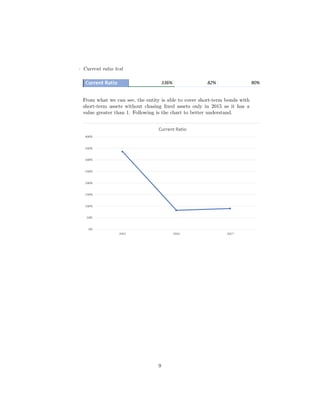
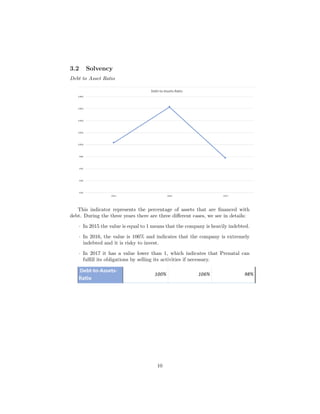
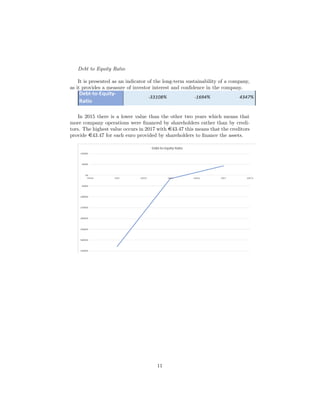
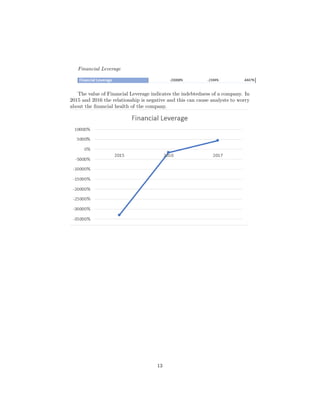
Final Written Essay Financial Analysis
Francesca Pappalardo
November 2018
1
Contents
1 The Company 3
2 The Cash Flow Statement in details 4
3 Financial Analysis 8
3.1 Liquidity . . . . . . . . . . . . . . . . . . . . . . . . . . . . . . . 8
3.2 Solvency . . . . . . . . . . . . . . . . . . . . . . . . . . . . . . . . 10
3.3 Profitability . . . . . . . . . . . . . . . . . . . . . . . . . . . . . . 12
4 Swot Analysis 14
5 Conclusion 15
2
1 The Company
The company involved in my case study is Prenatal. In 1996 it joined the com-
mercial agency Artsana managed by the Catelli family until 2016, after which
it was controlled by the Investindustrial (Andrea Bonomi). With this strategy,
it implements its turnover of over 600 billion. Artsana on the market since
1946 with major brands such as Chicco, Boppy, Pic Solution and Control uses
this adoption as a wild card allowing entry into a different market dedicated
to maternity clothing and accessories for children, covering not only a high-end
market with the Chicco brand but also a medium range. Among the main
competitors of Prenatal are Zara and Benetton. Zara has a high market share
compared to price positioning, as well as Benetton has a high ”Brand Loyalty”,
but nevertheless Prenatal offers a high-quality product but at a higher price.
Moreover, Prenatal, besides being present in Italy, also controls the offices of
Spain, Greece, and Portugal.
Figure 1: International Franchising
3
2 The Cash Flow Statement in details
To carry out a precise analysis of the company, I analyzed the financial state-
ments relating to the same of the years 2015, 2016 and 2017. I have generated
the Balance Sheet for each year, submitting it to the default form.
Balance Sheet - Assets
In the Assets column we have two main values which are: Total Current As-
sets and Total Fixed Assets. Expenses related to Total Current Assets includes
the activities of a company that should be consumed, used through commercial
transactions and/or converted into cash in less than a year. From what we de-
duce in these three years taken into account the total value results to be in a
range between e85000000 and e87000000.
Another value to highlight is the value of Total Fixed Assets. It is also known
as (PP&E) which stands for property, plant, and equipment, and is defined as
Fixed as these activities will not be used within the accounting year. For this
value, there is a decrease with the increase of the years.
Finally, there is Total Assets which represents the set of assets of the company.
We notice a clear descent during the three years.
4
Balance Sheet - Liabilities
The main values that are highlighted are: The debts of the company due
within one operating cycle (or one year) are represented by the Total Current
Liabilities value. It is clear from the Balance Sheet that the company situation
is not one of the best since 2015 the value has increased, but we observe below
the total of the liabilities that value presents. Total Liabilities is a value that
includes the legal financial obligations of a company that arise during commer-
cial operations, in turn in the case study from 2015 to 2017 decreases by well
e18.508.309 After that, it is clear that Equity refers to the company receivables
related to the company’s activities, which shows the total assets net of total
liabilities. And finally, the final result Total Liabilities and Equity which tends
to decrease from 2015 to 2017.
5
Income Statement
The most important factors in the Income Statement are:
· Total Income The company has suffered a net decrease of 9 million from
2015 to 2016 due to the reorganization of the sales network that led to the
closure of 8 sales points because they were not profitable.
· EBIT representing the company to generate profits, is negative for all
three years, but it shows a positive trend compared to the figure recorded
in the same period of the previous year.
· EBITDA Shows a negative profitability but with a positive trend com-
pared to the previous year, this improvement was allowed by the change
in staff costs due to the reorganization and reduction of staff.
· Net Income Sale represents the company earnings values also in red.
6
Cash Flow Statement
We note the decrease in the value of Net cash provided by operating activities
during the three years, which represents the money that a company draws from
normal commercial activities in progress, such as the production of goods and
taxes.
In addition, for the year 2015-2016 and 2017 there is a negative cash flow
deriving from investment activities which include the purchase of tangible and
intangible fixed assets which cost increased from 2015 to 2017.
The last result to be taken into consideration is the cash flow of Prenatal deriv-
ing from the financing activity which for the year 2015 led to a net cash flow of
e-11286902. Being a negative value, it may indicate that the company is ser-
vicing debt or repurchasing shares. From the three years of budgets taken into
account, it is clear that in 2017 there is a positive trend reversal, even if mod-
erate, with a not high value shown by the EBITDA value. So, from 2017 the
Prenatal is trying to improve the financial situation.
7
3 Financial Analysis
In order to accurately assess the financial health and long-term sustainability
of the company, it is useful to consider certain financial parameters. Let’s see
later in details.
Below, we report the values respectively to the years 2015, 2016 and 2017 and
their respective meanings.
3.1 Liquidity
Liquidity is a key factor in the assessment of the financial health of the company,
to evaluate it we use two measures known as Quick Ratio and Current Ratio.
· Quick test Ratio It expresses the company’s ability to cope with current
debts with available liquid cash resources.
We can be observed that the percentage. We note that in 2016 and 2017
the ratio is less than 1 and this is a warning sign, as it indicates that
current liabilities exceed current assets. Let’s see the trend better with
the graph developed over three years.
8
· Current ratio test
From what we can see, the entity is able to cover short-term bonds with
short-term assets without chasing fixed assets only in 2015 as it has a
value greater than 1. Following is the chart to better understand.
9
3.2 Solvency
Debt to Asset Ratio
This indicator represents the percentage of assets that are financed with
debt. During the three years there are three different cases, we see in details:
· In 2015 the value is equal to 1 means that the company is heavily indebted.
· In 2016, the value is 106% and indicates that the company is extremely
indebted and it is risky to invest.
· In 2017 it has a value lower than 1, which indicates that Prenatal can
fulfill its obligations by selling its activities if necessary.
10
Debt to Equity Ratio
It is presented as an indicator of the long-term sustainability of a company,
as it provides a measure of investor interest and confidence in the company.
In 2015 there is a lower value than the other two years which means that
more company operations were financed by shareholders rather than by credi-
tors. The highest value occurs in 2017 with e43.47 this means that the creditors
provide e43.47 for each euro provided by shareholders to finance the assets.
11
3.3 Profitability
Profitability ratios are a class of financial metrics that are used to assess a busi-
ness’s ability to generate earnings relative to its associated expenses.
Profit Margin: The percentages calculated over the three years have a nega-
tive value, which indicates that the company has not earned against gross sales
for the corresponding financial years. This means that the net loss for the period
is 6% of sales. For every e1 of sales, you lost e0.06.
Profitability is also analyzed in relation to costs and expenses, and with re-
spect to activities to see how effective a company is in implementing resources
to generate sales and profits.
ROA For all three years it has a negative percentage and this value tends to
indicate how a company can act on what it owns, so the negative percentage
it presents is not a positive factor. We note that the net income is in red so
that the ROA is also negative. The company can present a negative cash flow,
offsetting many revenues with depreciation. Finally, it can be said that the
company is not able to generate returns in relation to its deployed capital.
ROE In the year 2017 it has a negative percentage, which indicates that the
return on the investment made by the shareholders of the company has not
yielded anything, but in 2015 the percentage is the highest and this could mean
that the company has been successful in generating profits internally.
12
Financial Leverage
The value of Financial Leverage indicates the indebtedness of a company. In
2015 and 2016 the relationship is negative and this can cause analysts to worry
about the financial health of the company.
13
4 Swot Analysis
In this section, I introduce the SWOT Analysis.
I preferred to organize this in a graphic way by placing the Threats in the
opposite direction to the Opportunities and the Strength them in an opposite
way to the Weakness.
Figure 2: SWOT Analysis of the Prenatal Company
14
5 Conclusion
The company’s financial performance is not one of the best, but it is important
to underline that the Prenatal company is a trademark underlying the great
Prenatal Retail Group, so even though most of the results are negative, the
latter is offset by the results positive obtained by the other companies of the
group. Despite this, Prenatal SPA is working to implement new strategies
including:
· Aim for marketing and digital
· Cost optimization, so as to combat competing brands.
· Promotion of the brand with the implementation of a line of products.
Entrusting of the production of articles to Giordani, which will mainly
focus on light clothing and childcare.
· Continue the restructuring of multi-format pdv (point of sale), that is, in
each store are creating corners, that is, in the stores (ex. Toys) there are
also small departments of the Prenatal group
15

Final written Essay Francesca Pappalardo

  • 1.
    Final Written EssayFinancial Analysis Francesca Pappalardo November 2018 1
  • 2.
    Contents 1 The Company3 2 The Cash Flow Statement in details 4 3 Financial Analysis 8 3.1 Liquidity . . . . . . . . . . . . . . . . . . . . . . . . . . . . . . . 8 3.2 Solvency . . . . . . . . . . . . . . . . . . . . . . . . . . . . . . . . 10 3.3 Profitability . . . . . . . . . . . . . . . . . . . . . . . . . . . . . . 12 4 Swot Analysis 14 5 Conclusion 15 2
  • 3.
    1 The Company Thecompany involved in my case study is Prenatal. In 1996 it joined the com- mercial agency Artsana managed by the Catelli family until 2016, after which it was controlled by the Investindustrial (Andrea Bonomi). With this strategy, it implements its turnover of over 600 billion. Artsana on the market since 1946 with major brands such as Chicco, Boppy, Pic Solution and Control uses this adoption as a wild card allowing entry into a different market dedicated to maternity clothing and accessories for children, covering not only a high-end market with the Chicco brand but also a medium range. Among the main competitors of Prenatal are Zara and Benetton. Zara has a high market share compared to price positioning, as well as Benetton has a high ”Brand Loyalty”, but nevertheless Prenatal offers a high-quality product but at a higher price. Moreover, Prenatal, besides being present in Italy, also controls the offices of Spain, Greece, and Portugal. Figure 1: International Franchising 3
  • 4.
    2 The CashFlow Statement in details To carry out a precise analysis of the company, I analyzed the financial state- ments relating to the same of the years 2015, 2016 and 2017. I have generated the Balance Sheet for each year, submitting it to the default form. Balance Sheet - Assets In the Assets column we have two main values which are: Total Current As- sets and Total Fixed Assets. Expenses related to Total Current Assets includes the activities of a company that should be consumed, used through commercial transactions and/or converted into cash in less than a year. From what we de- duce in these three years taken into account the total value results to be in a range between e85000000 and e87000000. Another value to highlight is the value of Total Fixed Assets. It is also known as (PP&E) which stands for property, plant, and equipment, and is defined as Fixed as these activities will not be used within the accounting year. For this value, there is a decrease with the increase of the years. Finally, there is Total Assets which represents the set of assets of the company. We notice a clear descent during the three years. 4
  • 5.
    Balance Sheet -Liabilities The main values that are highlighted are: The debts of the company due within one operating cycle (or one year) are represented by the Total Current Liabilities value. It is clear from the Balance Sheet that the company situation is not one of the best since 2015 the value has increased, but we observe below the total of the liabilities that value presents. Total Liabilities is a value that includes the legal financial obligations of a company that arise during commer- cial operations, in turn in the case study from 2015 to 2017 decreases by well e18.508.309 After that, it is clear that Equity refers to the company receivables related to the company’s activities, which shows the total assets net of total liabilities. And finally, the final result Total Liabilities and Equity which tends to decrease from 2015 to 2017. 5
  • 6.
    Income Statement The mostimportant factors in the Income Statement are: · Total Income The company has suffered a net decrease of 9 million from 2015 to 2016 due to the reorganization of the sales network that led to the closure of 8 sales points because they were not profitable. · EBIT representing the company to generate profits, is negative for all three years, but it shows a positive trend compared to the figure recorded in the same period of the previous year. · EBITDA Shows a negative profitability but with a positive trend com- pared to the previous year, this improvement was allowed by the change in staff costs due to the reorganization and reduction of staff. · Net Income Sale represents the company earnings values also in red. 6
  • 7.
    Cash Flow Statement Wenote the decrease in the value of Net cash provided by operating activities during the three years, which represents the money that a company draws from normal commercial activities in progress, such as the production of goods and taxes. In addition, for the year 2015-2016 and 2017 there is a negative cash flow deriving from investment activities which include the purchase of tangible and intangible fixed assets which cost increased from 2015 to 2017. The last result to be taken into consideration is the cash flow of Prenatal deriv- ing from the financing activity which for the year 2015 led to a net cash flow of e-11286902. Being a negative value, it may indicate that the company is ser- vicing debt or repurchasing shares. From the three years of budgets taken into account, it is clear that in 2017 there is a positive trend reversal, even if mod- erate, with a not high value shown by the EBITDA value. So, from 2017 the Prenatal is trying to improve the financial situation. 7
  • 8.
    3 Financial Analysis Inorder to accurately assess the financial health and long-term sustainability of the company, it is useful to consider certain financial parameters. Let’s see later in details. Below, we report the values respectively to the years 2015, 2016 and 2017 and their respective meanings. 3.1 Liquidity Liquidity is a key factor in the assessment of the financial health of the company, to evaluate it we use two measures known as Quick Ratio and Current Ratio. · Quick test Ratio It expresses the company’s ability to cope with current debts with available liquid cash resources. We can be observed that the percentage. We note that in 2016 and 2017 the ratio is less than 1 and this is a warning sign, as it indicates that current liabilities exceed current assets. Let’s see the trend better with the graph developed over three years. 8
  • 9.
    · Current ratiotest From what we can see, the entity is able to cover short-term bonds with short-term assets without chasing fixed assets only in 2015 as it has a value greater than 1. Following is the chart to better understand. 9
  • 10.
    3.2 Solvency Debt toAsset Ratio This indicator represents the percentage of assets that are financed with debt. During the three years there are three different cases, we see in details: · In 2015 the value is equal to 1 means that the company is heavily indebted. · In 2016, the value is 106% and indicates that the company is extremely indebted and it is risky to invest. · In 2017 it has a value lower than 1, which indicates that Prenatal can fulfill its obligations by selling its activities if necessary. 10
  • 11.
    Debt to EquityRatio It is presented as an indicator of the long-term sustainability of a company, as it provides a measure of investor interest and confidence in the company. In 2015 there is a lower value than the other two years which means that more company operations were financed by shareholders rather than by credi- tors. The highest value occurs in 2017 with e43.47 this means that the creditors provide e43.47 for each euro provided by shareholders to finance the assets. 11
  • 12.
    3.3 Profitability Profitability ratiosare a class of financial metrics that are used to assess a busi- ness’s ability to generate earnings relative to its associated expenses. Profit Margin: The percentages calculated over the three years have a nega- tive value, which indicates that the company has not earned against gross sales for the corresponding financial years. This means that the net loss for the period is 6% of sales. For every e1 of sales, you lost e0.06. Profitability is also analyzed in relation to costs and expenses, and with re- spect to activities to see how effective a company is in implementing resources to generate sales and profits. ROA For all three years it has a negative percentage and this value tends to indicate how a company can act on what it owns, so the negative percentage it presents is not a positive factor. We note that the net income is in red so that the ROA is also negative. The company can present a negative cash flow, offsetting many revenues with depreciation. Finally, it can be said that the company is not able to generate returns in relation to its deployed capital. ROE In the year 2017 it has a negative percentage, which indicates that the return on the investment made by the shareholders of the company has not yielded anything, but in 2015 the percentage is the highest and this could mean that the company has been successful in generating profits internally. 12
  • 13.
    Financial Leverage The valueof Financial Leverage indicates the indebtedness of a company. In 2015 and 2016 the relationship is negative and this can cause analysts to worry about the financial health of the company. 13
  • 14.
    4 Swot Analysis Inthis section, I introduce the SWOT Analysis. I preferred to organize this in a graphic way by placing the Threats in the opposite direction to the Opportunities and the Strength them in an opposite way to the Weakness. Figure 2: SWOT Analysis of the Prenatal Company 14
  • 15.
    5 Conclusion The company’sfinancial performance is not one of the best, but it is important to underline that the Prenatal company is a trademark underlying the great Prenatal Retail Group, so even though most of the results are negative, the latter is offset by the results positive obtained by the other companies of the group. Despite this, Prenatal SPA is working to implement new strategies including: · Aim for marketing and digital · Cost optimization, so as to combat competing brands. · Promotion of the brand with the implementation of a line of products. Entrusting of the production of articles to Giordani, which will mainly focus on light clothing and childcare. · Continue the restructuring of multi-format pdv (point of sale), that is, in each store are creating corners, that is, in the stores (ex. Toys) there are also small departments of the Prenatal group 15