Downloaded 63 times

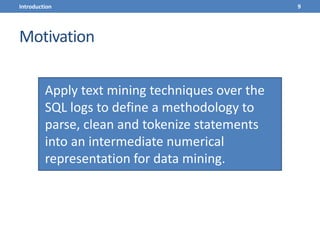
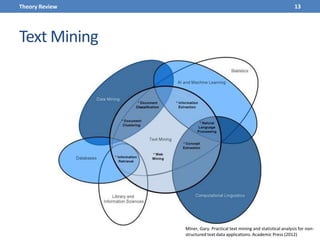
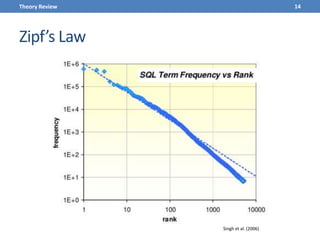
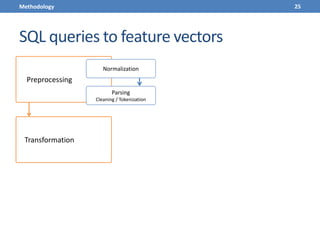
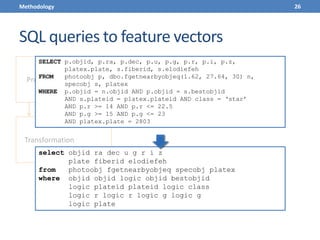
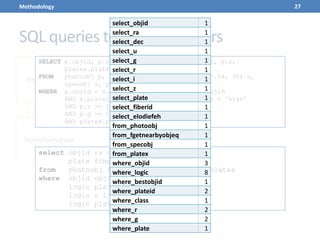
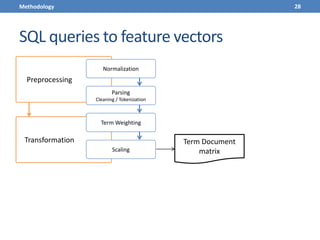
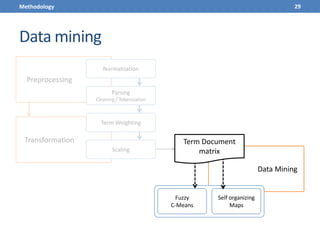
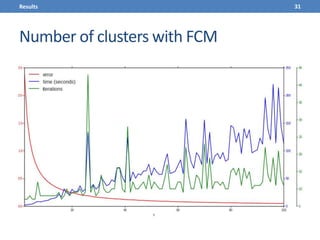


This document presents a methodology for applying text mining techniques to SQL query logs from the Sloan Digital Sky Survey (SDSS) SkyServer database. The methodology involves parsing, cleaning, and tokenizing SQL queries to represent them as feature vectors that can be analyzed using data mining algorithms. Experimental results demonstrate clustering SQL queries using fuzzy c-means clustering and visualizing relationships between queries using self-organizing maps. The methodology is intended to provide insights into database usage patterns from analysis of the SQL query logs.


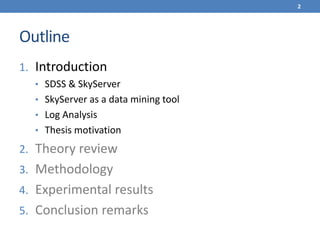
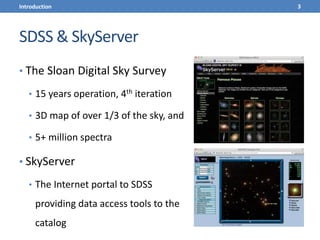
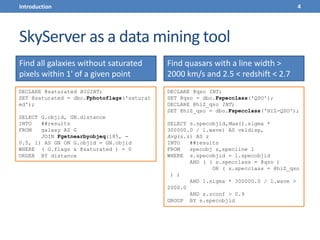
![[系列活動] 資料探勘速遊](https://cdn.slidesharecdn.com/ss_thumbnails/0114ycchendmquicktour-170110050658-thumbnail.jpg?width=640&height=640&fit=bounds)


![ANIMAL_CELL_,_TISSUE_AND_ORGAN_CULTURE[1].pptx](https://cdn.slidesharecdn.com/ss_thumbnails/animalcelltissueandorganculture1-260204172026-4462b440-thumbnail.jpg?width=640&height=640&fit=bounds)


