Download as PDF, PPTX


![GC Steps: DELETION [normal]](https://image.slidesharecdn.com/javaperformancetuning-koders-210217095257/85/Java-Performance-Tuning-53-320.jpg)
![GC Steps: DELETION [COMPACTING]](https://image.slidesharecdn.com/javaperformancetuning-koders-210217095257/85/Java-Performance-Tuning-54-320.jpg)

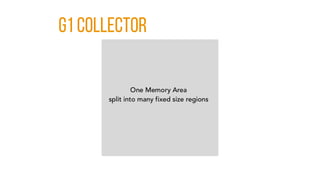
![g1 Collector [REGIONS]](https://image.slidesharecdn.com/javaperformancetuning-koders-210217095257/85/Java-Performance-Tuning-82-320.jpg)
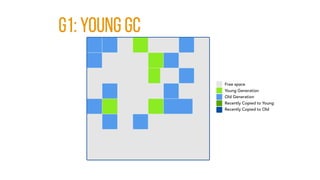
![g1: YOUNG GC [end]](https://image.slidesharecdn.com/javaperformancetuning-koders-210217095257/85/Java-Performance-Tuning-85-320.jpg)
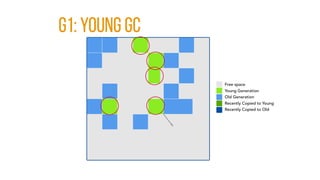
![g1: PHASES [INITIAL MARK]](https://image.slidesharecdn.com/javaperformancetuning-koders-210217095257/85/Java-Performance-Tuning-87-320.jpg)
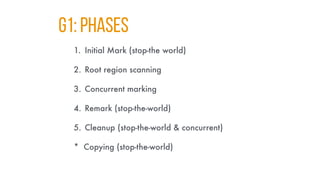
![g1: PHASES [Concurrent mark]](https://image.slidesharecdn.com/javaperformancetuning-koders-210217095257/85/Java-Performance-Tuning-88-320.jpg)
![g1: PHASES [REMARK]](https://image.slidesharecdn.com/javaperformancetuning-koders-210217095257/85/Java-Performance-Tuning-89-320.jpg)
![g1: PHASES [COPYING/CLEANUP]](https://image.slidesharecdn.com/javaperformancetuning-koders-210217095257/85/Java-Performance-Tuning-90-320.jpg)
![g1: PHASES [AFTER COPYING]](https://image.slidesharecdn.com/javaperformancetuning-koders-210217095257/85/Java-Performance-Tuning-91-320.jpg)


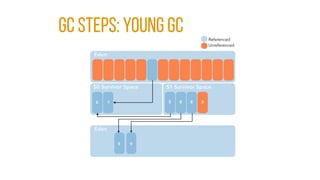
![PARALLEL COLLECTOR: TIPS
• Suitable for applications that target throughput rather
than responsiveness
• Suitable for platforms that have multiple processors &
cores
• -XX:ParallelGCThreads=[N] can be used to specify GC
thread count
• default = Runtime.availableProcessors() (JDK 7+)
• Better reduced if multiple JVMs running on the same machine](https://image.slidesharecdn.com/javaperformancetuning-koders-210217095257/85/Java-Performance-Tuning-146-320.jpg)


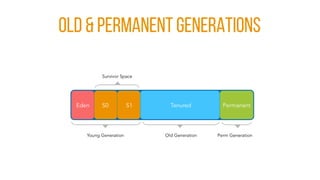
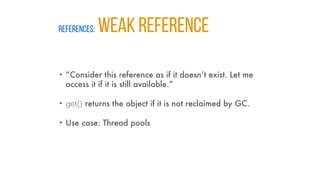
![REFERENCES: SOFT REFERENCE
• “Clear this object if you don’t have enough memory, I
can handle that.”
• get() returns the object if it is not reclaimed by GC.
• -XX:SoftRefLRUPolicyMSPerMB=[n] can be used to
control lifetime of the reference (default 1000 ms)
• Use case: Caches](https://image.slidesharecdn.com/javaperformancetuning-koders-210217095257/85/Java-Performance-Tuning-161-320.jpg)


The document serves as a comprehensive guide on Java performance tuning, covering various aspects including JVM structure, garbage collection types, and performance monitoring techniques. It discusses methodologies for profiling and tuning Java applications to address issues such as memory leaks, lock contention, and CPU utilization. The content emphasizes best practices for optimizing application performance and understanding garbage collection processes, alongside practical tools and techniques for effective performance management.